3.11 Results of dimerization incompatibility. Chart denotes the fraction of all pairs of primers that share a perfect match of the given length. t1. - at both 3' ends, ...
Optimization Problems in Design of Oligonucleotides for Hybridization based Methods
Doron Lipson
Optimization Problems in Design of Oligonucleotides for Hybridization based Methods
Research Thesis
Submitted in partial fulfillment of the requirements for the degree of Master of Science in Computer Science
Doron Lipson
Submitted to the Senate of the Technion — Israel Institute of Technology
Heshvan 5762
Haifa
September 2002
This research thesis was done under the supervision of Dr. Zohar Yakhini in the Computer Science department, and Prof. Uri Sivan in the Physics Department. I thank them for their dedicated guidance and assistance in this research.
The generous financial help of the Technion is gratefully acknowledged.
Contents Abstract
1
Notation and Abbreviations
2
1 Introduction
3
1.1
DNA Structure and Hybridization Properties . . . . . . . . . . . . . . .
4
1.1.1
DNA Structure . . . . . . . . . . . . . . . . . . . . . . . . . . .
4
1.1.2
Thermodynamics of Hybridized Oligonucleotides . . . . . . . . .
5
Hybridization based Methods . . . . . . . . . . . . . . . . . . . . . . .
8
2 Design of Specific Oligonucleotide Probes for Hybridization Assays
10
1.2
2.1
2.2
2.3
Background . . . . . . . . . . . . . . . . . . . . . . . . . . . . . . . . .
10
2.1.1
Symbolic Specificity - Problem Definition . . . . . . . . . . . . .
11
2.1.2
Related Work . . . . . . . . . . . . . . . . . . . . . . . . . . . .
12
Algorithms . . . . . . . . . . . . . . . . . . . . . . . . . . . . . . . . . .
13
2.2.1
Exhaustive Search . . . . . . . . . . . . . . . . . . . . . . . . .
15
2.2.2
Indexed Search . . . . . . . . . . . . . . . . . . . . . . . . . . .
15
2.2.3
Abundance-Weighted Indexed Search . . . . . . . . . . . . . . .
22
Application . . . . . . . . . . . . . . . . . . . . . . . . . . . . . . . . .
23
2.3.1
Mapping Specificity of the Entire S. cerevisiae Transcriptome
.
23
2.3.2
Results . . . . . . . . . . . . . . . . . . . . . . . . . . . . . . . .
24
3 Design of Oligonucleotide Sets for Complex Hybridization Reactions 27 3.1
Introduction . . . . . . . . . . . . . . . . . . . . . . . . . . . . . . . . .
27
3.2
A Molecular Implementation of a Shift Register . . . . . . . . . . . . .
28
3.2.1
Background . . . . . . . . . . . . . . . . . . . . . . . . . . . . .
28
3.2.2
Problem Definition . . . . . . . . . . . . . . . . . . . . . . . . .
31
3.2.3
Methods . . . . . . . . . . . . . . . . . . . . . . . . . . . . . . .
32
3.2.4
Application . . . . . . . . . . . . . . . . . . . . . . . . . . . . .
36
Multiplex PCR Primer Design . . . . . . . . . . . . . . . . . . . . . . .
41
3.3
3.3.1
Background . . . . . . . . . . . . . . . . . . . . . . . . . . . . .
41
3.3.2
Problem Definition . . . . . . . . . . . . . . . . . . . . . . . . .
44
3.3.3
Methods . . . . . . . . . . . . . . . . . . . . . . . . . . . . . . .
45
3.3.4
Preliminary Results . . . . . . . . . . . . . . . . . . . . . . . . .
50
3.3.5
Future Work . . . . . . . . . . . . . . . . . . . . . . . . . . . . .
55
A Complete Probe Specificity Maps for the S. cerevisiae Transcriptome 58 B Genetic Algorithms
60
B.1 General . . . . . . . . . . . . . . . . . . . . . . . . . . . . . . . . . . .
60
B.2 Implementation . . . . . . . . . . . . . . . . . . . . . . . . . . . . . . .
62
B.3 Application . . . . . . . . . . . . . . . . . . . . . . . . . . . . . . . . .
63
B.3.1 Maximum Clique in a Hypergraph Problem . . . . . . . . . . .
63
B.3.2 Representative Subgraph Coloring Problem . . . . . . . . . . . .
64
Bibliography
65
List of Figures 1.1
DNA structure: a) a single nucleotide, b) double stranded DNA. . . . .
1.2
DNA melting curves may be monitored by measuring absorbance of light
5
at 260nm. The point at which exactly half of the DNA is double stranded defines its melting temperature (Tm ). The Tm of a DNA molecule may vary, with higher Tm indicating a longer duplex, higher GC content or higher degree of matching. . . . . . . . . . . . . . . . . . . . . . . . . .
6
1.3
Different mismatching patterns in a DNA duplex . . . . . . . . . . . .
7
2.1
Expected distribution of probe specificities (given in distance from background message of length N=9Mb - the size of the yeast transcriptome), for probes of different lengths l. . . . . . . . . . . . . . . . . . . . . . .
2.2
14
Distribution of probe specificity according to theoretical computation in comparison to the specificity distribution retrieved by a search over a genomic database (150 ORFs of S. cervisiae) . . . . . . . . . . . . . . .
2.3
IClaS: Computing some (but possibly not all) distances and classifying probe candidates, using an indexed search . . . . . . . . . . . . . . . .
2.4
14 16
Probe distance maps for three genes of the GAL family. For each gene, the specificity of all possible probes (in Hamming distance from the entire transcriptome) are plotted against their position along the sequence. Areas of specific probes (above a threshold r = 7) are marked above: (a) the sequence of GAL1 contains an area where probes are less specific (this is an area of homology to GAL3), (b) the sequence of GAL2 contains only small stretches of specific probes (because of high similarity to genes from the HXT family), (c) the sequence of GAL4 is almost totally specific, with a probe specificity distribution similar to theory, as shown in (d). . . . . . . . . . . . . . . . . . . . . . . . . . . . . . . . . . . . .
2.5
19
Distribution of probe proximities (in Tm ) according to an arbitrary selection over a genomic database (200 ORFs of S. cerevisiae), for probe of length l = 30. . . . . . . . . . . . . . . . . . . . . . . . . . . . . . . .
21
2.6
Distribution of probe proximities (in Tm ) for two different ORFs: a) GAL4 - a gene with no specificity issues and b) GAL2 - a gene that is highly homologous to genes from the HXT family. x-axis denotes position of probe along the sequence. Compare to specificity maps of the same genes depicted in Figure 2.4. . . . . . . . . . . . . . . . . . .
2.7
22
Distribution of probe specificities for the 6310 ORFs of S. cerevisiae: a) The overall distribution of ORF abundances, b) the distribution of ORFs according to the number of their potential probes, c) the distribution of probeless ORFs according to transcript abundance. Notice the large fraction of highly abundant transcripts that have no probes (25%) in relation to their fraction in the ORF population (5%). . . . . . . . . . .
3.1
26
Schematic representation of the molecular implementation of a shift register: a) seed strand, b) the annealing step, c) the extension step, d) the melting step, e) repetitions of the cycle result in elongation of the seed according to the transfer function, f) addition of the stop strand terminates the process, g) periodic sequences of different lengths may be created . . . . . . . . . . . . . . . . . . . . . . . . . . . . . . . . . . . .
3.2
30
Interference model: a) Two types of interference: i) correct hybridization of the rule strand to the shift register sequence, ii) competition, iii) dimerization. b) Example of possible dimerization interference involving: i,ii) two characters, iii) three characters. . . . . . . . . . . . . . . . . .
33
3.3
Calculation of h(a, (b, c)) over all possible shifts between a and bc or bc
34
3.4
Algorithm for finding a clique close to a given subgraph of a hypergraph. 37
3.5
Number of different compatible characters sets found, as a function of the set size, for r = 3, t = 2, N = {A, C, G, T } . . . . . . . . . . . . .
3.6
40
Product of implementation of molecular shift-register over an alphabet of 4 characters: Σ = {T GG, GT C, GCT, CCT }. Lane (a) contains a standard ruler, lane (b) - reaction products, in which 5 distict bands may be identified, corresponding to the sequence 3.2 with n = 0, ..., 4. Sequence lengths are in base pairs. . . . . . . . . . . . . . . . . . . . .
40
3.7
PCR thermal cycle: a) first cycle, b) typical nth cycle . . . . . . . . . .
42
3.8
PCR exponential emplification. 30 cycles of PCR yield an amplification factor of > 109
. . . . . . . . . . . . . . . . . . . . . . . . . . . . . . .
43
3.9
Possible interference between PCR primers: a) Correct priming, b) Primer dimerization at i) both 3’ ends, ii) one 3’ end or iii) no 3’ ends, c) Mispriming of a non-specific sequence. . . . . . . . . . . . . . . . . .
46
3.10 Algorithm for SLO Coloring [40]. . . . . . . . . . . . . . . . . . . . . .
50
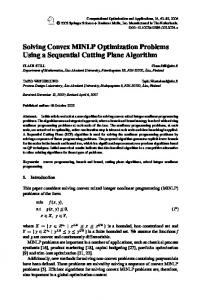
3.11 Results of dimerization incompatibility. Chart denotes the fraction of all pairs of primers that share a perfect match of the given length. t1 - at both 3’ ends, t2 - at one 3’ end, t3 - with no 3’ end requirements. Inexistance of dimers with t1 > 0 is due to primers being predesigned with a 3 end of A/C only (intended to minimize this type of dimerization). 53 3.12 1) Results of SLO coloring for 100 synthetic interference graphs vs 1000 random graphs of the same edge density (e): a) 70 targets with τ2 = 4 (e = 0.2), b) 70 targets with τ2 = 3 (e = 0.47), c) 150 targets with τ2 = 4 (e = 0.2). 2) Results of SLO-GA coloring of 100 synthetic interference graphs with variable primers (5 and 10 primer pairs per target) vs SLO coloring of 100 synthetic interference graphs with presest primers (1 primer pair per target) for the same three configurations. . . . . . . . .
56
B.1 General implementation of a genetic algorithm. . . . . . . . . . . . . .
61
B.2 Schematic representation of Genetic Algorithm modules. Shaded boxes denote abstract classes. Broken arrows represent inheretence. . . . . . .
63
List of Tables 2.1
Running time of IClaS for various seed lengths. EFDS stands for exhaustive full distance search. Times were measured for an arbitrary S. cerevisiae transcript of length m = 300 against the entire transcriptome with l = 30, on a Pentium III 650MHz. The graph depicts a fit for y = a + b/4x . . . . . . . . . . . . . . . . . . . . . . . . . . . . . . . . .
2.2
17
Reliability of IClaS algorithm for a search over 7 ORFs selected randomly from the S. cerevisiae transcriptome (a total of 12184 probes). Parameters for the search were l = 30, α = 95%, r = 7/5/3 (e denoting the corresponding seed length selected to achieve α = 95% for the given r, according to Equation 2.3), or an exhaustive search. Table entries represent the cumulative fraction of probes for a given distance d or less, found in each search. Since the algorithm never overestimates a probe’s specificity, results show that the actual reliability is 100% at the desired threshold (shaded cells). . . . . . . . . . . . . . . . . . . . . . .
2.3
20
Threshold distance r required between a probe to a transcript of abundance at to avoid cross-hybridization to a background transcript of abundance ab . High abundance was considered as > 10 transcripts per cell, medium abundance > 1 transcripts per cell and low abundance for all other transcripts. . . . . . . . . . . . . . . . . . . . . . . . . . . . . . .
24
3.1
Maximum alphabets for r = 3, t = 2, N = {A, C, G} . . . . . . . . . .
38
3.2
Sample of maximum alphabets for r = 3, t = 2, N = {A, C, G, T } . . .
38
3.3
Sample of maximum alphabets for r = 4, t = 2, 4, N = {A, C, G, T } . .
39
3.4
Sequences designed for molecular Shift-Register implementation . . . .
41
3.5
Results of mispriming potential, given in fraction of pairs of primers that flank a significant background sequence, with respect to the given
3.6
parameters . . . . . . . . . . . . . . . . . . . . . . . . . . . . . . . . . .
52
Summary of multiplexing schemes designed for the biological data . . .
53
3.7
Results of co-amplification of 13 targets in a single reaction, in accordance to the prediction of the Multiplex PCR primer design algorithm. (1) Inconclusive result due to the similar sizes of the fargments (2) Unclear genotype (3) Ambiguous result due to multiple SNPs in fragment (4) No result to to absence of detection primer. . . . . . . . . . . . . .
54
A.1 Summary of probe specificity information contained in the file ‘[ORF].map’. 59
Abstract Synthetic oligonucleotides play an important role in a wide range of experimental techniques based on DNA hybridization. In this thesis I present several computational methods for optimizing the design of oligonucleotides for hybridization-based methods. In hybridization assays, such as expression profiling, oligonucleotides are used as probes for detecting and quantifying DNA/RNA in a sample. A major consideration in oligonucleotide probe design is ensuring its specificity for a single target sequence against a wide range of different sequences that appear in the background. I show that using an indexed search it is possible to efficiently map the specificity of candidate probes, taking into account knowledge of the distribution of the background sequences and different thermodynamic models. By means of this method, specificity maps for the entire S. cerevisiae transcriptome are obtained. Different optimization considerations are required when designing oligonucleotides for complex hybridization reactions, such as DNA computing or multiplex PCR. In this type of methodology a large number of oligonucleotides are used as substrates for the given reaction. The design process should take into account the interdependence between the different oligonucleotides taking part in the reaction, and prevent undesired cross-hybridization between them. A scheme for designing oligonucleotides for complex reactions is proposed, composed of exhaustive calculation of interference between subgroups of oligonucleotides based on an interference model, reduction of the problem to an interference graph and derivation of an experimental design by appropriate heuristics for the respective graph-theoretic problems. We show implementation of this scheme for two experimental scenarios - a molecular implementation of a shift register (a DNA computing problem) and multiplex PCR primer design, using genetic algorithm based heuristics for the maximum clique in a hypergraph and representative subgraph coloring problems. For both scenarios we show simulated results as well as preliminary empirical results.
1
Notation and Abbreviations DNA — Deoxyribonucleic Acid. RNA — Ribonucleic Acid. PCR — Polymerase Chain Reaction. Tm (s) — Melting temperature of the sequence s and its perfect complement. Tm (s, t) — Melting temperature of the hybrid of the sequences s and t. N — Alphabet of nucleotides ({A, C, G, T }). WC — Watson-Crick complementarity: A with T, C with G. H(s, t) — Hamming distance between sequences s and t. Kb, Mb, Gb — kilo/mega/gigabase (length of DNA strand). d(s, D) — Distance between a (short) sequence s and a (long) sequence D. (A measure for the specificity of s against a background D.) IClaS — Indexed Classified Search. IClaSA — Indexed Classified Search, Abundance-weighted. ξ — Length of seed in indexed search. ORF — Open Reading Frame (a known or hypothetical gene). G = (V, E) — Interference/compatibility graph. H = (V, E) — Interference/compatibility hypergraph. GA — Genetic Algorithm. HGA — Heuristic-based Genetic Algorithm. SNP — Single Nucleotide Polymorphism. SLO — Smallest Last Order coloring. SLO-GA — Genetic algorithm using SLO coloring as a fitness function.
2
Chapter 1 Introduction Ever since the elucidation of DNA structure in 1953 by Watson and Crick and the understanding of its properties as an information-containing macromolecule, a large variety of experimental techniques involving DNA has been developed, based on these unique attributes. The majority of DNA-based experimental methods rely on the ability of DNA strands to recognize each other in an informative manner and create duplexes, as well as to be processed - ligated, cut and duplicated - while conserving information. The introduction of efficient synthesis of DNA oligonucleotides in 1983 [9] enabled incorporation of synthetic oligonucleotides further expanding the range of possibilities of hybridization based methods. Today, synthetic oligonucleotides are used as detection probes in Southern and northern blotting, in-situ hybridization and gene expression assays, as primers in PCR and elongation reactions, as building-blocks in DNA scaffolding and DNA computing schemes and in many other applications. The design of oligonucleotides for hybridization experiments is basically a simple problem, as the behavior of DNA hybridization is robust and closely follows known theoretical thermodynamic considerations. Traditionally, adherence to “rules of thumb” concerning the length and composition of oligonucleotides in the context of the experimental environment (e.g. the melting temperature of probes) suffices to achieve successful hybridization [26] although computational design of oligonculeotides, based on theoretical thermodynamical considerations, is also common [41]. Design of oligonucleotide primers is a more complex problem but has also been found a list of conditions that may be used for ensuring successful results [33]. However, the advancement of high-throughput techniques in molecular biology in recent years raises the level of difficulty of oligonucleotide design. Large-scale hybridization experiments such as expression profiling arrays and multiplex PCR, which involve a large number of biological or synthetic DNA strands, highlight problems of specificity, cross-interference and com-
3
petition. In this thesis, I address several optimization problems that arise in oligonucleotide design for hybridization based methods. Specifically, I discuss an efficient algorithm for design of specific oligonucleotide probes for expression profiling (Section 2), and algorithms for designing compatible sets of oligonucleotides for complex reactions - a molecular implementation of a shift register (an application of DNA computing) and multiplex PCR (Section 3). The rest of the Introduction section is devoted to background on DNA structure and hybridization properties (Section 1.1), and to a discussion of the different types of hybridization based methods and the different design problems that arise in each type (Section 1.2).
1.1 1.1.1
DNA Structure and Hybridization Properties DNA Structure
Following is a short introduction to DNA structure and hybridization properties. A detailed review of this subject appears in [47]. DNA (deoxyribonucleic acid) is a polymer of deoxyribonucleotide units. A nucleotide consists of a nitrogenous base, a sugar, and a phospate group (see Figure 1.1a). The sugar is deoxyribose. The nitrogenous base is either a derivative of purine - adenine (A) or guanine (G) - or a derivative of pyrimidine - cytosine (C) or thymine (T). The backbone of DNA, which is invariant throughout the molecule, consists of deoxyriboses linked by phosphate groups. The variable part of DNA is its sequence of the four kinds of bases (A, C, G, and T). A DNA strand has polarity: one end of the chain has a 5’-OH group and the other a 3’-OH group. It is important to note that DNA synthesis always occurs in the 50 → 30 direction. DNA naturally occurs as a double strand, consisting of two helical polynucleotide chains that are coiled around a common axis. The chains run in opposite directions. The nitrogenous bases are on the inside of the helix, whereas the backbone is on the outside. The two strands are held together by hydrogen bonds between pairs of bases: adenine is paired with thymine (2 hydrogen bonds) and cytosine with guanine (3 hydrogen bonds) (see Figure 1.1b). The process of dimerization of two complementing DNA strands is termed hybridization.
4
a)
b)
Figure 1.1: DNA structure: a) a single nucleotide, b) double stranded DNA. 1.1.1.1
Conventions in DNA Notation
Base sequence is always written in the 50 → 30 direction. For example, ACTGCTG stands for 5’-ACTGCTG-3’. The complement of a specific DNA strand (shorthand for reverse complement) is its perfect partner in the double helix, taking into account the opposite polarities. For example, the complement of ACTGCTG is CAGCAGT. The complement of a DNA sequence s is denoted s¯. A mismatch in hybridization is a pair of bases from the two hybridized strands that does not comply with A-T/C-G pairing rules. For example, the following duplex contains 2 mismatches: 5’-ACCGCTG-3’ || || | 3’-TGACGTC-5’
1.1.2
Thermodynamics of Hybridized Oligonucleotides
The two strands of a DNA helix readily come apart when the hydrogen bonds between their paired bases are disrupted. This can be accomplished by heating a solution of DNA. The unwinding of the double helix is called melting because it occurs abruptly at a certain temperature. The melting temperature (Tm ) is defined as the temperature at which exactly half of the DNA is double stranded. The melting of DNA can be monitored by measuring its absorbance of light at 260nm (see Figure 1.2). The melting of a DNA molecule highly depends on its base composition. DNA molecules with high GC content have higher Tm than those with low GC content, since G-C base pairs are more stable than A-T pairs. Another parameter that effects the melting temperature is the degree of matching between the two complementing DNA 5
Figure 1.2: DNA melting curves may be monitored by measuring absorbance of light at 260nm. The point at which exactly half of the DNA is double stranded defines its melting temperature (Tm ). The Tm of a DNA molecule may vary, with higher Tm indicating a longer duplex, higher GC content or higher degree of matching. strands in the duplex. A DNA dulpex that contains several mismatches will have a lower Tm than a perfectly matching duplex with the same characteristics. Prediction of the thermodynamic properties of DNA hybrids is a central issue in oligonucleotide design. In essence, almost all design schemes are concerned with assuring that melting temperature of the correct (experimentally desirable) hybridization pattern will be significantly higher than that of incorrect (undesirable) hybrids that might occur spontaneously. In turn, a significant difference in Tm between correct and incorrect hybrids can assure that if the correct experimental environment is provided the desired experimental products will be predominant the undesired artifacts. Following are several accepted models for thermodynamic consideration of DNA, in order of complexity: Fraction of Mismatches The simplest, and respectively most imprecise, method of comparing the thermodynaic stability of different DNA duplexes is by counting the number of mismatches in the duplex and determining the fraction of mismatches. This method is likely to give correct comparisons of stability between similar duplexes. For example, in Figure 1.3, duplex a is likely to be less stable than duplex b as it contains 2 mismtaches out of 8 base pairs (25% mismatch) in comparison to 1 mismatch in 8 (12.5% mismatch). However, this method does not take into account the base content of the duplex or the matching pattern and is therefore unreliable in comparing the stabililty of duplexes with different properties. For example, duplex c is probably more 6
Figure 1.3: Different mismatching patterns in a DNA duplex stable than duplex b, although they both contain the same fraction of mismatches, due to the fact that the single mismatch in duplex c occurs at the very end of the duplex. Simple Approximation of Tm
An accepted simple approximation of the melting
temperature takes into account the fact that G-C pairs are more stable than A-T ones. For short oligonucleotides (< 20bp) the following formula is used, nicknamed the 2-4 rule or the Wallace rule [49] Tm (C◦ ) = (nA + nT ) · 2 + (nC + nG ) · 4 ,
(1.1)
where nA , nC , nG , nT are, repectively, the number of A,C,G,T bases in the strand. For longer oligonucleotides, the following approximation is preferred [21] Tm (C◦ ) = 81.5 + 41 · (xG + xC ) −
500 , l
(1.2)
where xC , xG are, respectively, the fractions of C,G bases in the strand and l is its total length. Equations 1.1 and 1.2 assume that annealing occurs under the standard conditions of 50nM primer, 50mM Na+, and pH 7.0. Modifications for different salt concentrations exist. Nearest Neighbor The basic approximation of Tm accounts for the GC content of the duplex, but does not take into consideration the interactions between neighboring base pairs, also known as base stacking. The most accurate thermodynamic model for predicting Tm is the nearest neighbor method [42, 44, 43] that is based on experimentally derived values for the changes in enthalpy (∆H) and entropy (∆S) during formation of a DNA duplex with a specific sequence Tm (C◦ ) =
∆H − 273.15 , ∆S + R ln(Ct /4)
7
(1.3)
where R is the gas constant, and Ct is total strand concentration. ∆H and ∆S are calculated by summing the nearest-neigbor enthalpy and entropy changes for the entire hybrid. Modifications for different salt concentrations and base mismatches in the duplex exist. In the following chapters, I use the two simpler methods (fraction of mismatches and basic approximation of Tm ) for comparing the thermodynamic stability of DNA hybrids. Revision of the algorithms to the more accurate nearest neighbor model is fairly straightforward in most cases.
1.2
Hybridization based Methods
In this study, I address several issues that arise in the design of oligonucleotides for hybridization-based methods. In general, there are two types of methods that involve hybridization of oligonucleotides, each raising different design issues: In hybridization assays the synthetic oligonucleotide acts as a probe for detecting the presence or quantity of a specific DNA (or RNA) strand in a biological sample. There are many different types of hybridization assays including Southern and northern blotting, in-situ hybridization, PCR and gene expression profiling. In the latter type of experiment thousands of hybridization assays are performed in parallel on a single microarray. The design of oligonucleotides as probes for a hybridization assay poses two types of problems: First is ensuring that the probe is sensitive - that it will indeed detect the target if present - and the second is ensuring that the probe is specific - that it will react only with its intended target. Whilst the analysis of sensitivity is limited to the probe and target complex, the specificity issue involves the entire composition of the biological sample that is being tested. In the genomic era it may be assumed that most, if not all, of the biological background is known and may be considered. In Section 2 I discuss an algorithm for designing specific oligonucleotides for hybridization assays. In hybridization reactions the synthetic oligonucleotides act as substrates for some reaction such as polymerization, ligation or restriction. Hybridization reactions serve in DNA computing, DNA scaffolding and PCR. A specific problem arises in hybridization reactions that involve a large number of different oligonucleotides utilized in the same reaction (we denote these complex hybridization reactions): the design of the individual oligonucleotides must take interference into account, ensuring that non-specific crosshybridization of different oligonucleotides in the reaction does not compete with the 8
intended reaction. Section 3 presents two different problems of oligonucleotide design for complex hybridization reactions: design of an optimal alphabet for a molecular implementation of a shift register (Section 3.2) and optimal primer design for multiplex PCR (Section 3.3). Interestingly, as multiplex PCR is both a hybridization assay and a complex hybridization reaction, the design of primers for multiplex PCR involves problems of both specificity and interference.
9
Chapter 2 Design of Specific Oligonucleotide Probes for Hybridization Assays 2.1
Background
A probe, in the context of the current study is a (nucleic acid) molecule that strongly interacts with a specific target in a detectable and quantifiable manner. Oligonucleotides are used as probes in an increasing number of molecular biology techniques. They are central in Southern and northern blotting, in in-situ hybridization assays, in quantitative PCR, and in array based hybridization assays (chips) where they are immobilized on a surface [6, 31]. Some applications and protocols require probe labeling while in others (e.g. arrays) the target is being labeled. There are, roughly speaking, two parameters by which to evaluate candidate probes for a given application. Sensitivity - is it really going to strongly interact with its target, under the assay’s conditions, and how much target is needed for the reaction to be detectable or quantifiable; and specificity - how well does the probe discriminate between its intended target and other messages that it might cross hybridize to. This study addresses specificity design questions. A particular application in which design and specificity issues arise is gene expression profiling, in which the particular subset of genes expressed at a given stage and its quantitative composition are queried. Such information can help in characterizing sequence to function relationships, in determining effects (and side effects) of experimental treatments, and in understanding other molecular biological processes [27, 46], many with clinical implications [5, 16]. Gene expression profiling is typically performed using array based hybridization assays. The actual probes that populate a custom designed expression profiling array are specifically designed and chosen to measure the
10
expression levels of a defined set of genes. Given the state of the human genome sequence draft and the extent of gene hunting efforts currently invested by the scientific community, it is reasonable to approach gene expression profiling assuming complete knowledge of the sequences of the genes of interest, as well as those of many of the genes expressed in the background message. Specificity issues also in the design of PCR primers [35] and the design and development of anti-sense drugs.
2.1.1
Symbolic Specificity - Problem Definition
Let N = {A, C, G, T } be the alphabet representing the four different nucleotides. Our general design question is as follows. We are given a target gene, g - a sequence over N , of length m; and a background message, D - a large set of sequences with total length N (or, alternatively, a concatenated sequence of the same length) representing all possible mRNA molecules that might be active in our sample1 . In g we seek substrings that represent Watson-Crick (WC) complements to molecules that have a high WC mismatch to the background message. These substrings are presumably good probe binding site candidates, in terms of specificity. Since they don’t have a close WC match in the background message, they do not have a high cross-hybridization potential. An equivalent computational task is to find, in g, the substrings that are far, in Hamming distance, from the background message (as a set). We seek many symbolically specific probe candidates since specificity screening is only one stage in the probe selection process. Formally, we denote the Hamming distance between two strings s, t ∈ N k by P Hk (s, t). More precisely, if s = s1 . . . sk and t = t1 . . . tk then Hk (s, t) = ki=1 1[si 6=ti ] . When considering a probe candidate p and a given background message D, we are interested in the distance between the probe and the entire message. For a string p ∈ N k and a string D ∈ N N , where N >> k, we set d(s, D) =
min
1≤i≤N −k+1
Hk (s, Dii+k−1 ).
(2.1)
Distance, in the Watson-Crick or Hamming sense as described above, is not the only parameter that determines the specificity of a probe candidate. The issues of multiplicity (how many times do mismatches occur in the background), abundance (how strongly expressed are genes with close matches), hybridization potential (how competitive is the background, in terms of thermodynamics and not only homology), 1
Typically, we shall use some database that stores much of (what is known of) this organism/tissue/stage specific information
11
and others, play an important if not well understood and not easily quantified role. In Section 2.2 we shall discuss algorithmic variations for determining symbolic specificity that allow consideration of some of these parameters.
2.1.2
Related Work
Previous work on selecting specific probes for hybridization microarrays is based on searching for probes whose approximate alignments in the the background have a significantly lower melting temperature than the prefect match. Li and Stromo [28] use a suffix array to search for candidate probes that match a small number of times to the background, allowing a small constant number of mismatches. They then apply free energy and melting temperature considerations only to the remaining candidates and select a small number of probes that have stable hybridization structures. Kaderali and Schliep [24] present a heuristic approach for finding the most stable alignment of a candidate probe to a target sequence, using a combination of dynamic programming and suffix trees. Although this approach is in principle the most accurate it is not clear how true the predicted specificity is. Both the above mentioned methods are relatively time consuming and output several probe candidates. Recent work by Rahmann [39] suggests an algorithm for rapid probe selection based on finding longest common substrings as a specificity measure, again using suffix arrays. The methods mentioned above select a small set probes that have best specificity according to some heuristic. They do not take into consideration parameters for tuning the sensitivity and running time of the algorithm. In this study we address these additional issues: • A process for specific probe design, whose output is specificity map of all possible probes for any specific gene, based on Hamming distance from the background message or other possible thermodynamic models. This map can be used as a basis for selecting sensitive probes. • Analysis of the efficiency and effectiveness of the proposed algorithm, as a function of the input parameters. • Consideration of the relative abundance of background transcripts by applying different filters to different relative expression ratios. Abundance, for this purpose, is obtained from pre-existing data. Such data is expected to grow as more expression measurements are performed and as databases storing this information continue to evolve. 12
The rest of this chapter is organized as follows: In Section 2.2 we present algorithmic approaches to assessing probe candidate specificity against available data. We analyze some efficient and effective heuristics and modifications that address transcript abundance and thermodynamic models. In Section 2.3, we discuss implementations and the design of specific probes for the entire S. cerevisiae transcriptome.
2.2
Algorithms
A theoretical study presented in [29] analyzes of the statistical properties of probe specificity against an unknown background, according to a stochastic model. Theoretical distributions for the symbolic specificities of probes of different lengths are depicted in Figure 2.1. This is useful for determining practical probe lengths that provide statistical protection against cross hybridization. However, the uniform distribution assumed in the model is certainly not the same as observed in reality. Comparison of the theoretical results to actual biological data (Figure 2.2) shows that the model predicted probe specificity distribution deviates from the true distribution. A remarkable difference is the noticeable fraction of low specificity probes in the genomic distribution. These are virtually probability 0 events, in the model. The simple and straightforward explanation for this difference is that the genomic data is structured and therefore is expected to contain more similarities than random data. Specifically, since genomic sequences are the results of an evolutionary process, total and partial duplications of genes are not uncommon, resulting in repetitions that are highly improbable, under the stochastic model (in particular, probes with a no specificity (distance of 0 from the background)). However, as an increasing number of genomes are fully sequenced and annotated, the true background message for these organisms can be evaluated by means of a search algorithm. As mentioned previously, we will use Hamming distance as the proxy parameter defining probe specificity. The specificity search attempts to compute the Hamming distance of all probe-candidates of a given length to the background message (assumed given in some accessible data structure). The results of such a computation will directly entail the identification of good (specific, in Hamming terms) probes. Later in this section we will also address the issue of gene abundance as a factor influencing probe specificity.
13
Figure 2.1: Expected distribution of probe specificities (given in distance from background message of length N=9Mb - the size of the yeast transcriptome), for probes of different lengths l.
Figure 2.2: Distribution of probe specificity according to theoretical computation in comparison to the specificity distribution retrieved by a search over a genomic database (150 ORFs of S. cervisiae)
14
2.2.1
Exhaustive Search
We now state the computational problem in more formal terms. We address the case in which the set of candidate probes is the full set of substrings of g, of a given length. Full Distance Search (Statement of the problem) Input: The target gene g (of length m), a background message D (of length N )2 , a probe length l. � Output: A set of Hamming distances d(gii+l−1 , D) : 1 ≤ i ≤ m − l + 1 . In practice, N ≈ 1 − 100M b and m ≈ 1 − 10Kb. The naive algorithm performs an exhaustive search of all candidate probes against the background message, computing all Hamming distances as above. Running time for the entire search consists of O(mN ) Comparisons.
2.2.2
Indexed Search
Recall, that we want to design specific probes for g. This means that we are not really � interested in computing the set of exact distances d(gii+l−1 , D) : 1 ≤ i ≤ m − l + 1 , but only in classifying the probe candidates to those of small distance (bad probes) and those of large distance (good probes). Formally, the computational problem reduces to: Classification of Probe Candidates (Statement of the problem) Input: The target gene g (of length m), a background message D (of length N ), a probe length l, a quality threshold r. � Output: A partition of the set {1 ≤ i ≤ m − l + 1} into B = i : d(gii+l−1 , D) < r � and G = i : d(gii+l−1 , D) ≥ r This formulation of the problem brings about a simple but useful observation: Observation: If two strings s and t, of length l, have H(s, t) ≤ d, then there must be at least one substring of s, of length ≥ d(l − d)/(d + 1)e, which is a perfect match to the corresponding substring of t. This observation comes from the fact that the worst distribution of d mismatches (i.e. the distribution that produces the shortest maximal perfect match) is the one in which the mismatches are distributed evenly along the string - between intervals of matches that are d(l − d)/(d + 1)e long. Therefore, to classify probes we can perform an indexed search. A version that is applicable here is formally described in IClaS (Indexed Classified Search - Figure 2.3). 2
D may be given as a set of sequences with a total length N , or as a concatenated sequence
15
Let I be an integer lists, with 4ξ entries, addressable as words in N ξ . 1. Pre-Processing for (i=0; i 1 transcripts per cell and low abundance for all other transcripts.
5. Two typical specificity patterns are encountered: either a distribution of probe specificities that is similar to the theoretical distribution (e.g. GAL4) or a distribution of much lower values that arises from similarity between genes (e.g. GAL2). Many transcripts combine domains of both types - some parts of the sequence show low specificity against the background, while others are unique (e.g. GAL1). For these latter transcripts the process of mapping specificity is of extreme importance. Probe specificity mapping for S. cerevisiae was performed using the following criteria: • The abundance weighted threshold values used are indicated in Table 2.3. For comparing a transcript t against a background transcript b a threshold value was selected according to their relative abundances: at and ab , respectively. • Since they are intended for use in gene expression profiling, the map for each transcript was created only for its 500 long 3’-terminus (for transcripts shorter than 500 bases, the entire transcript was considered).
2.3.2
Results
The complete set of specificity maps for the entire S. cerevisiae transcriptome was created and is publicly available (see Appendix A). We present here a brief summary of the results of the mapping, and highlight some specificity issues. Of the 6310 ORFs (theoretical transcripts) that appear in the S. cerevisiae genome databank [10] 71% (4475 ORFs) contain 450 or more valid probes, satisfying the aforementioned criteria. This bulk of the transcripts are those that have no significant specificity problems. The distance distribution for these transcripts is similar to the theoretical distribution of the stochatic model. 24% of the ORFs (1497 ORFs) contain between 1 and 449 valid probes. These contain certain domains that are highly similar to other ORFs. Specificity mapping is important in this case, allowing the discrimination between specific and non-specific probes. 24
The remaining 5% of the ORFs (338 ORFs) are ones for which no satisfactory probe was found. Further investigation of these ORFs revealed different reasons for this result: • A significant portion of the entirely non-specific ORFs are high-abundance transcripts (25% of the non-specific ORFs compared to 5% in the entire ORF population, see Figure 6). The non-specificity originated from gene duplicates that are either completely similar (e.g. TEF1/2 translation elongation factor, CUP11/2 copper-binding metallothionein) or almost completely similar (e.g. HHF1/2, HHT1/2 histone proteins, and many RPL and RPS ribosomal proteins). Although expression differences between such transcripts may be biologically significant (for example, if their regulation differs), the non-specificity of these transcripts is inherent to any hybridization-based assay. • There are several groups of low-medium abundance transcripts that are very similar and therefore difficult to discriminate (e.g. HXT13/15/16/17 high-affinity hexose transporters, PAU1-7 seripauperin family). Functional difference between proteins in these groups is not always clear so the fact that they are indistinguishable may be problematic. Interrogating the expression levels of members of these sets requires further case-specific design. • High homology between an abundant and scarce transcript may cause the latter’s specificity to drop below the required criteria. A large percentage of non-specific ORFs appear in the group of unidentified ORFs, also referred to as hypothetical transcripts (7% non-specific, as opposed to 4% of the identified ORFs). Some of these may be dead genes, i.e. silent remnants of some partial duplication event. The hypothetical transcript YCL068C, for example, is very similar to a region within the abundant RAS guanyl-nucleotide exchange factor BUD5. In these cases non-specificity is may or may not an issue as the expression of the unidentified ORF may not be detected due to this similarity.
25
a)
b)
c)
Figure 2.7: Distribution of probe specificities for the 6310 ORFs of S. cerevisiae: a) The overall distribution of ORF abundances, b) the distribution of ORFs according to the number of their potential probes, c) the distribution of probeless ORFs according to transcript abundance. Notice the large fraction of highly abundant transcripts that have no probes (25%) in relation to their fraction in the ORF population (5%).
26
Chapter 3 Design of Oligonucleotide Sets for Complex Hybridization Reactions 3.1
Introduction
The previous section dealt with the design of a set of oligonucleotide probes intended for use in a hybridization assay such as microarray-based expression profiling. In this type of experiment the oligonucleotide probes may be designed independently as they are separated (e.g. spatially, on the surface of the microarray) and do not interfere with each other. The sequence of the probes is only indirectly related by the requirement that they should be able to distinguish between different transcripts. In hybridization based complex reactions the oligonuleotides themselves are the substrates for the reaction rather than merely acting as probes for a sample. Examples for this type of experimental setting are a multitude of “DNA computing” applications [17, 4] as well as multiplex PCR reactions [48], universal arrays [3] and DNA scaffolding [23, 50]. Oligonucleotides for simple reactions are usually designed based on a set of empirical “rules of thumb” which are implemented manually or by use of an algorithm that exhaustively tests all possibilities [41, 1]. In contrast, design of complex reactions should take into account interdependence between the different oligonucleotides taking part in the reaction. Efficient design of a set of compatible oligonucleotides is therefore one of the factors limiting the complexity of such of experiments, e.g. PCR multiplexing. In this chapter, I describe a theme for the design of oligonucleotides for complex reactions, and demonstrate its implementation in two different experimental setups. The design process is composed of two steps: • Creation of an intereference model between a set of k oligonucleotides (for small 27
k), based on the experimental setup and thermodynamic properties of oligonucleotide interaction. This model is then used to exhaustively calculate whether each set of k oligonucleotides is intercompatible and create the complete interference scenario. • Derivation of an experimental scheme (a set or several sets of compatible oligonucleotides) that complies with the interference model. The implementation of this step includes reduction of the interference scenario into a graph or hyper-graph representation and the application of an appropriate heuristic to the corresponding graph-theoretic problem. In Section 3.2 I describe a DNA computing problem - a molecular implementation of a shift register - and an oligonucleotide design algorithm for the appropriate experimental setting. Section 3.3 will describe a second scheme for solving the more complex problem of multiplex PCR primer design.
3.2 3.2.1
A Molecular Implementation of a Shift Register Background
A p-shift register is a computing machine composed of an array of p characters x1 , x2 , ..., xp and a transfer function f (x1 , x2 , ..., xp ). Given an initial setting of the characters, in each step of the calculation the value of xp+1 = f (x1 , x2 , ..., xp ) is computed and xj is shifted to xj−1 for all j = 2, ..., p + 1. The output of x1 at each step produces a periodic sequence, in which each subsequence of length ≥ p appears only once per period. Alternatively, we may consider the output sequence x1 , x2 , ... as the result of a recursive function xi+1 = f (xi−p+1 , xi−p+2 , ..., xi ) on an initial setting of the values of x1 , x2 , ..., xp . Electronic shift registers are utilized in many applications such as secure communications and pseudo-random sequence generation [15]. As an example, consider a 3-shift register with f (x1 , x2 , x3 ) = x1 ⊕ x3 and an initial setting (seed) x1 , x2 , x3 = 001. Simple inspection teaches that repetitive application of f generates the sequence 001110100111010... . The sequence is periodic with a period 7 and any consecutive string within the period of a length ≥ 3 is different from the rest. In [2] the following molecular implementation of a binary shift register is described: Each of the bits 0 and 1 is represented by a sequence of three nucleotides. The following DNA strands realize the different components of the shift register:
28
1. A seed strand realizes the initial state of the shift register by the corresponding sequence, preceded by an arbitrary start sequence. 2. The transfer function is implemented by a mixture of rule strands, each realizing one entry of the corresponding truth table. The complementing sequences ¯0 and ¯1 are used. For example, the entry f (0, 0, 1) = 1 is realized by a rule strand with the sequence ¯0¯0¯1¯1. 3. A stop strand is used to terminate the process. It is composed of the complement to some part of the periodic sequence, followed by an arbitrary end sequence. The actual implementation described in [2] is of a 3-shift register over a binary alphabet, with seven 6-bit rule strands (5 rule bits and one function bit) realizing the transfer function xn+1 = xn ⊕ xn−2 . Beginning with the a mixture of the seed strand, each of the rule strands, and DNA polymerase, synthesis of a periodic sequence proceeds in the following steps: 1. Annealing step - An appropriate rule strand binds to the seed molecule leaving an overhang with a length of one bit (3 nucleotides). 2. Extension step - The seed is extended by a polymerase by complementation to the bound rule strand. 3. Melting step - The rule strand and the seed strand are dissociated. The synthesis cycle is repeated at a constant temperature (72C◦ ). After some time the stop strand is added to the mixture, to allow terminatation of the reaction at a specific point of the periodic cycle. The entire process is depicted in Figure 3.1, and results in sequences of the form start − (0100111)n − end. The start and end sequences allow amplification, separation and identification of the resulting strands. One aim of the described molecular implementation of a shift register is to produce a large number of uniquely addressable sequences using a parametrically small synthesis effort. A p-shift register over an alphabet of size k corresponds to a path on the corresponding de-Bruijn graph of rank p over the same alphabet [15, 13]. The library of all rules corresponding to a p-shift register over an alphabet of size k comprises of k p+1 rule strands while the number of different maximal length cyclic sequences (of period length k p ) that can be produced by this automaton is [13]: [(k − 1)!]k
p−1
29
kk
p−1 −p
.
(3.1)
Figure 3.1: Schematic representation of the molecular implementation of a shift register: a) seed strand, b) the annealing step, c) the extension step, d) the melting step, e) repetitions of the cycle result in elongation of the seed according to the transfer function, f) addition of the stop strand terminates the process, g) periodic sequences of different lengths may be created
Practically, the implication is that by directly synthesizing the complete library of k p+1 rules we enable synthesis of a much larger set of cyclic sequences, corresponding to all the different simple cycles on the respective de-Bruijn graph, by selecting the appropriate subset of rules that uniquely defines each path. For k = 2, p = 5, for example, the number of different maximal sequences of length 25 = 32 is 22
4 −5
= 211 = 2048. All of these sequences can be realized by synthesizing
the complete set of only 26 = 64 rule strands. A large number of non-maximal cyclic sequences may also be realized by the same set of 64 rule strands. Path counting by simulation of the respective de-Bruijn graph shows that the same set of rules may be combined to yield more than 30,000 different cyclic sequences of varying lengths. There are, however, practical limitations to the extent to which p and k may be enlarged. Emperical experience (e.g. with PCR) teaches that DNA polymerase is less sensitive to hybridization mismatches the further they are from the 5’ end, where the polymerization reaction occurs. Practically, the hybridization reaction is progressively less sensitive to mismatches that are further than 20 bases away from the 5’ end, thereby limiting the length of the rule strands to p ≤ 7 (under a 3 base per character model). Using a larger number of bases per character reduces the practical length of the rule even more. Consequently, the size of the alphabet, k, might be a more suitable candidate for enlargement as inspection of Equation 3.1 reveals that even
30
modest values of k lead to an astronomical number of different maximal sequences (e.g. for k = 3, p = 5 this number is in the order of 1060 ). The identification of an optimal alphabet for the purpose of the molecular shift register is therefore an important challenge.
3.2.2
Problem Definition
Given a molecular implementation of a shift register as described in the previous section, with r being the number of nucleotides per character (r = 3 in the described implementation), we seek to find a alphabet Σ of maximal size k. Theoretically, for r = 3 the richest possible alphabet, composed of all possible trinucleotides, is of size 43 = 64. Practically, this alphabet will suffer from a high error rate due to dimerization and competition between the different characters. For example, strings containing the characters ‘CGC’ and ‘GCG’ are very likely to dimerize and therefore be unavailable for the correct hybridization reaction. in addition, sequences containing these two characters may be very similar and therefore lead to misapplication of the rules (see Section 3.2.3.1 for a discussion of the interference model). The composition of the suggested alphabet should therefore take into account a model of interference between different characters. In physical terms, we seek to widen the energy gap between desired and undesired hybridizations so as to minimize the error rate of the reaction. Formally, given r, the number of nucleotides per character, and a threshold parameter t, we seek a maximum size alphabet Σ ⊆ N r such that for each character σ ∈ Σ, and for any r-long nucleotide subsequence of {Σ∗ ∪ Σ∗ } s.t. ρ 6= σ ¯ the difference of melting temperature between the perfect hybridization (σ, σ ¯ ) and a possible cross-hybridization (σ, ρ) will satisfy tm (σ, σ ¯ ) − tm (σ, ρ) ≥ t. The set {Σ∗ ∪ Σ∗ } denotes all strings over the alphabet Σ and their complements, and represents all oligonucleotides that may be present in the experimental system. Adherence to this criterion will assure that any p long string will have ∆tm ≥ pt between correct and incorrect hybridizations (assuming additivity of tm , which is approximately correct for short sequences). This, in turn, means that rule strands will hybridize only in correct positions and the operation of f (·) will be cleanly implemented.
31
3.2.3
Methods
3.2.3.1
Interference Model
In this section I will suggest a model for calculating the interference, in tm , of groups of character representations by oligonucleotides. For simplicity, I shall describe the model for trinucleotide characters only, since expansion of the model to longer character representations is trivial. Observations The following characteristics of the interference scenario are taken into account: 1. As depicted in Figure 3.2a, interference between rule strands in the given scenario can be of two different types: • Dimerization - interference that is caused by hybridization of the two strands. Accounting for this type of interference involves searching for complementarity between the two strands. • Competition - interference that is caused by cross-hybridization of one strand to the complement of another, taking its place. This type of interference may lead to the application of the wrong rule strand in the annealing step of the shidt register. Accounting for this type of interference involves searching for similarity between the two strands. 2. When considering intereference between characters it is important to take into account all the possible shifts. For example, if ‘AGC’ represents 0 and ‘TGC’ represents 1 full dimerization of the two trinucleotides is impossible (since all three bases mismatch) but the sequence ‘11’, translated into ‘TGCTGC’, contains the exact complement of ‘AGC’ (‘GCT’). Therefore, and due to the linearity of the hybridization, interference is a property that is defined over a set of 3 characters (or their complements) at most (see Figure 3.2 b). Misconsideration of shifts may lead to wrong application of the transfer function f . For example, if ‘AGC’ represents 0 and ‘GCA’ represents 1 then the rule strand denoting f (0, 0, 0) = 0, ‘AGCAGCAGCAGC’, and the rule strand denoting f (1, 1, 1) = 1, ‘GCAGCAGCAGCA’, are almost identical and this alphabet is most certain to lead to erronous results. Explicitly, the given problematic configuration may lead to miscalculation of f (0, 0, 0) = X, where X is a non-defined character ’AGCA’.
32
Figure 3.2: Interference model: a) Two types of interference: i) correct hybridization of the rule strand to the shift register sequence, ii) competition, iii) dimerization. b) Example of possible dimerization interference involving: i,ii) two characters, iii) three characters.
Following these observations, given the trinucleotides a = a1 a2 a3 , b = b1 b2 b3 , c = c1 c2 c3 and their complements a ¯ = a¯3 a¯2 a¯1 , ¯b = b¯3 b¯2 b¯1 , c¯ = c¯3 c¯2 c¯1 , we calculate their interference as follows: 1. We define the crosshybridization potential h(a, (b, c)) of a against (b, c) to be the minimal tm of hybridization between a and bc or bc over all possible shifts (see Figure 3.3), or between a and cb or cb over all possible shifts. Note that h may be defined on a single character or a pair of characters (h(a, (a, a)) and h(a, (a, b)) respectively). In these latter cases we do not take into account the shift that trivially provides a perfect match (i.e. (a, a ¯)). 2. The directed interference potential d(a, (b, c)) is then set to be the ∆tm between a perfect match (a, a ¯) and any mismatch between a and any combination of a, b, c or their complements: d(a, (b, c)) = tm (a) − max(h(a, (a, a)), h(a, (a, b)), h(a, (a, c)), h(a, (b, c))) 3. The undirected interference potential u(a, b, c) is set to be the ∆tm between any perfect match and mismatch in the group (a, b, c): u(a, b, c) = min(d(a, (b, c)), d(b, (a, c)), d(c, (a, b))) 33
a1a2a3 b1b2b3c1c2c3
a1a2a3 b1b2b3c1c2c3
a1a2a3 b1b2b3c1c2c3
a1a2a3 b1b2b3c1c2c3
a1a2a3 c3c2c1b3b2b1
a1a2a3 c3c2c1b3b2b1
a1a2a3 c3c2c1b3b2b1
a1a2a3 c3c2c1b3b2b1
Figure 3.3: Calculation of h(a, (b, c)) over all possible shifts between a and bc or bc
4. The group of characters (a, b, c) is said to interfere iff u(a, b, c) < t. Alternatively, the same group is said to be compatible iff u(a, b, c) ≥ t.
3.2.3.2
Interference Graph
The most natural representation of the interference model described in the previous section is a graph. As interference is a property defined on three characters, we define an interference hypergraph H = (V, E), of rank 3: • V = {σ : σ ∈ N r } • E = {(σ1 , σ2 , σ3 ) : u(σ1 , σ2 , σ3 ) < t} In parallel, we may define the complementary compatibility hypergraph H = (V, E). Computational Efficiency Calculating u(a, b, c) for given a, b, c requires O(r) comparisons. Construction of the complete inteference/compatibility graph is then O(rn3 ), where n = 4r , or O(r64r ). This is practical for small r, and compatible with the experimental requirements of r = 3 − 5. 3.2.3.3
Finding Maximum Size Alphabets
Utilizing the hypergraph representation, finding a maximum size compatible alphabet reduces to the problem of finding a maximum clique in the compatibility hypergraph (or alternatively, a maximum independent set in the interference hypergraph). A clique in a hypergraph H = (V, E) of uniform rank r is a subset of vertices C ⊆ V such that the hypergraph it induces on H is complete, with respect to the r-hyperedges. In other words, all r-subsets of C are in E. The problem of finding a maximum clique in a graph is a well-studied problem in graph theory [7], belonging to the class of NP-complete problems [14]. Finding a maximum clique in a hypergraph of uniform rank 3 is at least as hard since the problem of finding a maximum clique in a 34
graph G may be simply translated to the problem of finding a maximum clique on the respective hypergraph H, where a 3-hyperedge exists iff the 3 corresponding edges in the original graph exist. According to this translation, any subset C ⊆ V is a clique in G iff it is a clique in H, with the exception of trivial cliques of size |C| = 2. Following are several possible algorithmic approaches for finding a maximum clique in a hypergraph: Naive The naive “brute force” algorithm consists of exhaustive consideration of all O(2n ) possible subgraphs. This algorithm is practical for small graphs only. Enumeration Different approaches for efficient enumeration of all cliques in a graph are described in [7]. The advantage of enumerating all cliques over finding one maximum clique is that the set of all cliques can then be searched to find an alphabet that is optimal by different criteria, such as uniform character tm (see Section 3.2.4) The following algorithm is used for enumerating all cliques. It is a BFS search of the clique tree, based on the fact that all sub-graphs of a clique are also cliques. It assumes an arbitrary ordering of V . 1. C - current list of cliques. Initialize C ← E. 2. Q - final list of cliques. Initialize Q ← φ. 3. For each clique c ∈ C, c = {vi1 , vi2 , . . . , vik }, where i1 < i2 < ... < ik . (a) For each vertex vl s.t. l > ik : i. Let c0 = {vi1 , vi2 , . . . , vik , vl } ii. If c0 is a clique, C = C ∪ {c0 } (b) C = C − {c}, Q = Q ∪ {c} Efficiency Due to the ordering of V , each clique in the hypergraph is considered exactly once. Checking if c0 is a clique in step 3(a)ii can be done in O(n2 ) since the subgraph c is known to be a clique and the hypergraph is of rank 3. Total running time is O(qn3 ), where q is the total number of cliques in the graph. q may be exponential in n, but the algorithm is practical for sparse graphs. Branch and Bound A DFS search of the clique tree may be limited by aborting a branch whenever the size of the current clique |c| in addition to the size of its neigborhood |N (c)| is smaller than the largest clique found so far, or calculating some other 35
upper bound for the maximum clique in this subgraph (e.g., the coloring number, see Section 3.3.3.3) [12]. This algorithm is faster than enumeration but may still have exponential running time. Heuristic Heuristic algorithms for finding the maximum clique in a graph are described in [7]. Here we implement a simple heuristic-based genetic algorithm (HGA) [32]. This algorithm includes a division of the labor - the search for a large subgraph and the search for a clique - between a genetic algorithm and a naive greedy heuristic procedure respectively, and was shown to perform well on DIMACS benchmark graphs [32]. A more detailed review of genetic algorithms appears in Appendix B. Simple genetic algorithms were shown to do poorly in the maximum clique problem [8], since the space of subgraphs is usually much larger than the space of cliques. The HGA avoids this problem by incorporating a simple greedy heuristic for finding a clique which is “close” to a given subgraph. The genetic algorithm can then concentrate on finding the best solution within the much smaller clique space. Following is a schematic description of the algorithm: 1. Create an initial population of n individuals - random subgraphs. 2. For each individual - find a proximate clique. 3. Repeat until convergence: (a) Select k “good” individuals from the population. (b) Recombine and mutate the selected individuals to produce k new individuals. (c) For each new individual - find a proximate clique. (d) Replace k “bad” individuals from the population with the new individuals. Steps 2 and 3c consist of locating a clique that is proximate to a given subgraph. Figure 3.4 shows our modification of this procedure, described in [32], for a hypergraph.
3.2.4
Application
3.2.4.1
Selecting a Maximum Alphabet
Maximum alphabets were selected for the following cases:
36
Input: An induced subgraph of a hypergraph of rank 3, a parameter l. Output: A proximate clique in the same graph. 1. Relax: (Enlarge the subgraph) Add l randomly chosen vertices to the subgraph. 2. Repair: (Extract a clique) Scan all pairs of vertices (i, j) of the subgraph in a random order. For each pair: (a) either delete i or j from the subgraph, or (b) scan each vertex k ∈ / {i, j}. If k is in the subgraph and (i, j, k) is not an edge, remove k from the subgraph; 3. Extend: (Enlarge the clique) Scan all vertices of the hypergraph in a random order. For each vertex k, if it is connceted to all vertices of the subgraph (obtained so far), add it to the subgraph. Figure 3.4: Algorithm for finding a clique close to a given subgraph of a hypergraph. 3-long nucleotide representation, using 3 nucleotides only (r = 3, |N | = 3) This is the instance that was used in practice [2], since omission of the 4th nucleotide during the extension step reduces unnecessary products. • Input: r = 3, t = 2, N = {A, C, G} • Algorithm: Enumeration • Results: – Compatibility hypergraph: |V | = 27, |E| = 618, edge density=0.21 – Maximum alphabet: |Σ| = 7 (4 different alphabets, see Table 3.1) A specific alphabet of size 4 was employed in the actual implementation (see Section 3.2.4.2). 3-long nucleotide representation, using all 4 nucleotides (r = 3, |N | = 4) • Input: r = 3, t = 2, N = {A, C, G, T } • Algorithm: Enumeration • Results: – Compatibility hypergraph: |V | = 64, |E| = 9748, edge density=0.23 – Maximum alphabet: |Σ| = 10 (40 different alphabets, see Table 3.2, and Figure 3.5) 37
Set # 1 2 3 4
Characters ACA ACC ACG AGA AGC GGA GGC ACA ACC AGA CGA GCA GCC GGA ACA ACG AGA AGC AGG CCA CCG ACA AGA AGG CCA CGA CGG GCA
Table 3.1: Maximum alphabets for r = 3, t = 2, N = {A, C, G}
Set # 10 20 30 40
Characters ACA ACC AGA AGC ATA ATC GGA GGC GTA GTC AGA AGC ATA ATC CAA CAC CGA CGC CTA CTC CAG CAT CCT CGG CGT TAG TAT TCT TGG TGT GAG GAT GCG GCT TAG TAT TCG TCT TGG TGT
Table 3.2: Sample of maximum alphabets for r = 3, t = 2, N = {A, C, G, T }
4-long nucleotide representation, using all 4 nucleotides (r = 4, |N | = 3) When considering 4-long nucleotide representations, the value of the threshold parameter t has a considerable effect on the density of the interference graph and hence on the size of the maximum alphabet. Two values (t = 2, 4) were tested: 1.
• Input: r = 4, t = 4, N = {A, C, G, T } • Algorithm: Enumeration • Results: – Compatibility hypergraph: |V | = 256, |E| = 857, edge density=0.0003 – Maximum alphabet: |Σ| = 5 (272 different alphabets, see Table 3.3)
2.
• Input: r = 4, t = 2, N = {A, C, G, T } • Algorithm: Heuristic-based genetic algorithm, with a population of size 50. • Results: – Compatibility hypergraph: |V | = 64, |E| = 1154064, density=0.42 – Maximal alphabet found (not guaranteed maximum): |Σ| = 27 (see Table 3.3) Average size of maximal clique found over 100 runs of the GA was 26.4.
3.2.4.2
Physical Implementation
Although large alphabets were found to be theoretically feasible, for the experimental proof of concept we attempted a modest extension of the alphabet from a binary one 38
Set # 1 2 3 4 5
6
7
8
t 4 4 4 4 2
Characters CAAC CAAG CCCG CTTC GAAC CAAG GAAC GATG GCGG GTAG CATC CCCG CTAC CTTG GTTC CGCC CTTC CTTG GTTC GTTG AGCA AGCC AGGT AGTC AGTT ATAG ATCA ATCC ATTC ATTT CGAG CGCA CGCC CGGT CGTC CGTT CTCA CTCC CTTC CTTT GACA GGCA GGGT TAAG TACA TGGT TGTT 2 AAAC AAAG AGAC AGTA AGTC AGTG AGTT ATAC ATAG ATCC ATTC ATTG ATTT CAAC CAAG CACC CAGC CCGC CCTA CCTC CCTG CCTT CGAC CGAG CGTC CGTG CGTT 2 GACA GACC GACG GACT GAGC GAGT GGCG GGCT GGGA GGGT TAAA TACA TACC TACT TAGA TAGT TGAA TGAT TGCC TGCG TGCT TGGA TGGT TTCC TTCG TTCT TTGT 2 CAAT CACT CGAA CGAC CGCC CGCT CGTG CTAA CTAC CTAT CTCC CTGA CTGC CTTG GGAA GGAC GGAT GGCT GGTG GTAA GTAT GTCT GTTG TCAT TTAT TTCT TTTG
Table 3.3: Sample of maximum alphabets for r = 4, t = 2, 4, N = {A, C, G, T }
to an alphabet of 4 different trinucleotides. The theoretical construction yielded 33808 such groups (see Figure 3.5). Two additional experimental considerations were taken into account when choosing one of these groups: • Characters using 3 of the 4 nucleotides were preferred (e.g. N = {A, C, G}), since this enables reducing the unwanted products during the extension phase by omitting the unnecessary nucleotide from the reaction ingredients. • Character sets with a uniform tm ≈ 10◦ C per character were preferred. The alphabet Σ = {T GG, GT C, GCT, CCT } ≡ {0, 1, 2, 3} was chosen as meeting ¯ 1, ¯ ¯2, ¯3} are the compleboth these criteria, where {CCA, GAC, AGC, AGG} ≡ {0, ments. Table 3.4 denotes the sequences implementing a shift register that performs a calculation of the function xn+1 = [(xn + xn−2 ) mod 4] on the seed 03110, whose output is the following cyclic sequence: start − 03110 − (12231323203110)n − 1223132320 − end
(3.2)
Results After filtering out short sequences, the products of the elongation reaction were run on a polyacrylamide gel next to a standard ruler. Results, depicted in Figure 3.6, allow identification of products curresponding to the sequence 3.2 with n = 0, ..., 4. Sequencing of the first two bands (n = 0, 1) assured that correct products were obtained. 39
60000 50000
# of sets
40000 30000 20000 10000 0 3
4
5
6
7
8
9
10
Set size
Figure 3.5: Number of different compatible characters sets found, as a function of the set size, for r = 3, t = 2, N = {A, C, G, T }
Figure 3.6: Product of implementation of molecular shift-register over an alphabet of 4 characters: Σ = {T GG, GT C, GCT, CCT }. Lane (a) contains a standard ruler, lane (b) - reaction products, in which 5 distict bands may be identified, corresponding to the sequence 3.2 with n = 0, ..., 4. Sequence lengths are in base pairs.
40
Function Seed Stop Rule1 Rule2 Rule3 Rule4 Rule5 Rule6 Rule7 Rule8 Rule9 Rule10 Rule11 Rule12 Rule13 Rule14
Sequence start - TGG CCT GTC GTC TGG end - CCA AGC AGG AGC AGG GAC GAC CCA GAC GAC AGG CCA AGC GAC CCA GAC GAC AGG AGC AGC GAC CCA GAC GAC AGG AGC AGC GAC CCA GAC GAC AGG AGC AGC GAC CCA AGG GAC AGG AGC AGC GAC AGC AGG GAC AGG AGC AGC AGG AGC AGG GAC AGG AGC AGC AGG AGC AGG GAC AGG CCA AGC AGG AGC AGG GAC AGG CCA AGC AGG AGC AGG GAC AGG CCA AGC AGG AGC GAC GAC AGG CCA AGC AGG CCA GAC GAC AGG CCA AGC
Function start − 0, 3, 1, 1, 0 1, 3, 2, 3, 2, 0 − end f (0, 3, 1, 1, 0) = 1 f (3, 1, 1, 0, 1) = 2 f (1, 1, 0, 1, 2) = 2 f (1, 0, 1, 2, 2) = 3 f (0, 1, 2, 2, 3) = 1 f (1, 2, 2, 3, 1) = 3 f (2, 2, 3, 1, 3) = 2 f (2, 3, 1, 3, 2) = 3 f (3, 1, 3, 2, 3) = 2 f (1, 3, 2, 3, 2) = 0 f (3, 2, 3, 2, 0) = 3 f (2, 3, 2, 0, 3) = 1 f (3, 2, 0, 3, 1) = 1 f (2, 0, 3, 1, 1) = 0
Table 3.4: Sequences designed for molecular Shift-Register implementation
3.3
Multiplex PCR Primer Design
3.3.1
Background
The Polymerase Chain Reaction (PCR), conceived by Kary Mullis in 1983 [38], is a technique for the in vitro amplification of specific DNA sequences by the simultaneous primer extension of complementary strands of DNA. A vast number of applications of DNA analysis, from sequencing, genetic analysis and mutagenesis to forensics, rely on PCR to create an adequate amount of homogenous DNA before the analysis procedure [33]. PCR amplification consists of extension of oligonucleotide primers by a DNA polymerase enzyme according to an initial template, which is repeated many times. The PCR “ingredients” consist of a thermostable DNA polymerase enzyme (typically isolated from the bacteria Thermophilus aquaticus, which occurs in hot springs), a high concentration of oligonucleotide primers that are complementary to sequences flanking the specific region of DNA being amplified (the amplicon), and free nucleotides used by the polymerase to create the new DNA copies. These ingredients are added to a sample of initial template DNA, and amplification occurs by iterating a thermal cycle (see Figure 3.7): 1. Melting (denaturing) step - Hybridization of the complementary DNA strands is disrupted by heating of the mixture to 95◦ C. 41
Figure 3.7: PCR thermal cycle: a) first cycle, b) typical nth cycle
2. Annealing step - Temperature is lowered to ∼ 55◦ C to allow binding primers to the single stranded DNA template. 3. Extension step - The primers are readily extended by a polymerase by complementation to the template strands at ∼ 72◦ C. Ideally, in each cycle the number of copies of the DNA strand is doubled resulting in an amplification factor which is exponential in the number of cycles (see Figure 3.8). 3.3.1.1
PCR Primer Design
The success of a PCR reaction heavily depends on correct choice of oligonucleotide primers. In order for the amplification to occur the pair of primers used in the reaction must, obviously, flank the sequence of interest on the initial DNA template (or be contained in it, if the application is aimed at detecting or quantifying the intial template), but many other factors determine the efficiency of the amplification reaction. These parameters include the melting temperature (tm ) of each of the primers (which should be similar) and of the amplicon (which should be significantly higher), the length of the primers (usually 15-30b) and of the amplicon (typically 50-10000b), the GC content of the sequence (40-60%) and specific sequences which enhance the initialization of the polymerization reaction [33]. Primers should not contain self-complementarities or complement each other, and should not flank any non-specific sequence in the experimental background. An occuring mishap in PCR reactions is the formation of a primer-dimer where the two primers complement at both their 3’ ends giving rise to a very short and competitive unwanted product that may well obscure the required amplification product. 42
Figure 3.8: PCR exponential emplification. 30 cycles of PCR yield an amplification factor of > 109
Due to the popularity of the PCR method, the problem of optimal PCR primer design has received a significant amount of attention. Current primer design applications [30, 25, 1] typically conduct an exhaustive search over all possible primer pairs and rank them according to a set of parameters such as the ones mentioned above. The set of highest scoring primer pairs are then offered to the user, who decides on a specific pair to be synthesized. The threshold parameters of the search are tweaked so as to limit the number of primer candidates and as a consequence - the running time of the exhaustive search. 3.3.1.2
Multiplex PCR Primer Design
It is often desirable to perform several PCR reactions together, or in a multiplexed manner. Specifically, genotyping requires a large number of SNP1 -containing fragments of a specific genome to be amplified as an initial step before SNP identification. As the number of SNPs being analyzed in a single experiment may be in the range of hundreds or more, the need to reduce the cost of labor and reagents underlines the advantage of 1
Single Nucleotide Polymorphism - single base pair positions in genomic DNA at which different sequence alternatives (alleles) exist in normal individuals. Association studies of polymorphic markers, such as SNPs, is expected to be an efficient way of identifying genetic regions or genes implicated in common complex diseases and traits.
43
co-amplifying several different amplicons in single reaction tube [48]. Multiplex PCR is a reaction in which several target sequences are co-amplified, each with its own different primer pair, so that significant amplification of all targets is achieved simultaneously. In addition to the usual criteria for PCR primer design, the design of primers for a multiplex reaction must take into account the following limitations: • All amplicons must be competitive, i.e. the polymerization reaction should not signicantly favor one amplicon over another (e.g. if one is significantly shorter). • All primers must not interfere with each other. In particular, each pair of primers (not necessarily pertaining to the same original amplicon) should not complement or give rise to primer-dimers. • All primers should not give rise to unspecific products. In particular, each pair of primers (again, not necessarily pertaining to the same original amplicon) should not flank any short non-specific sequence in the experimental background. Current and future high-throughput applications, such as SNP genotyping, require the co-amplification of more than a hundred different target sequences. Performing a multiplex PCR reaction of this magnitude is unfeasible for technical reasons as, even if all design requirements were met, the fractional concentration of each single primer would be too low to allow the desired amplification. Instead, we seek to design a multiplexing scheme - a partition of the set of target sequences into a small number of multiplex reactions, such that each reaction in itself is feasible. Computational design of a complete PCR multiplexing scheme has not been attempted previously. Current applications are limited to simultaneous design of a few compatible primer pairs at a time using an exhaustove search [1]. Other applications allow testing the compatibility of given (pre-designed) primers [25]. The only current practical methodology involves an experimental protocol for greedy selection of sets of primers that are emprically proven to be compatible.
3.3.2
Problem Definition
As described in the previous section, PCR primer compatibility is a pair property. A multiplex PCR reaction will be successful if all each pair of primers in the reaction (not necessarily pertaining to the same original amplicon) is compatible. The compatibility of two primers is assessed with respect to each other (dimerization potential) and to the background (mispriming potential). Given two primers p, q and a background 44
sequence D, a boolean primer compatibility function cD (p, q) determines whether the primers may be used in the same PCR reaction. Similarily, given two primer pairs pp = (p1 , p2 ), qq = (q1 , q2 ) and a background sequence D, a boolean primer pair compatibility function cD (pp, qq) determines whether the primer pairs may be used in the same PCR reaction. We use c(·) as a shorthand for cD (·) where D is obvious from the context. Definition of these functions will be discussed in Section 3.3.3.1. 3.3.2.1
PCR Multiplexing Scheme with Preset Primers
Given S, a set of target sequences with pp(s) being the pair of preselected primers for S S each s ∈ S; D, a background sequence; and cD : ( s∈S pp(s)) × ( s∈S pp(s)) → {0, 1}, a boolean primer pair compatibility function, we seek a partition φ : S → R such that: • If φ(sk ) = φ(sl ) then c(pp(sk ), pp(sl )) is satisfied. • The number of PCR reactions, |R|, is minimal. 3.3.2.2
PCR Multiplexing Scheme with Variable Primers
Given S, a set of target sequences with P P (s) = (pp1 (s), pp2 (s), ...ppms (s)) being the set of possible primer pairs for each s ∈ S; D, a background sequence; and cD : S S ( s∈S P P (s)) × ( s∈S P P (s)) → {0, 1}, a boolean primer pair compatibility function, we seek: • A set of representatives {pp(s) ∈ P P (s)}s∈S , • A partition φ : S → R. such that: • If φ(sk ) = φ(sl ) then c(pp(sk ), pp(sl )) is satisfied. • The number of PCR reactions, |R|, is minimal.
3.3.3
Methods
3.3.3.1
Primer Compatibility
Given two primers p, q and a background sequence D, a boolean primer compatibility function cD (p, q) determines whether the primers may be used in the same PCR reaction. Interference between p and q may be caused by two different mechanisms (see Figure 3.9):
45
Figure 3.9: Possible interference between PCR primers: a) Correct priming, b) Primer dimerization at i) both 3’ ends, ii) one 3’ end or iii) no 3’ ends, c) Mispriming of a non-specific sequence. • Dimerization potential - How likely are the two primers to dimerize (hybridize). • Mispriming potential - How likely are the two primers to amplify a non-specific target from the background.
Estimating Dimerization Potential Dimerization of two primers can be of different types, some more problematic than others (Figure 3.9, i-iii): • Dimerization at the 3’ end of both primers. This construct will be exponentially amplified by the PCR reaction and due to its short length it will be highly competitive with the required target for all the reaction ingredients. • Dimerization at the 3’ end of one primer. This construct may be linearly amplified by the PCR reaction, and will consume primers. • Dimerization not at the 3’ of either primer. This construct will not be amplified but will compete with correct primer hybridization. Given two primers, p = hp1 ...pm i and q = hq1 ...qn i, and threshold parameters τ1 ≤ τ2 ≤ τ3 we estimate the dimerization potential by iterating over all pairs of subsequences p0 = hpi−k+1 ...pi i and q 0 = hqj−k+1 ...qj i of the same length k. We determine three values: • t1 - The longest perfect match of p0 , q 0 where both i = m and j = n. This is a perfect match that spans the 3’ end of both primers, and is most problematic. • t2 - The longest perfect match of p0 , q 0 where either i = m or j = n. This is a perfect match that spans the 3’ end of one of the primers. • t3 - The longest perfect match of p0 , q 0 overall. p and q are deemed incompatible if t1 > τ1 or t2 > τ2 or t3 > τ3 . 46
Efficiency Running time of the exhaustive calculation of t1 , t2 , t3 for r primers of maximal length l is O(lr2 ). Estimating Mispriming Potential The mispriming potential of two primers is problematic to the PCR reaction if these two primers flank a non-specific background sequence that is significantly short. Mispriming may occur even when the primers do not perfectly match the non-specific sequence. Given two primers, p = hp1 ...pm i, q = hq1 ...qn i, a background sequence B, and threshold parameters α, β, λ, we estimate the mispriming potential by searching B for possible mispriming positions. Let p0 be the λ-long 3’ suffix of p, and q 0 be the λ-long 3’ suffix of q. A mispriming position is a subsequence b ⊂ B that contains both bp - identical to p0 with α mismatches at most and bq - the complement to q 0 with α mismatches at most, or both bp - identical to q 0 with α mismatches at most and bq - the complement to p0 with α mismatches at most. Of all possible mispriming positions we seek b∗ , the one of minimum length. p and q are deemed incompatible if |b∗ | < β. Implementation and Efficiency Running time of the exhaustive calculation of |b∗ | for r primers is O(|B|r) which is impractical for genomic background sequences. As was described in Section 2.2 we may use an indexed search to speed up this calculation. Implementation of this procedure is in the following steps: 1. Preprocessing Generate an index of all words of length λ. In each entry of this index keep a list of all occurences of the corresponding word in B. 2. Scan (a) For each primer p, use the index to prepare an ordered list of the positions of all occurences of its λ-long 3’ suffix, with α mismatches at most. (b) For each pair of primers, p and q, use the lists lp and lq to calculate the minimum distance |b∗ |. Note that this procedure is performed twice to account for the two different configuration that p and q may assume, i.e. p and q¯ or p¯ and q. The running time of the indexed search is significantly smaller: O(|B|) preprocessing time for preparing the index, and O( |B|r ) search time for calculating |b∗ |. Practically, 4λ 47
the size of the index, O(λα r), is also a factor and an optimal ξ < λ can be found for efficiently searching the ξ-suffixes only. Primer Compatibility Function Estimation of dimerization potential and mispriming potentials were described above. Primer compatibility may also be effected by an additional factor: uniformity of the primers’ tm . The primers p and q are deemed incompatible if |tm (p) − tm (q)| is larger than a given threshold parameter γ. In conclusion, given threshold parameters τ1 ≤ τ2 ≤ τ3 , α, β, λ, γ, the primer compatibility function c(p, q) is defined as: c(p, q) = (t1 < τ1 ) ∧ (t2 < τ2 ) ∧ (t3 < τ3 ) ∧ (|b∗ | < β) ∧ (|tm (p) − tm (q)| < γ).
(3.3)
Similarily, given two primer pairs pp = (p1 , p2 ), qq = (q1 , q2 ) and a background sequence D, a boolean primer pair compatibility function c(pp, qq) determines whether the primer pairs may be used in the same PCR reaction by conjunction: c(pp, qq) = (c(p1 , q1 ) ∧ c(p1 , q2 ) ∧ c(p2 , q1 ) ∧ c(p2 , q2 )) .
(3.4)
Additional experimental factors may be taken into account by determinining the respective thresholds: • Uniformity of the amplicons’ tm and GC-content. • Difference in the amplicons’ lengths that will allow distinction between them on a gel. 3.3.3.2
Interference Graph
The most natural representation of the interference model described in the previous section is a graph. In the case of PCR multiplexing, the property of interference is defined over a pair of primer pairs. For the preset primer problem we define the interference graph Gpre = (Vpre , Epre ): • Vpre =
S
s∈S {pp(s)}
• Epre = {(pp, qq) : pp, qq ∈ Vpre , c(pp, qq) = 1} For the variable primer problem we define Gvar = (Vvar , Evar ) similarily: • Vvar =
S
s∈S
P P (s)
• Evar = {(pp, qq) : pp, qq ∈ Vvar , c(pp, qq) = 1} 48
3.3.3.3
Finding a PCR Multiplexing Scheme
Representation of the primer interference in a graph reduces the problem of designing a PCR multiplexing scheme to graph coloring, which is a well-studied topic in graph theory [22]. The problem of finding a PCR multiplexing scheme with preset primers reduces to the basic graph coloring problem, since a coloring φ : Vpre → C of minimum cardinality directly yields a partition φ : S → T of minimum cardinality. The problem of finding a PCR multiplexing scheme with variable primers is more complex, since in addition to the problem of coloring we first need to select a subgraph of Gvar , containing exactly one pp(s) for each s ∈ S, that will give us the best coloring result (i.e. lowest chromatic number). SLO Coloring Optimal graph coloring is known to be intractable [22, 14]. Since it is more general, the optimal subset coloring problem is at least as hard. Sequential coloring according to the smallest last order (SLO) is known to be useful in many cases of graph coloring [22, 40]. The coloring number of a graph col(G) is defined as col(G) = 1 + max δ(G0 ), 0 G ⊆G
where δ(G) denotes the minimum degree in a graph, and G0 ⊆ G denotes that G0 is an induced subgraph of G. col(G) gives an upper bound on the chromatic number χ(G) which is, in many cases, fairly close to χ(G) [22, 40]. Computation of col(G) can be done in polynomial time using an algorithm for SLO coloring [40], which yields an efficient heuristic approach for graph coloring. The algorithm for SLO coloring also provides a specific coloring with at most col(G) colors (see Figure 3.10). Subset Coloring Algorithm The problem of finding a PCR multiplexing scheme with variable primers is analogous to the problem of representative subset coloring of the interference graph: Given the interference graph Gvar , find a representative subgraph of Gvar with a minimal chromatic number, and a minimal coloring thereof. Definition A representative subgraph of the interference graph G, is a subgraph G0 ⊆ G that contains exactly one pp(s) for each s ∈ S. SLO-based GA (SLO-GA) is a heuristic algorithm for finding a proper subset coloring. This algorithm contains two parts: 49
Input: A graph G = (V, E). Output: An coloring of G, with cardinality≤ col(G). 1. L = φ (A list of vertices). 2. While G is not empty: (a) Compute d(v) for all v ∈ V . (b) Let u be the vertex with minimal d(v). (c) Add u to the end of L. Remove u from G. 3. While L is not empty: (a) Let u be the last vertex in L. (b) If possible color u with an existing color, otherwise color u with a new color. (c) Remove u from L. Figure 3.10: Algorithm for SLO Coloring [40]. • A genetic algorithm for selecting representative subgraphs of Gvar . A solution is a vector A = (a1 , ..., a|S| ), where for each si ∈ S the coordinate ai denotes a primer pair selection pp(si ) = ppai ∈ P P (s). The mutation operation changes the value of a random coordinate, and the recombination operation creates a new solution by randomly combining the coordinates of two given solutions. • A fitness function based on SLO. This function gives each representative subgraph selected by the GA a score equal to the coloring number of the subgraph using SLO. Each evaluation of this fitness function takes O(|S|2 ) time. The algorithm seeks a proper subgraph of Gvar with a minimal SLO coloring number. The vector A of the best solution found, together with its SLO coloring give the subS group P P 0 ⊆ s∈S P P (s) and the partition φ : S → R, respectively. Note that the above method involves a heuristic method both to the search procedure and the fitness function.
3.3.4
Preliminary Results
Preliminary results of the multiplex PCR primer design problem were obtained on biological sequences that were then tested in the laboratory, as well as on synthetic simulation data.
50
3.3.4.1
Biological Data
Settings A set of 68 target sequences from human genes, each with a predefined primer pair, was obtained from Uppsala University Hospital2 . The primers’ lengths are in the range of 18-25 bases. Using SLO coloring, we devised multiplexing schemes for the reactions under a range of parameters: • Dimerization potential: – τ1 = 0−2. Variation of this parameter had little effect since the primers were predesigned with a 3’ end of A/C only (intended to minimize dimerization). – τ2 = 3 − 4. Variation of this parameter had the most dramatic effect on the density of the interference graph (see results). – τ3 = 7 − 8. Variation of this parameter had little effect. • Mispriming potential (tested against the entire human genome): – λ = 13, α = 0 or λ = 14 − 15, α = 1 – β = 1000 Results The range of parameters tested for dimerization potential was chosen as the one being relevant to the PCR interference kinetics (i.e. a short match at both 3’ ends is more problematic than a longer match at no 3’ end). When calculating the complete interference graph for the set of 136 primers we observed that the model is most sensitive to the parameter τ2 . Figure 3.11 shows that dimerization at the 3’ end of one of the primers is likely to contain a perfect match of between 1 to 5 bases long. Therefore, the difference between a threshold of τ2 = 3 and τ2 = 4 is translated to a difference of acceptence of 20% of the pairs (or the same fraction of edges in the graph). In contrast the range of relevent τ1 and τ3 are too high to be significant (note that in the case of τ1 this is a result of the predesign of primers with a 3’ end of A/C). Results of testing for mispriming potential are displayed in Table 3.5. The parameters λ = 14, α = 1 seem to be unreasonable for the application since almost a third of all pairs of primers have mispriming potential under these conditions, which does not agree with experimental experience. The optimized full multiplexing scheme was designed to include a minimal number of reactions, with a relatively uniform number of amplified targets per reaction. This 2
I thank Ulrika Liljedahl and Prof. Ann-Christine Syv¨anen of the group of Molecular Medicine for their cooperation.
51
λ α 13 0 14 1 15 1
Fraction of mispriming pairs 0.013 0.321 0.055
Table 3.5: Results of mispriming potential, given in fraction of pairs of primers that flank a significant background sequence, with respect to the given parameters was done by selecting the least occupied color in each coloring step of the SLO algorithm. A different implementation of the algorithm may be used, that chooses the first possible color in each coloring step and results in a non-uniform distribution of targets per reaction but a similar number of reactions. Table 3.6 summarizes the resulting multiplexing schemes. Of these results, one reaction containing 13 targets was tested in the laboratory. Amplification products were tested by running them on a gel (each product should result in a band on the gel in a position relative to its length) and by running the relevent genotyping assay on a miniarray3 . Results for the 13 targets are summarized in Table 3.7: • 11 of the 13 targets appeared on the gel. 3 products were inconclusive due to similar length, yet 2 of the 3 appeared positively in the genotyping test. One of the missing products (M24686) may be due to it being significantly longer than the other resulting in poor amplification. • Results in the genotyping tests are poorer, displaying a success rate of 7/10 (2 of which are ambiguous). • Significant dimerization was noted in the reaction. As a conclusion, it seems that most targets did indeed co-amplify in the reaction. However, significant dimerization did occur, probably reducing the amount of product available for genotyping. These results appear promising but more work needs to be put in the interference model by using some more stringent dimerization potential parameters or modifying the dimerization potential model. 3.3.4.2
Synthetic Data
Settings Synthetic data was created for both predefined and variable primer multiplexing schemes. Data was randomly generated, in the following steps: 3
Again, I thank Ulrika Liljedahl and Prof. Ann-Christine Syv¨anen of the group of Molecular Medicine at Uppsala University Hospital for their kind assistance.
52
Figure 3.11: Results of dimerization incompatibility. Chart denotes the fraction of all pairs of primers that share a perfect match of the given length. t1 - at both 3’ ends, t2 - at one 3’ end, t3 - with no 3’ end requirements. Inexistance of dimers with t1 > 0 is due to primers being predesigned with a 3 end of A/C only (intended to minimize this type of dimerization).
τ1 0 0 0
τ2 3 4 4
τ3 7 7 7
λ α 13 0 13 0 15 1
β 1000 1000 1000
Scheme 11 reactions of 6-7 targets each 7 reactions of 9-10 targets each 5 reactions of 13-14 targets each
Table 3.6: Summary of multiplexing schemes designed for the biological data
53
Sequence Length AF118569 76 AF169006 128 M26900 133 D26607 146 AC004466 148 M26900 151 J02960 172 M10065 182 AF050163 190 U20860 219 J03895 247 AF217403 277 M24686 419
Gel Genotyping + + + (2) + + +(1) + +(1) (4) +(1) + + (4) + (2) +(3) + + + (4) + (2) +(3)
Table 3.7: Results of co-amplification of 13 targets in a single reaction, in accordance to the prediction of the Multiplex PCR primer design algorithm. (1) Inconclusive result due to the similar sizes of the fargments (2) Unclear genotype (3) Ambiguous result due to multiple SNPs in fragment (4) No result to to absence of detection primer. 1. s random sequences of length l were drawn uniformly and independently from N l. 2. For each sequence, a set of p primer pairs of length k was selected randomly, each pair flanking the exact middle of the sequence. For all datasets the following parameter values were used for calculating dimerization potential: τ1 = 2, τ2 = 3 − 4, τ3 = 7, l = 100, k = 22. Synthetic interference graphs were created for the following cases: • Case a: s=70, τ2 = 4 - Similar to the biological tested case. • Case b: s=70, τ2 = 3 - Similar to the biological tested case, with a more stringent value for τ2 . • Case c: s=150, τ2 = 4 - A larger number of targets. Results Preset Primers For all three cases, we created a multiplexing scheme for 100 different random intereference graphs with preset primers (p = 1). The results, in coloring number (or total number of reactions), are depicted in Figure 3.12-1. In each case we compared the resulting distibution to the distribution of SLO coloring of 1000 different random graphs (Gn,p )with the same edge densities: 54
• Case a: Average coloring number: 8.04 (8-9 reactions per tube). • Case b: Average coloring number: 15.47 (4-5 reactions per tube). • Case c: Average coloring number: 14.1 (10-11 reactions per tube). Interestingly, the coloring number of the number of reactions in the multiplexing scheme for the biological data was significantly lower than for synthetic data with the same statistical properties (5 reactions vs 8 ). Another interesting observation is that in all three cases the distribution of coloring numbers for the intereference graphs is slightly lower than the distribution of coloring numbers for the random graphs (This is most significant in case b: 0.27 difference in the average coloring number). Although the significance of these findings may be argued, they may imply some hidden structure in the intereference graphs, and in the interference graph of biological data in particular. Variable Primers We tested the algorithm for multiplex PCR primer selection with variable primers for the same three cases, with p = 5 (5 different optional primer pairs per target). The results, in coloring number (or total number of reactions), are depicted in Figure 3.12-2 (variable-5): • Case a: Average coloring number: 6.04 (11-12 reactions per tube). • Case b: Average coloring number: 12.24 (5-6 reactions per tube). • Case c: Average coloring number: 11.6 (12-13 reactions per tube). These results indicate that variable primer selection for multiplex PCR, using the SLOGA algorithm, may indeed be used to significantly reduce the number of reactions per experiment. A similar run, with p = 10 (10 different optional primer pairs per target) shows some improvement for case c, but little or no improvement for cases a and b (Figure 3.12-2, variable-10). This result is probably due to the fact that case c involves a larger number of targets and therfore doubling p increases the number of possible proper subgraphs much more significantly.
3.3.5
Future Work
The results on both biological and synthetic data indicate that an algorithmic approach to primer design for multiplex PCR reactions is possible, and may indeed carry benificial results for the experimental applications in this field. However, biological implementation shows that the method is not yet complete and the following issues should be addressed: 55
1)
2)
a)
b)
c) Figure 3.12: 1) Results of SLO coloring for 100 synthetic interference graphs vs 1000 random graphs of the same edge density (e): a) 70 targets with τ2 = 4 (e = 0.2), b) 70 targets with τ2 = 3 (e = 0.47), c) 150 targets with τ2 = 4 (e = 0.2). 2) Results of SLO-GA coloring of 100 synthetic interference graphs with variable primers (5 and 10 primer pairs per target) vs SLO coloring of 100 synthetic interference graphs with presest primers (1 primer pair per target) for the same three configurations.
56
• Refinement of the interference model: The criteria for estimation of the dimerization potential of a pair of primers are obviously not well tuned. It is possible that a more thermodynamic-oriented model should be used (e.g. calculation of dimerization tm ). • Weak structure of the interference graph may be exploited to improve the results of the graph coloring heuristic. This may be particularly important if the chosen interference model is too stringent, resulting in graphs that are “hard” to color.
57
Appendix A Complete Probe Specificity Maps for the S. cerevisiae Transcriptome Complete probe specificty maps for the entire transcriptome of S. cerevisiae (6310 ORFs) were created according to the algorithm IClaSA, described in Section 2.2, and are publicly available at the website: http://bioinfo.cs.technion.ac.il/ProbeSpec/ The executable and compiled yeast data (ORF sequences and abundance) also appears at the same website, allowing creation of maps with different parameters. Maps were created according to the following parameters: • Probe length: l = 30. • Abundance weighted threshold values used are those indicated in Table 2.3. For comparing a transcript t against a background transcript b a threshold value was selected according to their relative abundances: at and ab , respectively. For each ORF, the file named ‘[ORF].map’ contains the following specificity information, in tab delimited format (summarized in TableA.1): • The name of the ORF and the related gene (if available). • Search parameters: – l - probe length. – w - criteria for differentiation between high/medium/low abundance. – r - threshold values for high/medium/low abundance background. • Specificity information for each probe p: 58
ORF 5324: YOL086C/ADH1 l=30, w[HI]=10, w[M ED]=1, r[HI]=7, r[M ED]=5, r[LO]=3 High Pos Dist Gene P/F 0 9 TPI1 1 1 8 TPI1 1 2 7 TPI1 1 ...
Medium Dist Gene P/F 4 ADH2 0 4 ADH2 0 4 ADH2 0
Low Dist Gene P/F 8 YPL09 1 9 UBP15 1 8 UBP15 1
Overall Dist P/F 4 0 4 0 4 0
Table A.1: Summary of probe specificity information contained in the file ‘[ORF].map’.
– Position of p along the ORF (0-based index). – For each of the high/medium/low abundance categories: ∗ The distance of the probe p from all ORFs in the abundance category. ∗ The name of the gene/ORF, in the abundance category, that contains the sequence most similar to p. ∗ Pass(1)/Fail(0) of specificty of p in the abundance category, according to threshold values. – The distance of the probe p from all ORFs in the transcriptome. – Pass(1)/Fail(0) of overall specificity of p.
59
Appendix B Genetic Algorithms B.1
General
Generally speaking, genetic algorithms are parallel search procedures inspired by the process of evolution in natural systems [18, 19, 34]. In contrast to more traditional optimization algorithms they work on many different solutions in parallel, or in the generic algorithm terminology - a population of individuals (or chromosomes). Each individual in the population represents a possible solution to the optimization problem, most simply in the form of a string of bits. Each individual is assigned a fitness value, which is calculated according to how well the solution solves the given problem. In the evolutionary scheme, the fitness value determines the probability of survival of the individual to the next generation - the higher the fitness, the higher the probability of survival. The genetic algorithm starts off with an initial population of individuals selected at random, and then iteratively makes use of three operators for creation of the next generation - selection, recombination and mutation. Selection consists of randomly selecting individuals from the population according to a probability proportional to their fitness. After selection, recombination is used to “mix” pairs of selected solutions together to create new solution combinations (as in sexual reproduction), and mutation is applied to randomly alter each part of the new solution with a given probability. The pseudo-code in Figure B.1 [34] represents the most simple implementation genetic algorithm. Several parameters of the genetic algorithm may be altered to achieve different behaviors (e.g. rate of convergence). These parameters include: • Population size - n • The rates of recombination and mutation - pR , pM 60
1. Start with a random population of n solutions. 2. Calculate the fitness f (x) of each solution x. 3. Create a new generation, until some stopping criterion is met: (a) Create n new solutions: i. Randomly select a pair of solutions from the current population with a probability proportionate to their fitness. ii. With a given probability recombine the two solutions. iii. With a given probability randomly modify the new solution. (b) Replace the current population with the new population. Figure B.1: General implementation of a genetic algorithm. Different variations and modifications of the algorithm are possible, for example: • Different models of selection of “good” solutions for the next generation are possible: – “Roulette wheel” - The probability of each individual to be selected is linearly proportional to its fitness (this may be envisaged as each individual getting a “slice” of a roulette wheel proportional to its fitness, with uniform selection over the wheel). This method takes into account the values of the individuals’ fitness. – “Rank selection” - g individuals are randomly chosen from the population and the best of these individuals is selected. This method does not take into account the specific fitness values but rather their ranking. – “Elitism” - The best l individuals are always transferred to the next generation. • Different generation models may be implemented: – Discrete generations - In each iteration of the algorithm a complete set of n new individuals is created, and fully replaces the previous generation. – “Steady state” - In each iteration of the algorithm k new individuals are created, and replace k “poor” individuals of the previous generation (selected randomly with bias inverse to their fitness). • A variety of solution representations and fitness functions may be employed for different optimization problems (see Section B.2). 61
Genetic algorithms have been successfully implemented to solve many scientific and engineering optimization problems from many fields. Although there is no solid theoretical support for deciding when to use genetic algorithms, experiments show that when the solution space of problem is large and unsmooth, and the task does not necessarily require a global maximum to be found (i.e. a sufficiently good solution is enough), a genetic algorithm will have a good chance of being competitive with or even surpassing other search methods [34, 11].
B.2
Implementation
In Section 3 I describe implementations of genetic algorithms for solving the maximum clique in a hypergraph problem and for solving the representative subgraph coloring problem - both optimization problems arising in the design of oligonucleotides for complex reactions. A general and modular package for implementation of genetic algorithms was created using MFC/C++ and is available at the web location: http://www.cs.technion.ac.il/~dlipson/GA.zip This package contains implementation of the following modules (see Figure B.2 for scheme): • GeneticAlgorithm: An abstract class representing the overall GA routine - creation of an initial population and optimization of this population by iteration. Two derivations are included: – GAGeneration: Iteration of population by discrete generation model. – GASteady: Iteration of population by steady-state model. • Population: An abstract class representing the population of solutions maintained by the GA. Allows selection of a best/good/bad/worst solution from the population, creation and handling of solutions. Two derivations are included: – PopulDistribution - Implementation of selection using the ”roulette wheel” model. – PopulRank - Implementation of selection using the ”rank selection” model. • Solution: An abstract class representing a single solution (individual) in the population. Describes the operators for mutation of the solution and its recombination with another solution. The fitness of a solution may be calculated using 62
Figure B.2: Schematic representation of Genetic Algorithm modules. Shaded boxes denote abstract classes. Broken arrows represent inheretence.
a fitness function. One derivation is included: – VectorSolution - Representation of the solution as a vector A ∈ C l , where C = {1, ..., t}. This representation is useful for classification optimization problems (e.g. graph coloring), where each coordinate of the vector denotes the classification (color) of a particular item (vertex) and other arbitrary problems whose solutions may be represented as a bit vector (where C = {0, 1}). ∗ Mutation: the value of each coordinate may be randomly changed. ∗ Recombination: each coordinate of the new solution is assigned a value copied from a random parent.
B.3 B.3.1
Application Maximum Clique in a Hypergraph Problem
The problem of finding a maximum clique in a hypergraph and its application in designing oligonucleotides for a molecular implementation of a shift register was described in Section 3.2. The algorithm used for solving this problem is a variation of a heuristicbased genetic algorithm (HGA), first described in [32], for solving the Maximum Clique Problem in an ordinary graph (i.e. a 2-uniform hypergraph). The results described in Section 3.2.4 were obtained using a genetic algorithm with the following parameters: • Population size: n = 50 63
• Stop criteria: Convergence. • Generation model: Steady state, k = 0.2n. • Selection model: Rank selection, g = 10. • Mutation rate: pM = 0.9, pR = 0.7. • Solution model: Vector solution A ∈ {0, 1}l , l = |V |, denoting a subgraph G0 , where the coordinate ai = 1 if vi ∈ G0 and ai = 0 otherwise. The heuristic modification of the GA includes finding a clique C proximate to the subgraph G0 prior to calculating its fitness, as described in Figure 3.4. • Fitness function: For a clique C: f (C) = |C|.
B.3.2
Representative Subgraph Coloring Problem
The problem of Proper Subgraph Coloring and its application in designing primers for a multiplex PCR was described in Section 3.3. The results for variable primer selection, described in Section 3.3.4 were obtained using a genetic algorithm with the following parameters: • Population size: n = 100 • Stop criteria: Convergence. • Generation model: Steady state, k = 0.2n. • Selection model: Rank selection, g = 5. • Mutation rate: pM = 0.9, pR = 0.7. • Solution model: Vector solution A ∈ {1...t}l , l = |S| (the number of target sequences), t = p (the number of possible primer pairs per sequence), representing a proper subgraph G0 ⊂ Gv . For each target sequence si ∈ S the coordinate ai denotes a primer pair selection pp(si ) = ppai ∈ P P (s) (see 3.3.2 for the full problem definition). • Fitness function: For a proper subgraph G0 : f (G0 ) = col(G0 ), calculated by SLO-coloring (see Figure 3.10).
64
Bibliography [1] Primer Express Software v1.5, Applications-Based Primer Design Software. Applied Biosystems. [2] I. Baskin, S. Zaitsev, D. Lipson, R. Gilad, G. Ben-Yoseph, and U. Sivan. A Molecular Shift Register and its Utilization as an Autonomous DNA Synthesizer. In preparation. [3] A. Ben-Dor, R. Karp, B. Schwikowski, and Z. Yakhini. Universal dna tag systems: A combinatorial scheme design. Journal of Computational Biology, 7:503–520, 2000. [4] Y. Benenson, T. Paz-Elizur, R. Adar, E. Keinan, Z. Livneh, and E. Shapiro. Programmable and autonomous computing machine made of biomolecules. Nature, 414(6862):430–434, 2001. [5] M. Bittner, P. Meltzer, Y. Chen, Y. Jiang, E. Seftor, M. Hendrix, M. Radmacher, R. Simon, Z. Yakhini, A. Ben-Dor, N. Sampas, E. Dougherty, E. Wang, F. Marincola, C. Gooden, J. Lueders, A. Glatfelter, P. Pollock, J. Carpten, E. Gillanders, D. Leja, K. Dietrich, C. Beaudry, M. Berens, D. Alberts, V. Sondak, N. Hayward, and J. Trent. Molecular classification of cutaneous malignant melanoma by gene expression profiling. Nature, 406(6795):536–540, 2000. [6] A.P. Blanchard and L. Hood. Sequence to array: Probing the genome’s secrets. Nature Biotechnology, 14:1649, 1996. [7] I. Bomze, M. Budinich, P. Pardalos, and M. Pelillo. The maximum clique problem. In D.-Z. Du and P. M. Pardalos, editors, Handbook of Combinatorial Optimization, volume 4. Kluwer Academic Publishers, Boston, MA, 1999. [8] R. Carter and K. Park. How good are genetic algorithms at finding large cliques: an experimental study. Technical Report 1993-015, 1993. [9] M.H. Caruthers, S.L. Beaucage, C. Becker, J.W. Efcavitch, E.F.Fisher, G. Galluppi, R. Goldman, P. deHaseth, M. Matteucci, and L. McBride. Deoxy-
65
oligonucleotide synthesis via the phosphoramidite method. Gene Amplification Analysis, 3:1–26, 1983. [10] J.M. Cherry, C. Ball, K. Dolinski, S. Dwight, M. Harris, J.C. Matese, G. Sherlock, G. Binkley, H. Jin, S. Weng, and D. Botstein. Saccharomyces Genome Database. ftp://genome-ftp.stanford.edu/pub/yeast/SacchDB/. [11] L. Davis. Genetic Algorithms and Simulated Annealing. Pitman Publishing, 1987. [12] T. Fahle. Simple and fast: Improving a branch-and-bound algorithm for maximum clique. In 10th European Symposium on Algorithms (ESA), pages 485–498, 2002. [13] H. Fredricksen. A survey of full length nonlinear shift register algorithms. SIAM Review, 24:195–221, 1982. [14] M.R. Garey and D.S. Johnson. Computers and Intractability, a Guide to the Theory of NP-Completeness. W.H. Freeman and Company, 1999. [15] S.W. Golomb. Shift Register Sequences. Aegean Park Press, 1982. [16] T.R. Golub, D.K. Slonim, P. Tamayo, C. Huard, M. Gaasenbeek, J.P. Mesirov, H. Collerand M.L. Loh, J.R. Downing, M.A. Caligiuri, C.D. Bloomfield, and E.S. Lander. Molecular classification of cancer: Class discovery and class prediction by gene expression monitoring. Science, 286(5439):531–537, 1999. [17] F. Guarnieri, M. Fliss, and C. Bancroft. Making dna add. Nature, 414(6862):430– 434, 2001. [18] J. Holland. Genetic algorithms and the optimal allocations of trials. SIAM Journal of Computing, 2(2):88–105, 1973. [19] J. Holland. Genetic algorithms. Scientific American, pages 66–72, July 1992. [20] F.C.P. Holstege, E.G. Jennings, J.J. Wyrick, T.I. Lee, C.J. Hengartner, M.R. Green, T.R. Golub, E.S. Lander, and R.A. Young. Dissecting the regulatory circuitry of a eukaryotic genome. Cell, 95:717–728, 1998. [21] P.M. Howley, M.F. Israel, M.F. Law, and M.A. Martin. A rapid method for detecting and mapping homology between heterologous dnas. evaluation of polyomavirus genomes. J. Biological Chemistry, 254:4876–4883, 1979. [22] T.R. Jensen and B. Toft. Graph Coloring Problems. John Wiley and Sons, 1995. [23] K. Keren K, M. Krueger, R. Gilad, G. Ben-Yoseph, U. Sivan, and E. Braun. Sequence-specific molecular lithography on single dna molecules. 297(5578):62–63, 2002. 66
Science,
[24] L. Kaderali and A. Schliep. Selecting signature oligonucleotides to identify organisms using dna arrays. Bioinformatics, 18(10):1340–1349, 2002. [25] R. Kalendar.
Oligos 9.11, PCR primer design program for Windows.
http://www.biocenter.helsinki.fi/bi/bare-1 html/oligos.htm. [26] G.H. Keller and M.M. Manak. DNA Probes. Macmillan Publishers, 1989. [27] E.S. Lander. Array of hope. Nature Genetics, 21:3–4, 1999. [28] F. Li and G.D. Stormo. Selection of optimal dna oligos for gene expression arrays. Bioinformatics, 17(11):1067–1076, 2001. [29] D. Lipson, P. Webb, and Z. Yakhini. Designing specific oligonucleotide probes for the entire s. cerevisiae transcriptome. In Algorithms in Bionformatics, Second International Workshop (WABI), pages 491–505, 2002. [30] T. Lowe, J. Sharefkin, S.Q. Yang, and C.W. Dieffendach. A computer program for selection of oligonucleotide primers for pcr. Nucleic Acids Res., 18:1757–1562, 1990. [31] Y. Lysov, A. Chernyi, A. Balaev, F. Gnuchev, K. Beattie, and A. Mirzabekov. Dna sequencing by contiguous stacking hybridization on modified oligonucleotide matrices. Molecular Biology, 29(1):62–66, 1995. [32] E. Marchiori. A simple heuristic based genetic algorithm for the maximum clique problem. In Selected Areas in Cryptography, pages 366–373, 1998. [33] M.J. McPherson, P. Quirke, and G.R. Taylor. PCR - A Practical Approach. Oxford University Press, 1996. [34] M. Mitchell. An Introduction to Genetic Algorithms. MIT Press, 1998. [35] M. Mitsuhashi, A. Cooper, M. Ogura, T. Shinagawa, K. Yano, and T. Hosokawa. Oligonucleotide probe design - a new approach. Nature, 367:759–761, 1994. [36] A.M. Mood. The distribution theory of runs. Ann. Math. Stat., 11:367–392, 1940. [37] M. Morris, G. Schachtel, , and S. Karlin. Exact formulas for multitype run statistics in a random ordering. SIAM J. Disc. Math., 6(1):70–86, 1993. [38] K. Mullis and F. Faloona. Specific synthesis of dna in vitro via a polymerasecatalyzed chain reaction. Methods in Enzymology, 155:335, 1987. [39] S. Rahmann. Rapid large-scale oligonucleotide selection for microarrays. In Proceedings of the IEEE Computer Society Bioinformatics Conference (CSB), 2002. 67
[40] R.M. Roth, P. Webb, and Z. Yakhini. Tagging DNA Fragments and Graph Coloring Methods. HP Laboratories HPL-97-60, 1997. [41] W. Rychlik and R.E. Rhoads. A computer program for choosing optimal oligonucleotides for filter hybridization, sequencing and in vitro amplification of dna. Nucleic Acids Research, 17(21):8543–8551, 1989. [42] W. Rychlik, W.J. Spencer, and R.E. Rhoads. Optimization of the annealing temperature for dna amplification in vitro. Nucleic Acids Research, 18(21):6409–6412, 1990. [43] J. SantaLucia. A unified view of polymer, dumbbell, and oligonucleotide dna nearest-neighbor thermodynamics. PNAS USA, 95:1460–1465, 1998. [44] J. SantaLucia, H.T. Allawi, and P.A Seneviratne. Improved nearest-neighbor parameters for predicting dna duplex stability. Biochemistry, 35:3555–3562, 1996. [45] E. Southern, K. Mir, and M. Shchepinov. Molecular interactions on microarrays. Nature Genetics, 21(1):5–9, 1999. [46] P.T. Spellman, G. Sherlock, M.Q. Zhang, V.R Iyer, K. Anders, M.B. Eisen, P.O. Brown, D. Botstein, and B. Futcher. Comprehensive identification of cell cycleregulated genes of the yeast saccharomyces cerevisiae by microarray hybridization. Molecular Biology of the Cell, 9(12):3273–3297, 1998. [47] L. Stryer. Biochemistry. W.H. Freeman and Company, 1995. [48] A.C. Syvanen. Accessing genetic variation: Genotyping single nucleotide polymorphisms. Nature Reviews Genetics, 2:930–942, 2001. [49] R.B. Wallace, J. Shaffer, R.F. Murphyand J. Bonner, T. Hirose, and K. Itakura. Hybridization of synthetic oligodeoxyribonucleotides to φχ174 dna: the effect of single base pair mismatch. Nucleic Acids Research, 6:3543–3547, 1979. [50] E. Winfree, F. Liu, L.A. Wenzler, and N.C. Seeman. Design and self-assembly of two-dimensional dna crystals. Nature, 394(6693):539–544, 1998.
68