Proceedings of the 50th Hawaii International Conference on System Sciences | 2017
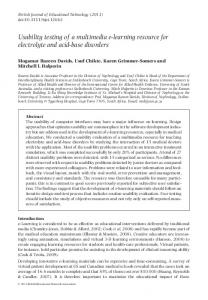
Optimizing usability testing in the context of a large-scale software service for digital textbooks Margit Kastner Vienna University of Economics and Business
[email protected]
Bernd Simon Knowledge Markets Consulting GmbH
[email protected]
Abstract
is crucial in order to be able to develop usable platforms. Thus, user characteristics such as age, gender, and technology expertise must be taken into account [5]. With regard to users’ expertise, in the sense of both general computer aptitude and application familiarity [6], research has already pointed out that users’ IT background should be considered in usability tests [7] because analyzing the performance of, for instance, novice and expert users provides deeper insights [8]. However, this is hardly included in usability testing [9]. Keeping these issues in mind, the present study follows the design science research methodology [10, 11] which offers systematic and practical guidelines for building innovative information systems artifacts in order to solve a problem in an organized and effective manner [12]. Design science research distinguishes artifacts on different levels of abstraction, ranging from highly abstract theories to very concrete IT artifacts with only a small degree of abstraction. Though, all types of artifacts – regardless of their abstraction level – are considered as factors for valuable contributions [10]. In this research, two artifacts with different levels of abstraction are investigated: (1) an optimized method for usability testing and (2) a fully functional software service for delivering digital textbooks to around 250,000 potential users with heterogeneous IT background. Hence, the focus of our research is the (whole) design cycle which lies at the core of each design science research project. This iterative process between generating and evaluating artifacts aims to refine and improve a design until a satisfactory level is reached [13]. Thus, our second artifact – the design of an IT artifact – is subject in an empirical evaluation of the proposed usability evaluation method which forms our first artifact. The study aims to address the following research questions: (1) Is usability evaluation beneficial to design and redesign a software service for digital textbooks? (2) Is it possible to optimize the methods used in usability evaluation from an effectiveness and efficiency point of view? (3) Do users with diverse technology expertise encounter different usability flaws? To the best of our knowledge, this is the first
The adoption of digital textbooks in education has steadily increased. This paper reports on the initiative Digi4School aiming to provide a large-scale software service for digital textbooks. Since the usability of this service is of particular concern, it is the subject of a design science research project with the goal to investigate two artifacts: (1) an optimized method for usability testing and (2) a fully-functional software service for delivering digital textbooks to users with heterogeneous IT background. We conclude that a combination of usability tests and the use of a questionnaire including closed and open-ended questions is recommended. Furthermore, both novice and expert users should evaluate a system’s usability with iterations until the usability measures reach a satisfactory level for all users. This was achieved for Digi4School. Such an approach has the potential to identify and eliminate flaws that prevent users from adopting the system.
1. Introduction Driven by advances in e-book technologies as well as by the surge of e-book usage generally, the adoption of digital textbooks in education has steadily increased [1]. In central Europe, for example, there are several country-wide initiatives as well as individual activities of leading publishing houses which have successfully been accepted by early adopters. However, when it comes to attracting users beyond the early adopters stage, the usability of the software service that provides digital textbooks becomes of utmost importance [2]. In particular, inexperienced users need to be enabled to successfully complete tasks [3]. The International Organization for Standardization gives guidance on the description of usability and developed the international standard ISO 9241 defining usability as the extent to which a product can be used by specified users to achieve specified goals effectively, efficiently, and satisfactorily in a specified context of use [4]. This implies that knowledge of a system’s users
URI: http://hdl.handle.net/10125/41164 ISBN: 978-0-9981331-0-2 CC-BY-NC-ND
114
empirical study which examines usability methods for the design of a software service for digital textbooks. In particular, the incorporation of users’ technology expertise will additionally enrich our findings providing new methodological and practical insights on how to design large-scale Software-as-a-Service (SaaS) solutions and optimize usability testing in such environments. The overall outline of this paper is based upon the structure of design science research studies as proposed by Gregor and Hevner [10]. After this introduction, Section 2 presents related work and gives an overview of diverse usability evaluation methods. Then, Section 3 focuses on the IT artifact description as well as on the design of the usability evaluation. Section 4 reports the evaluation results of the study. Finally, Section 5 discusses implications of these findings focusing on the three research questions. Moreover, it provides practitioners with tips.
2. Related research 2.1. Software for e-books and digital textbooks In recent years, artifacts such as digital textbooks and e-books have raised significant attention from the research community whereas in the educational context – according to Jung [as cited in 14] – the name “digital textbooks” has gained acceptance to better highlight the learning function and role in education. Besides the features of printed textbooks, digital textbooks add value by including functionalities such as memo and note-taking, highlighting, bookmarking, searching, or zooming in and out [14]. Thus, digital textbooks offer many opportunities for institutions to enhance learning and teaching [1]. Driven by this motivation, researchers have placed a particular emphasis on measuring or optimizing the usability of e-books, digital textbooks, and the software service providing these IT artifacts. Yi et al. [15], for instance, investigate the usability of e-books against the three key aspects of readability, comprehensibility, and satisfaction. Taking into account two major typographical factors, namely the number of columns as well as line spacing, the study reveals that they are critical for e-book experiences. The e-book design or more specifically the digital textbook design has also been examined by Chong et al. [16] who give some advice on what an ideal e-book should look like. Turning now to the reader software, Siegenthaler et al. [2] tested five e-readers and a printed book and concluded that although there are differences in the ereaders’ usability, all devices still lack usability. In addition, users evaluate their function range poorly. This implies that e-readers are not seen as a replacement for printed books although they have good legibility
ratings. With regard to the applied testing methods (a combination of eye-tracking and a questionnaire), Siegenthaler et al. [2] found dissociations between the two types of usability testing, particularly for expert users. Thus, they stress the importance of multi-method approaches. Another comparative study on e-readers by Gingras et al. [17], for instance, rates usability considering the devices’ layout and design, display technology, annotation, searching and highlighting functionalities, and navigation as well as ergonomics. In their research, Jardina and Chaparro [18] argue that all e-readers analyzed showed strengths and weaknesses regarding tasks typically performed by students such as bookmarking, searching, taking and locating notes. Thong et al. [19] investigated user’s acceptance of digital libraries – another software component designed to provide digital textbooks – and applied an extended technology acceptance model (TAM). Their study revealed that interface characteristics (i.e. used terminology, screen design, and navigation clarity) have a significant impact on the perceived ease of use and subsequently the perceived usefulness as well as user’s intention to utilize the system. Beyond the IT artifact itself, organizational and individual influencing factors are recognized as being important. On the individual level, domain knowledge, computer experience, and computer self-efficacy are identified to have a positive effect on user’s perceived ease of use while in the organizational context the relevance and accessibility of the system play a key role. Another study on the evaluation of digital libraries showed that usefulness (i.e. level and relevance of information), usability (i.e. ease of use, learnability), and functionalities affect user interaction and satisfaction [20]. So far, only one single study focusing on the improvement of a digital textbook platform interface using a systematic approach has been conducted. By applying an iterative design and evaluation model comprising multiple methods such as a questionnaire, log files, heuristic evaluations, and cognitive walkthrough, Lim et al. [21] developed a software service for delivering digital textbooks to elementary-school students. Critically reflecting their findings, the authors conclude that their evaluation model was essential for successfully enhancing usability. One of the common limitations of research conducted so far is that little emphasis has been put on investigating the usability of the whole software service. Although the functionalities provided are rather limited, the analyzed studies only focused on single components rather than the usability of the complete system. In addition, many studies paid attention to e-books while the education-specific peculiarities of digital textbooks had not been taken into account. Finally, with the exception of Siegenthaler et al. [2] and Lim et al. [21],
115
The evaluation of usability aims at assessing the functionality of a system, reviewing users’ experience, identifying problems with the system or its handling [22], and suggesting improvements in case of lacking usability. Despite its importance, there are, however, two schools of thoughts on the measurement of usability: the evaluation by users (i.e. end users of the system) and the evaluation by experts (i.e. developers of the system and usability professionals). As shown in Figure 1 the method of pluralistic walkthroughs uses teams consisting of both users and experts. Evaluation including user participation. This evaluation is either performed in a controlled setting in a laboratory or in the users own environment [22]. By applying performance measurements and questionnaires, it is possible to quantify usability. While in performance measurement the researcher analyzes metrics such as the time a user needs to complete a task, the number of errors in log files, or the number of tickets submitted to a support hotline [23], data from questionnaires includes the views and experiences of users after they have worked with the system (i.e. participated in a usability evaluation session) [24]. The resulting data of interviews, focus groups, physiological responses, think aloud analyses, and field observations is of qualitative nature. Interviews or focus groups can deliver deeper insights into users’ opinions than questionnaires [24]. However, they should be mainly used in the early stage of development [23, 25] and do not provide representative data. Monitoring physiological responses can be performed by eye tracking and measuring heart, sweat glands, muscle, and brain activity [22]. Due to the fact that these methods involve the usage of rather expensive equipment, in most cases the application of this method is currently not feasible [23]. The remaining two methods are observational techniques. The think aloud evaluation produces protocols of what comes into users’ minds as they complete a task [23, 24]. In field observation studies, users are observed when applying the system in the way they would usually do in their daily life [23]. Evaluation including expert participation. The most important methods involving experts are the cognitive walkthrough and the heuristic evaluation. One or more experts complete several tasks and answer questions from the perspective of the end user applying the cognitive walkthrough [23, 24]. Using the heuristic evaluation means that three to five experts separately inspect the system following heuristics (i.e. guidelines)
Evaluation by Users
Evaluation by Experts
Performance Measurement
Early
Quantitative
Interview / Focus Group Physiological Responses
Qualitative
Pluralistic Walkthroughs
Questionnaire All
Think Aloud
Quantitative Heuristic Evaluation Cognitive Walkthrough
Final
Data (Results)
2.2. Usability evaluation
which are combined and sometimes also discussed in a debriefing meeting later on [26]. Evaluation including user and expert participation. The pluralistic walkthrough provides the advantage that a team comprised of both users and experts performs indicated tasks and discusses their usability. Thus, diverse skills and perspectives are taken into account. On the other hand, all evaluators have to wait for the slowest respondent performing the task [27].
Stage of Deveopment
no guidance has been provided so far on the more abstract level of designing software services for digital textbooks and testing their usability.
Qualitative
Field Observation
Figure 1. Usability evaluation methods As shown in Figure 1, the methods produce either qualitative or quantitative data while qualitative research is particularly suitable for exploring what people think or feel in a detailed and comprehensive manner [28]. It uncovers underlying reasons why a user perceives a system as (not) usable. Quantitative research on the other hand aims to recognize overall patterns and allows for generalizations of the results [29]. So, if the objective of the research is to find out how many users support a system’s usability and how strongly they support it, this is the right method of choice. Although often only one type of methodology is used, they are even more valuable when combined in order to study the same phenomenon [29]. The usage of multiple methods is also supported in usability evaluation [e.g. 2, 21] and it is suggested to apply an iterative design whereby a constant rotation of evaluating and modifying a system can be recognized [30]. Nielsen [31] observed great improvement gains between these iterations. However, in some projects reviewed they also detected that scores of some usability principles are lower in the modified version. Moreover, evaluations by experts and users supplement each other [25, 26]. In consideration of the difficulty of end user recruitment and tight budgets, it is best to have an expert evaluation first to the most obvious defects before the system is tested by end users [26]. Others indicate that obtaining data from end users’ actual usage is superior [e.g. 30] to evaluate several usability aspects [32] because end users will detect more serious problems [33]. From a marketing perspective, this is essential since a product or service must meet the needs of customers in order to be successful [34]. In addition, it has been recognized that end users with heterogeneous technology expertise (i.e. general
116
computer aptitude and application familiarity [6]) have different requirements in terms of usability. Hence, this should be taken into account in usability tests [7] in order to gain deeper insights into novice and expert users’ needs [8].
3. Artifact description 3.1. Digi4School’s software service We have developed a working software service for digital textbooks using the OpenACS web application framework [35]. The software service truly qualifies for a Software-as-a-Service (SaaS) solution, since the software can be directly accessed via the Internet [36] by using a web browser or mobile Apps on iOS, Android, or Windows 10. The underlying framework relies on a PostgresQL database (version 9.5) and uses Naviserver as an application runtime environment. The system architecture of Digi4School consists of the following interoperable components: With the Digital Bookshelf learners can manage and access their digital textbooks via a built-in Reader component. The Paradata Management Service holds learners’ notes, bookmarks, and highlights. The Catalogue lists all digital textbooks in the form of metadata records. Access control is also managed via the Catalogue taking advantage of the Learning Tools Interoperability (LTI) specification [37]. The Delivery System stores digital textbooks. Once a learner is authorized, the system component makes
the textbook available to the learner. By means of the Provisioning System, publishing houses can convert PDF-based versions of printed textbooks into an HTML5 version, annotate these textbooks with metadata, generate access codes, and publish the books for the delivery system. By September 2016, the software service provides a digital home for about 900 different digital textbooks, serving potentially 250,000 learners in secondary education in Austria. After registration and entry of the access code (which currently comes with the printed textbook), learners gain access to digital textbooks via their personal digital bookshelf (see Figure 2). The software service thereby allows users to learn when and wherever they like.
3.2. Usability testing Setting. In order to evaluate our software service for delivering digital textbooks, two generations of usability tests were conducted. In doing so, we applied a combination of test methods as suggested by Siegenthaler et al. [2] and others [21] to gather maximum input for further improvements. Think aloud tests and field studies with a subsequent questionnaire comprising questions to reveal quantitative (i.e. usability principles based on ISONORM 9241-10) and qualitative data (i.e. freely expressed opinions) were combined. We ran testing in six schools including commercial academies, high schools, and technical colleges in Austria from December 2015 to May 2016. The first generation test (G1) focused on the reader as the core system component from the learner’s point
Figure 2. Snapshots of user interface components of Digi4School 1 Registration
2 Entering Access Code
3 Accessing Digital Textbook
117
of view. For G1, we collected data twice whereas study participants had to evaluate an improved reader in the second test. In each test session (G1.1 and G1.2), we applied a think aloud study and a field test where participants had to accomplish two tasks. The think aloud method was used in combination with audio and video recording to capture users’ thoughts and interactions in detail. After an introduction into the think aloud method, end users had to work through 19 tasks while articulating what comes into their mind. In the field study, students first had to solve the same 19 tasks using the system and second, they had to complete a feedback questionnaire evaluating the usability of the software service. For this feedback, an adapted version of the questionnaire ISONORM 924110 developed by Prümper and Anft [38] was used. The questionnaire is based on the seven ergonomic principles of ISO 9241-10, namely 1) suitability for the task, 2) self-descriptiveness, 3) controllability, 4) conformity with user expectations, 5) error tolerance, 6) suitability for individualization, and 7) suitability for learning. Utilizing these existing measures holds the advantage that they are tested for reliability and validity [39] and can be applied for software as well as for prototypes which have character or graphical interfaces [40]. In education, the questionnaire has already been successfully used by various researchers [e.g. 41, 42]. Since the two principles of controllability and suitability for individualization are not relevant for Digi4School, these measures were excluded in our usability test. The feedback questionnaire included besides some demographics, information on participants’ technical expertise in terms of IT skills and computer selfefficacy. These measures were borrowed and adapted from prior research [43, 44]. We also provided the opportunity to add comments to the quantitative assessments. In G1, a comment field was included at the end of the questionnaire where participants could express what they liked or disliked when using the reader. In contrast to G1, the second generation test (G2) additionally included the registration and management of a digital bookshelf. In the first test round of G2, the same reader was evaluated as in the second session of G1. Then, the results of the first G2 test session were used for improvements of the SaaS solution before the system was tested again. The questionnaire used in G2 was also extended by the opportunity to add comments after each usability principle. Apart from these amendments, all other test methods mirrored the test methods described before. Analyses. Several methods were applied to assess the qualitative and quantitative data. For the assessment of the qualitative data (comments
and opinions collected via questionnaire and transcripts of the think aloud approach), a qualitative content analysis as proposed by Mayring [45] was performed in order to identify categories or commonalities within the data. A collaborative approach was thereby used to enhance accuracy [46]. One analyst created the initial coding before the second analyst verified these codes by re-examining the original data. In case of dissent, the analysts discussed the respective code before generating a final version. The quantitative analyses started with an investigation of the different ergonomic principles of usability. As a first step, mean value indices of the various items were built. Then, all these indices (constructs) were tested for reliability applying Cronbach’s alpha whereas the recommended cut-off point of .7 [47] was always met with values between .730 and .857. To group participants based on their technology expertise, the Typology Representing Network (TRN32) software by Mazanec [48] was used. The weighted Simple Structure Index (wSSI), a heuristic between 0 and 1, helps to identify the number of clusters. The higher the wSSI value, the higher the contrast between the clusters [49]. In addition, the stability of the cluster solution is evaluated by inspecting the Percentage of Uncertainty Reduction (%UR) when running 50 replications [49]. To test for differences between the revealed groups, the following tests using SPSS 23 were conducted: First, it is assessed whether the data meets the assumption about normally distributed data. In case the data is normally distributed, parametric tests are used while non-normally distributed data calls for non-parametric tests. The parametric test for comparison of the mean of two groups is the t-test while for comparison of more than two groups the ANOVA test is performed. Depending on the result of the Levene test which investigates equality of variances, either the Scheffé test or the Games-Howell test is carried out [29]. The nonparametric counterparts of the t-test and the ANOVA test are the Mann-Whitney test and the Kruskal-WallisH test. All plots displaying the usability tests of Digi4School were generated by using the software package ‘plotrix’ in R [50]. Participants. As mentioned, the sample included students participating in G1 and G2. The first G1 test was conducted in December 2015 (n=117 in G1.1) and the second in January 2016 (n=69 in G1.2). The G2 tests were both carried out in May 2016 (n=31 in G2.1; n=102 in G2.2). Participants were on average 15.87 years old (SD 1.30) and almost evenly distributed between female (52.1%) and male (47.9%) students. They came from different types of schools, namely commercial
118
academies, high schools, and technical colleges in Austria. In order to have a more meaningful view of the usability of Digi4School, study participants were first clustered around their perceived competence in using Web applications in general and Digi4School in particular. The wSSI of .449 and the uncertainty reduction over 50 replications (%UR=97.62%) opted for a two-cluster solution. In the following, the clusters are labeled, the main characteristics briefly described, and differences regarding educational stage (p=.008), age (p=.087), and gender (p=.046) of the profiles are presented. Novices (21.0%): This smaller cluster consists of students who perceive themselves as not competent and skilled in using Web applications. They also think that their classmates are more competent and they hardly know how to use Web applications when they need them. Therefore, they are also not confident that they will manage to use Digi4School without assistance. Students in this group are not that advanced in their school career. 70.3% are in grade 9 or 10 and are hence younger. Furthermore, the novices cluster comprises more female students (63.1%). Experts (79.0%): The majority of the students are confident about their competence in using Web applications. Furthermore, they are convinced that they are more skilled than their classmates. Thus, handling Digi4School will not be a challenge for them even without support. Around half of the experts are males (50.8%) and there are fewer students in grade 9 and 10 (49.4%) than in the novice cluster. The remaining 50.6% are in grade 10 and 11. This means that they are also a bit older.
4. Evaluation results 4.1. First generation test Qualitative results. Reviewing the comments of the respondents after their real-life experience with the SaaS solution showed that in G1 each participant provided on average two comments resulting in a wealth of positive and negative information. More specific, in G1.1 144 positive and 70 negative statements and in G1.2 107 positive and 53 negative statements came up ranging from design issues such as the color for highlighting to more severe issues including missing error messages or wrong page numbers on previews (see Table 1). Not surprisingly, expert users provided far more information than novice users and their comments together with the findings of the think aloud evaluation resulted in an improved version of the software service after the G1.1 test.
Table 1. Comments in G1 Novices G1.1 G1.2
ease of use (4), highlighting (3), navigation (14) (2), notes (2), searching (1), usefulness (1), well-designed (1) highlighting (1), mobile view (1), (7) navigation (1), notes (1), performance (1), preview (1) ease of use (2), well-designed (1), ease of (4) learning (1) highlighting (2), navigation (1), difficult to (4) learn (1)
Experts
(130) G1.1
(63)
(103) G1.2
(49)
ease of use (40), well-designed (16), ease of learning (12), navigation (12), accessibility (9), highlighting (9), bookmarking (8), notes (8), searching (6), usefulness (4), readability (3), innovativeness (1), mimics real world (1) preview (17), error handling (13), highlighting (10), searching (6), functionality missing (5), navigation (4), not well designed (3), notes (3), immature (1), performance (1) ease of use (20), well-designed (13), highlighting (12), notes (12), ease of learning (11), navigation (11), bookmarking (6), searching (6), accessibility (5), usefulness (4), mimics real world (1), performance (1), readability (1) highlighting (20), notes (8), functionality missing (7), difficult to learn (4), navigation (3), not well designed (3), bookmarking (2), searching (1), zooming (1)
Note: positive, negative; numbers of mentions in brackets
This data was accompanied with a think aloud evaluation conducted with 14 students in one school. It became apparent that after the first six students no additional problems could be identified. The think aloud evaluation confirmed the qualitative results of the questionnaire-based evaluation. Thus, the main problems resided in the highlighting and the notes functionalities. However, the think aloud evaluation provided deeper insights into the underlying problem. The students quite clearly expressed the issues that arouse around those two features leading to concrete suggestions for improvements such as a new option for drawing straight lines or a new way for moving notes. Quantitative results. The first test in G1 (G1.1) revealed that especially novices had usability problems with error tolerance (ERR) being evaluated worst (see Figure 3). However, other principles (i.e. suitability for the task (TASK), self-descriptiveness (DESC), conformity with user expectations (CONF), and suitability for learning (LEARN)) did not meet the desired values, either. Experts rated the usability of the reader rather high. Only error tolerance lagged behind as well which was confirmed by users’ comments.
119
After a modification based on the comprehensive feedback revealed in G1.1 and the analysis of the qualitative data, the second test in G1 (G1.2) showed that usability had improved for novices in all aspects. For experts, however, this does not hold true. Here we find a clear improvement only for CONF and ERR; for other principles even some marginal declines in participants’ evaluation were detected. Nonetheless, all values were above 4 on a 5-point Likert scale. NOVICES
EXPERTS G1.1
differently. In G1.2 this phenomenon does not emerge anymore. Only the usability principle ERR was still assessed differently. The results show that the improved version of the reader is also user-friendly for novices.
4.2. Second generation test Qualitative results. Interestingly, in G2 far less comments (0.6 per user) were made in the questionnaire and novices were rather unclear in their statements. They hardly made any suggestions for further improvements compared to experts. In G2.2, several concrete functionalities were specified as desired which gives room for further improvements. More details on the upcoming topics are shown in Table 4. Table 4. Comments in G2
G1.2
Figure 3. Comparison G1 Table 2 gives further information and displays that the advances regarding the usability principles CONF and ERR were significant for both novices as well as experts. Table 2. Comparison G1 G1.1(1) TASK 3.772 DESC 3.759 CONF 3.520 ERR 2.910 LEARN 3.864 (1) (2)
Novices G1.2(1) Z p(2) G1.1(1) 4.029 -0.687 4.385 3.657 -0.344 4.131 4.143 -1.764 * 4.121 3.676 -1.850 * 3.369 4.021 -0.915 4.576
Experts G1.2(1) Z p(2) 4.001 -0.126 4.153 -0.031 4.345 -2.144 ** 4.272 -4.862 *** 4.553 -0.284
Mean value indices of the principles in G1.1 and G1.2 (Likert scale: 1=strongly disagree to 5=strongly agree) Significant levels: *** .001; ** .05; * .01
Table 3. Comparison novices and experts TASK DESC CONF ERR LEARN (1)
G1.1 Z p(1) -3.261 *** -2.667 ** -2.987 *** -1.060 * -4.227 ***
G1.2 Z p(1) -1.302 -1.260 -0.151 -1.959 ** -0.769
Significant levels: *** .001; ** .05; * .01.
Table 3 is quite revealing. By comparing novice and expert users in G1.1, it becomes apparent that these groups perceive the usability of the software service
Novices (1) accessibility (1) G2.1 difficult to use (1), privacy (1), difficult to (3) learn (1) accessibility (2), ease of learning (1), notes (5) (1), usefulness (1) G2.2 design improvements (1), difficult to use (2), (7) functionality missing (1), highlighting (2), mobile view (1) Experts accessibility (3), ease of learning (1), ease of (5) use (1) G2.1 (2) highlighting (1), loading-time (1) accessibility (15), usefulness (9), ease of use (8), ease of learning (5), highlighting (3), (46) well-designed (3), mature (1), navigation (1), notes (1) G2.2 functionality missing (5), difficult to learn (3), design improvements (2), difficult to use (14) (1), highlighting (1), notes (1), wording of messages (1) Note: positive, negative; numbers of mentions in brackets
Again, the qualitative analysis was supplemented with a think aloud evaluation. This time only eight students from two different schools were recruited because in G1 six students proved to be sufficient to detect all problems. This observation was replicated in G2. Moreover, the think aloud analysis confirmed the findings of the questionnaire-based evaluation to a large extent for both the positive and the negative results. Difficulties were identified in the navigation and the application was challenging to learn, especially with regard to the highlighting and note functionalities. Once more, the think aloud evaluation provided a significantly deeper problem analysis as compared to the questionnaire. Particular examples in this context are usability issues related to the highlighting functionality and the navigation. Based on these in-depth problem analyses, concrete suggestions for remedying the flaws could be made. For example, it became apparent that
120
visibility of the options chosen at the highlighting navigation bar requires improvement. Quantitative results. As described in Chapter 3, the G2 tests examined the reader, the registration, and the management of the digital bookshelf. G2.1 shows a similar picture as G1.1 (see Figure 3 and 4). Novices still have usability problems although the improved reader evaluated in G1.2 was tested. This time, however, all principles exceeded the value of 3 which was not reached in G1.1. Experts on the other hand do not have such problems and ERR is also perceived better than in G1.1. Compared to G1.1, the usability of the software service is perceived a bit poorer regarding the DESC, ERR, and LEARN principles. In G2.2, after further improvements of the software service again resulting from the qualitative data analysis, novices and experts assessed the system’s usability as better (see Figure 4). However, for novices usability did not reach the level it had in G1.2 which means that most values are lower and that there is still room for improvement. In the experts group, G2.2 showed the highest values apart from the principle LEARN. However, LEARN reached a value above 4.5. Three of the aforementioned increases in usability perception are significant (see Table 5). NOVICES
EXPERTS G2.1
G2.2
Figure 4. Comparison G2 Table 5. Comparison G2 G2.1(1) TASK 3.505 DESC 3.261 CONF 3.527 ERR 3.430 LEARN 3.474 (1) (2)
Novices G2.2(1) Z p(2) G2.1(1) 4.075 -1.490 4.388 3.861 -.2.304 * 4.062 3.731 -0.784 4.313 3.572 -0.552 3.983 3.947 -1.234 4.129
Experts G2.2(1) Z p(2) 4.442 -0.908 4.168 -1.027 4.459 -1.485 4.388 -2.587 ** 4.528 -1.790 *
Mean value indices of the principles in G2.1 and G2.2 (Likert scale: 1=strongly disagree to 5=strongly agree) Significant levels: *** .001; ** .05; * .01
Overall, Table 6 suggests that the usability of the software service is perceived differently from novices and experts on three principles. In particular, CONF, ERR, and LEARN principles were rated low. Thus, the software service in the current stage is not satisfying for novices. Table 6. Comparison novices and experts TASK DESC CONF ERR LEARN (1)
G2.1 Z p(1) -2.592 ** -3.144 *** -2.698 ** -1.800 * -1.879 *
G2.2 Z p(1) -1.491 -1.617 -3.394 *** -3.437 *** -2.190 **
Significant levels: *** .001; ** .05; * .01
5. Discussion and conclusion At this time two generations of usability tests using different evaluation methods were carried out and led to the software service’s current version. Since research suggests that data from the end users’ actual usage is superior [30] all applied tests obtained feedback from end users. Furthermore, we considered users’ technology expertise as suggested by previous research [7] in order to gain deeper insights [8]. Besides confirmation of the system’s usefulness or its ease of learning we detected a wide array of minor weaknesses and major defects by analyzing the qualitative data. This allowed us to eliminate them and improve the software service. By applying the ISO 9241-10 questionnaire developed by Prümper and Anft [38], we were able to confirm that our enhancements between the tests were successful with higher usability ratings in the retests. In line with Nielsen’s findings [31], we also observed a few slightly lower usability values when testing the modified software service. However, the decreases were not significant. Thus, our first research question can be answered in the affirmative because our results demonstrate that this combination of measurement methods is a valuable instrument mix to evaluate usability and to guide the design and improvement of developing a large-scale software service for digital textbooks. Moreover, the repeated testing of several parts of the IT artifact (see generation tests) allows detecting problems more precisely. So, it is possible to receive feedback on all different components or – as we have done it – only on added components or tasks which need to be evaluated step by step. In the attempt to answer the second research question, several observations were made. Our study suggests that a combination of (qualitative and quantitative) methods is effective which also supports prior research [e.g. 2, 21, 29].
121
Looking at the qualitative methods, the think aloud approach proved useful in identifying concrete hints while the open-ended questions in the questionnaire provided a wider range of information although less detailed. With regard to the comment fields offered in the questionnaire, our analysis revealed that it is better to specifically ask what the user liked or disliked about the software service instead of asking for a comment on each usability principle. So, it is highly recommended to use the wording “What did you especially like when using …?” and “What did you especially dislike when using …?” since such questions evoked three times more remarks in our study than the comment version. Since there were some overlaps between the two qualitative methods (i.e. think aloud and open-ended questions), especially with regard to the “like/dislike” version of open-ended questions, it is suggested that such open-ended questions should be applied in case of budget restrictions since this method is very costefficient. In addition, future studies should include also the following question after users experienced the software service: “Is there anything that is still missing or should be improved?”. Due to the fact that it might be too difficult or expensive to resolve all identified problems immediately, severity rankings could be provided next to the “like/dislike” comment fields in order to fix the most severe problems first taking into account that several hundred remarks may come up. Nielsen [51] already suggested to rate severity in heuristic usability evaluations. However, other methods could make use of such rankings as well. Coming now to the quantitative methods, our study showed that they provide quick feedback on the usability of the system. Indeed, we even propose an extension of the ISO 9241-10 questionnaire by including users’ satisfaction, perceived usefulness, and continuous usage intention to gather even further information since it is possible that a system working without problems will not be adopted by users when its usefulness is questioned. The “like” comments, though, showed that this is not the case for our software service. Finally, the third research question concerned differences of usability flaws of users with different technology expertise. In agreement with findings obtained previously [6], we have seen that novice users evaluate usability differently, thus, they have more usability problems than expert users. However, the usability tests generating qualitative data showed that it is difficult for novice users to describe their problems. They give fewer comments which are not very precise and valuable. For this reason, research has to mainly rely on the comprehensive comments of expert users when improving a system. Nonetheless, novice users benefit even more from the elimination of identified problems which resulted in significant improvements of usability
ratings in our study. In G1.2, for instance, usability ratings were not significantly different between novice and expert users (see Table 3). In comparison, column G2.2 in Table 6 reveals that the usability perception of novices is significantly poorer. This indicates that the software service needs further enhancements in order to achieve a satisfactory design also for novice users. For experts, the systems’ usability is already sufficient. Due to this fact, further work entails to make amendments and to replicate evaluation tests afterwards since we need to be more confident that all flaws of the software are eliminated. The goal of the improvement is that the software service is as easy to use for novices as for experts, meaning that in further tests no significant differences between these groups exist. Hence, the distinction between the two types of users (i.e. novices and experts) is a valuable source for better designs providing a deeper understanding of the needs of these diverse user groups [8]. To conclude with, the following list provides several tips for practitioners to design more usable systems: Use a combination of usability tests and in case of tight budgets a questionnaire including closed and open-ended questions. Recruit novice and expert users to evaluate your system. Apply an iterative design and improve your system until the usability measures reach a satisfactory level for all users.
6. References [1] JISC, "Preparing for Effective Adoption and Use of Ebooks in Education", http://blog.observatory.jisc.ac.uk/techwatch-reports/ ebooks-in-education/, accessed 30.05.2016. [2] Siegenthaler, E., et al., "Improving the Usability of E-Book Readers", Journal of Usability Studies, 6(1), 2010, pp. 25-38. [3] Krug, S., Don't Make Me Think: Web Usability: Das Intuitive Web, MITP, 3 edn, Bonn, 2014. [4] Sarodnick, F. and Brau, H., Methoden Der Usability Evaluation: Wissenschaftliche Grundlagen Und Praktische Anwendung, Huber, 2006. [5] Shneiderman, B., "Universal Usability", Communications of the ACM, 43(5), 2000, pp. 84-91. [6] Faulkner, L. and Wick, D., "Cross-User Analysis: Benefits of Skill Level Comparison in Usability Testing", Interacting with computers, 17(6), 2005, pp. 773-786. [7] Goonetilleke, R.S., et al., "Effects of Training and Representational Characteristics in Icon Design", International Journal of Human-Computer Studies, 55(5), 2001, pp. 741-760. [8] Dillon, A. and Song, M., "An Empirical Comparison of the Usability for Novice and Expert Searchers of a Textual and a Graphic Interface to an Art-Resource Database", Journal of Digital Information, 1(1), 1997, pp. 33-42. [9] Liu, Y., et al., "Considering the Importance of User Profiles in Interface Design", in Mátrai: User Interfaces, INTECH, Rijeka, Croatia, 2010, pp. 61-80.
122
[10] Gregor, S. and Hevner, A.R., "Positioning and Presenting Design Science Research for Maximum Impact", Mis Quarterly, 37(2), 2013, pp. 337-355. [11] Peffers, K., et al., "A Design Science Research Methodology for Information Systems Research", Journal of management information systems, 24(3), 2007, pp. 45-77. [12] Adipat, B., et al., "The Effects of Tree-View Based Presentation Adaptation on Mobile Web Browsing", Mis Quarterly, 35(1), 2011, pp. 99-122. [13] Hevner, A.R., "A Three Cycle View of Design Science Research", Scandinavian journal of information systems, 19(2), 2007, pp. 4. [14] Park, C.-S., et al., "Design and Implementation of a ProblemBased Digital Textbook", International Journal of Software Engineering and Its Applications, 6(4), 2012, pp. 213-222. [15] Yi, W., et al., "E-Book Readability, Comprehensibility and Satisfaction", in Editor: Book E-Book Readability, Comprehensibility and Satisfaction, ACM, 2011, pp. 38. [16] Chong, P.F., et al., "On the Design Preferences for Ebooks", IETE Technical Review, 26(3), 2009, pp. 213-222. [17] Gingras, L., et al., "Comparative Analysis of E-Readers", University of Michigan, http://www.leannagingras.com/ comparative-analysis.pdf, accessed 31.05.2016. [18] Jardina, J.R. and Chaparro, B.S., "Investigating the Usability of E-Textbooks Using the Technique for Human Error Assessment", Journal of Usability Studies, 10(4), 2015, pp. 140159. [19] Thong, J.Y., et al., "Understanding User Acceptance of Digital Libraries: What Are the Roles of Interface Characteristics, Organizational Context, and Individual Differences?", International Journal of Human-Computer Studies, 57(3), 2002, pp. 215-242. [20] Tsakonas, G. and Papatheodorou, C., "Exploring Usefulness and Usability in the Evaluation of Open Access Digital Libraries", Information Processing & Management, 44(3), 2008, pp. 12341250. [21] Lim, C., et al., "Improving the Usability of the User Interface for a Digital Textbook Platform for Elementary-School Students", Educational Technology Research and Development, 60(1), 2012, pp. 159-173. [22] Dix, A., Human-Computer Interaction, Springer, 2009. [23] Hom, J., "The Usability Methods Toolbox Handbook", http://usability.jameshom.com/, accessed 20.05.2016. [24] Bowman, D.A., et al., "A Survey of Usability Evaluation in Virtual Environments: Classification and Comparison of Methods", Presence, 11(4), 2002, pp. 404-424. [25] Holzinger, A., "Usability Engineering Methods for Software Developers", Communications of the ACM, 48(1), 2005, pp. 7174. [26] Nielsen, J., "Heuristic Evaluation", Usability inspection methods, 17(1), 1994, pp. 25-62. [27] Bias, R., "Interface-Walkthroughs: Efficient Collaborative Testing", Software, IEEE, 8(5), 1991, pp. 94-95. [28] Jick, T.D., "Mixing Qualitative and Quantitative Methods: Triangulation in Action", Administrative science quarterly, 1979, pp. 602-611. [29] Field, A., Discovering Statistics Using SPSS, SAGE, 3 edn, Los Angeles, Calif. [u.a.] 2009. [30] Gould, J.D. and Lewis, C., "Designing for Usability: Key Principles and What Designers Think", Communications of the
ACM, 28(3), 1985, pp. 300-311. [31] Nielsen, J., "Iterative User-Interface Design", Computer, 26(11), 1993, pp. 32-41. [32] Nielsen, J., "Let's Ask the Users [User Interfaces]", Software, IEEE, 14(3), 1997, pp. 110-111. [33] Karat, C.-M., et al., "Comparison of Empirical Testing and Walkthrough Methods in User Interface Evaluation", Proceedings of the SIGCHI conference on Human factors in computing systems, 1992, pp. 397-404. [34] Kotler, P. and Armstrong, G., Principles of Marketing, pearson education, 2010. [35] Demetriou, N., et al., "The Development of the Open Acs Community", Open source for knowledge and learning management: Strategies beyond tools, 2006, pp. 298. [36] Beimborn, D., et al., "Platform as a Service (Paas)", Business & Information Systems Engineering, 3(6), 2011, pp. 381-384. [37] IMS Global, "IMS Global Learning Tools Interoperability® Implementation Guide Version 1.2", http://www.imsglobal.org/ lti/ltiv1p2/ltiIMGv1p2.html, accessed 10.05.2016. [38] Prümper, J. and Anft, M., "Beurteilung von Software auf Grundlage der Internationalen Ergonomie-Norm ISO 9241/10", in Rödiger: Software-Ergonomie ’93, Vieweg+Teubner Verlag, Stuttgart, 1993, pp. 145-156. [39] Prümper, J., "Der Benutzungsfragebogen ISONORM 9241/10: Ergebnisse zur Reliabilität und Validität", in Liskowsky, Velichkovsky, and Wünschmann: Software-Ergonomie’97, Vieweg+Teubner Verlag, Stuttgart, 1997, pp. 253-262. [40] Bräutigam, L., "Beurteilung der Software-Ergonomie anhand des ISONORM-Fragebogens", http://www.ergoonline.de/site.aspx?url=html/software/verfahren_zur_beurteilung _der/beurteilung_der_software_ergo.htm, accessed 11.05.2016. [41] Klees, G. and Tillmann, A., "Design-Based Research als Forschungsansatz in der Fachdidaktik Biologie", Journal für Didaktik der Biowissenschaften, 6, 2015, pp. 91-110. [42] Stiller, K.D. and Bachmaier, R., "NiceDesign4SME: A Video-Based Online Training Course", EdMedia: World Conference on Educational Media and Technology, 2014, pp. 373-383. [43] Novak, T.P., et al., "Measuring the Customer Experience in Online Environments: A Structural Modeling Approach", Marketing science, 19(1), 2000, pp. 22-42. [44] Wang, W.-T. and Wang, C.-C., "An Empirical Study of Instructor Adoption of Web-Based Learning Systems", Computers & Education, 53(3), 2009, pp. 761-774. [45] Mayring, P., Qualitative Inhaltsanalyse - Grundlagen und Techniken, Beltz, 11th edn, Weinheim/Basel, 2010. [46] Macqueen, K.M. and Guest, G., Handbook for Team-Based Qualitative Research, Altamira Press, Plymouth, UK, 2008. [47] Nunnally, J. and Bernstein, I., Psychometric Theory, McGraw-Hill, 3rd edn, New York, 1994. [48] Mazanec, J.A., "TRN2009", http://www.wu.ac.at/ itf/downloads/software/trn32, accessed 20.01.2012. [49] Mazanec, J.A. and Strasser, H., A Nonparametric Approach to Perceptions-Based Market Segmentation: Foundations, Springer, Vienna-New York, 2000. [50] Lemon, J., "Plotrix: A Package in the Red Light District of R", R-News, 6(4), 2006, pp. 8-12. [51] Nielsen, J., "Severity Ratings for Usability Problems", Papers and Essays, 54, 1995, pp. 1-2.
123