Runtime Verification in Context : Can Optimizing Error Detection Improve Fault Diagnosis? Matthew B. Dwyer1 , Rahul Purandare1 , and Suzette Person2 1
Department of Computer Science and Engineering, University of Nebraska, Lincoln NE 68588-0115, USA. {dwyer,rpuranda}@cse.unl.edu 2 NASA Langley Research Center, Hampton, VA 23681, USA.
[email protected]
Abstract. Runtime verification has primarily been developed and evaluated as a means of enriching the software testing process. While many researchers have pointed to its potential applicability in online approaches to software fault tolerance, there has been a dearth of work exploring the details of how that might be accomplished. In this paper, we describe how a component-oriented approach to software health management exposes the connections between program execution, error detection, fault diagnosis, and recovery. We identify both research challenges and opportunities in exploiting those connections. Specifically, we describe how recent approaches to reducing the overhead of runtime monitoring aimed at error detection might be adapted to reduce the overhead and improve the effectiveness of fault diagnosis.
1
Introduction
The past decade has witnessed a growing interest in relating program executions to rich correctness properties as a way to increase the observability of software system behavior and thereby enhance the software testing process. The foundations of runtime verification have been well established. Researchers have developed sophisticated specification notations for expressing properties to be checked at runtime, e.g., [1, 2], devised techniques for synthesizing efficient monitors to check those properties, e.g., [3], and produced powerful frameworks that allow monitors to be incorporated into programs, e.g., [4, 5]. Early runtime verification systems, e.g., UPenn’s MaC [2] and NASA’s Java Path Explorer [6], focused on using monitoring to enhance program testing. While enhanced test oracles offer significant value, it seems clear that even in the early years of research on runtime verification, researchers envisioned using it in a broader context. For example, the authors of both the MaC and Java Path Explorer papers identify exploring monitoring in a broader context as future work in stating “Our current system is geared towards the detection of faults. It would be desirable in the future to build monitors that can steer a system to a correct state.” [2] and asking “How can missions be made safer in the face of errors occurring during flight that survived tests?” [6]. Research towards those goals has been modest, at least in part because it is a very difficult challenge. In recent years, however, there has been a concerted effort to understand how one might construct software health management (SHM) subsystems [7].
Building on decades of work in systems and vehicle health management, SHM seeks to accommodate the nature of software faults, e.g., that arise as discontinuities relative to their input domain, and provide an overall framework into which different error detection, fault diagnosis, and recovery techniques can be incorporated to achieve greater tolerance to software errors in fielded systems. We believe that the broader context of SHM provides a number of significant challenges and opportunities for the runtime verification research community, which has focused primarily on error detection techniques. More specifically, we believe there is a need to consider the connections between error detection and other elements of SHM solutions. In this paper, we consider one such connection, between error detection and fault diagnosis, in light of recent efforts to mitigate the runtime overhead of error detection. One of the key challenges to widespread use of runtime verification, especially monitoring of rich properties, i.e., monitors that check non-trivial predicates over program data state and monitors that reason about sequences of program states, is runtime overhead. Recent studies of the performance of state-of-the-art algorithms for monitoring typestate properties [8] on Java program executions [5, 9, 10] have revealed rather bimodal findings in terms of performance; for many combinations of programs and properties, the overhead is negligible– less than 5% –but there are combinations that incur significant overhead– more than 100%. Monitor overhead is determined by a number of factors: the number of program locations that must be observed, the extent to which different data values require the need for multiple copies of a monitor, and the cost of updating monitor state and checking for violations. In the case of monitoring a typestate property, i.e., using a finite-state automaton (FSA) that expresses constraints on the legal ordering of operations called on an instance of a given type, monitoring can incur significant overhead. For example, to monitor the HasNext property on the bloat benchmark, one of the DaCapo benchmarks [11] that was studied in [5], over 211 million operations, spread across one million iterator instances, are processed during monitoring. Given such a large overhead to monitor a single property, work to optimize this type of property monitor is needed and has become an active area of research in recent years, e.g., [10, 12]. The results thus far are quite promising, however, in all of the work to date, there is no consideration of how optimization might impact the broader context in which the monitor is deployed. For example, both error detection and fault diagnosis must observe program behavior. How are those observations related to one another? Can optimizing error detection also optimize fault diagnosis? Will such optimization preserve the information needed by fault diagnosis? In this paper, we begin to explore some of these questions, and more broadly, to consider the connections that arise from considering runtime verification in an SHM context. Our study offers some insights into how those connections might be exploited to produce better SHM systems, and suggests principles that must be observed when designing an error detection techniques for SHM. The paper is organized as follows. Section 3 describes one recent strategy for optimizing runtime monitors for typestate properties and describes the property preservation requirements developed for that optimization. Section 4 considers the impact of
Detection …
Σ
!" D Recovery
{t,f} Diagnosis
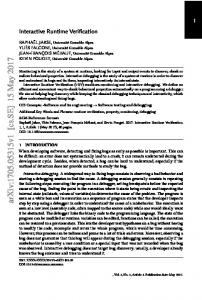
Fig. 1: Conceptual architecture for software health management.
applying that optimization strategy on three techniques for online fault diagnosis that have been proposed recently. We present, in Section 5, a series of research challenges and opportunities related to how runtime verification fits into SHM solutions that we believe the research community is well-positioned to advance in the near future. We begin with a discussion of existing research that forms the background for our study.
2
Background and Related Work
We provide background on the application of runtime monitoring for error detection, survey approaches to software health management, and outline a few recent approaches to software fault localization. 2.1
Runtime Monitoring for Error Detection
Monitoring the execution of a software system might be performed for a variety of reasons, e.g., to assess performance, to enforce security policies, or to provide test coverage information. The runtime verification community has focused, primarily, on monitoring the conformance of program executions relative to a formally specified correctness property. This type of monitoring can extend the set of errors that can be observed during system execution compared to a traditional test oracle which evaluates predicates on output values. Moreover, since such monitors typically observe the internal state of a software system they are capable of detecting errors before they give rise to system-level failures, such as outputting an incorrect value. The top portion of Figure 1 depicts the relationship between a program, P , and an error detection capability realized through runtime monitoring. A set of correctness properties, φi , are defined and those properties together define the set of observations of program behavior that is necessary to make judgments about the satisfaction or falsification of each of the φi ; this set is denoted Σ–the alphabet of program observations.
P
Pφ
P’ φ
Monitor
Monitor
Fig. 2: Monitor instrumentation and optimization.
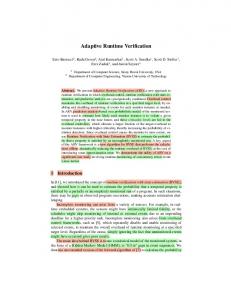
As the program executes, it reaches locations at which an observation, or symbol, in Σ is generated and that observation is communicated to the monitor associated with each property. Each monitor tracks the sequence of observations and renders a boolean judgment about the conformance of the program execution with respect to its property. This conceptual architecture for monitoring can be instantiated using a wide range of property monitoring approaches. For example, monitoring assertion properties relies on observations that query the data state of the program. In this case, a single observation is all that is required to render a judgment of ¬φ, and if all observations satisfy φ then a satisfying judgment is produced on program exit. Monitoring temporal or sequencing properties relies on observation of a set of program locations along with data values, e.g., indications of calls and returns to methods of a given class coupled with the identity of the receiver object. For such properties, the processing of an observation updates the monitor state and judgments are rendered when an object’s lifetime ends or the property enters a trap state, i.e., a state for which no subsequent observations can prevent the property from being falsified. The identification of observations during program execution and their communication to the property monitor can be achieved in a variety of ways. In recent years, the runtime verification community appears to have converged on the use of program instrumentation, realized by sophisticated aspect weaving technologies, as being a particularly effective means of integrating the generation of observations into programs [4, 13]. To illustrate, consider the three versions of program P shown in Figure 2. On the left is the original, uninstrumented, version of P . In the middle is Pφ , an instrumented version of P that produces observations relevant to φ. We discuss the rightmost version in Section 3. When the instrumentation in Pφ is executed, sophisticated data structures are used to route observations [5] to monitors that are synthesized from high-level property specifications [3, 14]. This monitoring code is incorporated in the deployed program, e.g., as the added module shown at the bottom of Figure 2, so that it can be invoked as needed during runtime. 2.2
Software Health Management
For at least three decades, there has been a recognition that the challenges of constructing correct software are so significant that deployed systems will contain faults and that cost-effective techniques for tolerating faults at runtime would be extremely valuable.
Many techniques have been proposed, but no technique has emerged as one that can be widely applied in practice–some techniques have been shown to be ineffective [15, 16]. More recently, forms of software fault tolerance have been explored under the names autonomic, recovery-oriented, failure-oblivious, self-healing, self-adaptive and re-configurable systems. Even more recently, the term software health management (SHM) has emerged in the safety-critical systems community and we adopt that term here to encompass the general class of software fault tolerance approaches. Rather than surveying the significant literature in these areas, we present, in Figure 1, a conceptual architecture for SHM that includes three capabilities that are incorporated into the subject program: error detection, fault diagnosis, and system recovery. As described above, as program P executes it is monitored for properties, φi . Runtime monitoring detects property violations, i.e., errors, that indicate a potential need for system recovery. In an SHM solution, error detection communicates the identity of the violated property to a fault diagnosis capability. Fault diagnosis is a very different problem than error detection. Its goal is to identify the system component whose behavior initiated the erroneous behavior that was ultimately detected–the faulty component. Information from the faulty component may be separated both temporally and structurally within the code from the component that exhibited the error. Consequently, additional diagnostic information, D, is recorded during program execution to aid fault diagnosis. While Σ and D may overlap or be generated from common locations in the program, that need not be the case. Once diagnosis completes, it passes an indication of the faulty component(s) to the recovery capability which may reconfigure, restart, remove or replace those component(s). This architecture can be instantiated in a wide variety of ways. For example, the Pinpoint system [17] provides for SHM of web-services by instrumenting portions of the service implementations and J2EE infrastructure to capture data for error detection and fault diagnosis, which then triggers rather rudimentary component reboot for recovery [18]. Other approaches skip fault diagnosis altogether [19, 20] and instead simply repair data structures at the point of failure as a means of recovering from immediate system failure. The FLORA [21] system allows an application to be refactored into isolated recovery units that are rebootable, and allows different error detection and fault diagnosis approaches to be incorporated–we discuss one such approach below. None of these solutions seems appropriate in a safety-critical context. For such systems, SHM approaches are typically much more integral to overall system development and are not regarded as an add on. Approaches like [22] take a holistic approach and consider the possibility that faults might also exist within detection, diagnosis, and recovery algorithms–their approach is to prove those algorithms correct. Researchers and developers will undoubtedly continue to evolve SHM solutions from individual application domains to more general settings, from coping with individual types of of faults to broad classes of faults, and between different levels of criticality. As they do, there will be opportunities for results from runtime verification to be incorporated as long as those results are designed to fit into the broader SHM context.
2.3
Software Fault Localization
Over the past decade, the software engineering research community has developed a rich literature on techniques for identifying the root cause of a program failure, i.e., the fault. Most of the techniques that have been developed are intended to support human developers by narrowing their attention to parts of the program that are more likely to be faulty. In doing this, they may produce a ranking of program elements, e.g., statements, methods, classes, from most likely to be faulty to least likely. A developer starts at the top of the list and works their way down and, if the localization technique is effective, they save time in finding the fault and can then proceed with fixing it. In recent years, several researchers have investigated the adaptation of fault localization techniques to online fault diagnosis. While many different fault localization approaches might be used for this purpose, here we describe two classes of approaches that use very different types of recorded information. Spectrum-based fault localization [23]. This technique records information about which system components are executed during a run of the system. This information is captured prior to deployment as the system undergoes its final round of testing. The information recorded includes the coverage or execution frequency of each component. Let the set of system components be c1 , . . . , cm , then the hit spectrum, hs, is an array of m values drawn from {0, 1} where hs[i] = 1 indicates that component ci was executed in a program run. The count spectrum, cs, is an array of m natural numbers where cs[i] indicates the number of times component ci was executed in a program run. Rather than accumulate this information across a test suite, as is done in test adequacy calculations, the spectra are stored for each of n runs thereby forming an n × m activity matrix. An additional row stores a boolean value indicating whether an error was detected during the run. Studies have shown that spectrum-based on-line fault localization can narrow the location of a fault to a set of components comprising between 10% and 25% of the system components across a range of software systems with injected faults [24, 25]. The system achieves good localization performance when given spectra for at least 10 error-free executions, and, surprisingly, without spectra for runs with errors the technique is able to eliminate 75% of the components from consideration. For these reasons, in recent work, spectrum-based fault localization has been incorporated as an on-line diagnosis technique in the FLORA system [26]. Sequence-based fault localization [27]. This technique records information about the order in which system components are executed during a run of the system. Intuitively, this technique should provide richer information when compared with spectra, which are order-independent, and the study presented in [27] confirms this intuition at least with respect to hit spectra. It can be very costly to record the entire component execution sequence for any given program run. Consequently, the approach of Dallmeier et al. [27] uses several techniques to reduce the cost of capturing and storing sequence information. The most aggressive technique stores all sub-sequences of component invocations of length k. This results in the recording of a sequence set for each program run.
As with spectrum-based localization, sequence sets are accumulated for both erroneous and error-free runs. The sequence sets for a set of runs are processed to produce a ranking of components – from most likely to be faulty to least likely. A case study applied sequence-based localization to multiple faulty versions of a non-trivial software system with k = 8. They explored varying numbers of error-free runs together with a single error run. The faulty component was ranked first 36% of the time and in the top two 47% of the time. On average, the faulty component fell in the top 21% of the ranking which is comparable to the accuracy achieved by spectrum-based diagnosis.
3
Optimizing Monitor Overhead
We begin with some definitions that will permit us to explain monitor optimization in sufficient detail. For the purposes of illustration, we discuss monitoring of properties expressed as deterministic finite state automaton (FSA) [28]. An FSA is a tuple φ = (S, Σ, s0 , δ, A) where: S is a set of states, Σ is an alphabet of symbols that encode program observations, s0 ∈ S is the initial state, δ : S × Σ → S is the state transition function, and A ⊆ S are the accepting states. We use ∆ : S × Σ + → S to define the composite state transition for a sequence of symbols from Σ; we refer to such a sequence as a trace and denote it π. We lift the transition function from traces to sets of traces, Π, and define ∆(s, Π) = {s0 |∃π ∈ Π : ∆(s, π) = s0 }3 , i.e., the set of states reached from s via any trace in Π. We define an error state as err ∈ S such that ¬∃π ∈ Σ ∗ : ∆(err, π) ∈ A. A property defines a language L(φ) = {π | π ∈ Σ ∗ ∧ ∆(s0 , π) ∈ A}. FSA monitoring generally involves instrumenting a program to detect each occurrence of an observation, a ∈ Σ. A simple runtime monitor stores the current state, sc ∈ S, which is initially s0 , and at each occurrence of an observation a, it updates the state to sc = δ(sc , a) to track the progress of the FSA in recognizing the trace of the program execution. We say that a program execution violates a property, φ, if the generated trace, π, ends in a non-accepting state, i.e., ∆(s0 , π) 6∈ A; violations can be detected as soon as the monitor enters an error state, i.e., sc = err. 3.1
Monitor Correctness
Definition 1 (Monitor Correctness for Error Detection). A runtime monitor for property φ observing execution trace π is sound if it reports a violation if π 6∈ L(φ), and complete if it reports a violation only if π 6∈ L(φ). A runtime monitor is correct in the context of error detection if and only if it is sound and complete. Soundness guarantees that no observed violation will be missed, whereas completeness guarantees that false reports of violations will not occur. We note in the context of error detection systems soundness is associated with the absence of false negatives. In other words, an error detection system is sound if and only if not reporting an error means the absence of errors in the system [29]. For runtime monitoring, the notions of 3
∆ inside the set comprehension corresponds to the composite state transition for a sequence of symbols from Σ.
soundness and completeness are relative to the trace generated by observations of program behavior. In general, runtime monitoring would be complete, but unsound since it is impractical to observe all program behavior. Hence, soundness in Definition 1 is defined relative to just the observed behavior. While it might seem obvious to require sound and complete monitoring, this requirement can incur greater overhead than approaches that sacrifice one or the other. For example, researchers have explored a variety of sampling techniques that assure completeness of monitoring [30–32], but sacrifice soundness. This means that there may exist a trace of the program that violates φ, but no error is reported. The advantage of sacrificing soundness is the potential to maintain very low-levels of runtime overhead, e.g., below 10%. When using runtime monitoring for the purpose of error detection, i.e., to enrich existing test oracles, such a tradeoff may be appropriate however, sacrificing soundness is undesirable when monitoring is used in the context of SHM. 3.2
Transforming Loops to Optimize Monitoring
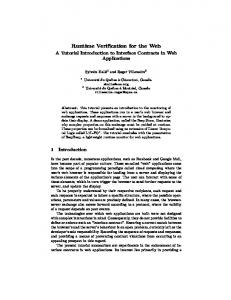
Over the past several years several researchers explored approaches to statically optimizing the overhead of runtime monitoring [9, 10, 12, 33]. In principle, these techniques work much like compiler optimizations. They first perform static analyses to calculate information about how a program and property relate to each other. Then, as depicted on the right side of Figure 2, they use the results of those analyses to eliminate or modify monitor-related instrumentation within the program, to produce Pφ0 , so as to reduce its runtime cost. To illustrate how such optimizations interact with online fault diagnosis techniques, we provide a brief overview of the optimization described in [12]. This optimization targets loops that involve observations related to a property being monitored. The goal of the analysis is to determine whether the loop’s iteration space, i.e., the series of executions of a loop’s body that arise when executing a loop, can be partitioned into a prefix and a suffix as follows. The loop prefix is comprised of a fixed number of iterations, such that after monitoring the observations in those iterations the property monitor is guaranteed to reach a common state regardless of the monitor state on entry to the loop. More formally, if π is a non-empty regular expression encoding all possible sequences of observations in a single loop iteration and d is the number of iterations in the prefix, then the loop is said to stutter at distance d for property φ if ∀s ∈ S : ∀s0 ∈ ∆(s, π d ) : ∆(s0 , π) = {s0 } We have found that for many properties and programs, the minimum stutter distance is 1. This means that only a single iteration of the loop must be monitored. Instrumentation related to property monitoring can be eliminated from the loop suffix. Consequently, monitoring a loop for a property defined as an FSA requires only constant overhead – the overhead does not vary with the number of iterations of the loop. As an example, we consider the property StartStart described by the FSA in Figure 3. This property states that “on a stopwatch, do not call start twice without calling stop in between” [9]. The snippet of code in Figure 4 resembles the code in class FFT
stop
start
start
err
1
S
Start, stop
stop
Fig. 3: Property StartStart.
i n t b = 0; while ( b < n ) { ... sw . s t a r t ( ) ∗ ; ... sw . s t o p ( ) ∗ ; ... } sw . r e s e t ( ) ;
i n t b = 0; while ( b < n ) { ... sw . s t a r t ( ) ∗ ; ... sw . s t o p ( ) ∗ ; ... break ; } while ( b < n ) { ... sw . s t a r t ( ) ; ... sw . s t o p ( ) ; ... } sw . r e s e t ( ) ;
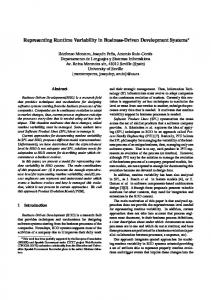
Fig. 4: Example from SciMark 2.0 FFT: original (left) and optimized (right)
from the benchmark SciMark 2.0 [34]. The optimization described above transforms the code as shown in Figure 3. This loop stutters at unit distance, and only the first iteration of the loop needs to be monitored. The instrumented statements are marked by an asterisk in the figure, which shows that observable statements only in the predecessor loop are monitored. If during the program execution the original loop is required to be executed k times before exiting it, the monitor optimized using this technique will only observe 2 events instead of 2*k that will be observed by an unoptimized monitor. In evaluating this optimization, we have found that it can yield significant reductions in runtime overhead. For example, for the Bloat DaCapo [11] benchmark and a property that requires the strict alternation of hasNext() and next() calls on iterators the number of observations that require processing is reduced by two orders of magnitude which yields a factor of 4 reduction in runtime overhead. This significant optimization benefit comes at no cost to the quality of error detection when monitoring since, for programs that are free of certain forms of uncaught unchecked exceptions,
the optimized monitors are guaranteed to preserve both soundness and completeness provided the corresponding unoptimized monitor preserves them. Optimization of monitoring must preserve the correctness of the original monitor. Definition 2 (Correctness of Monitor Optimization for Error Detection). A runtime monitor M 0 for property φ, is correctly optimized with respect to an unoptimized runtime monitor M for error detection if and only if for every trace π that would have been observed by M , it observes π 0 , where |π 0 | ≤ |π| and M 0 reports a violation for π 0 if and only if M would have reported a violation for π. 3.3
Preserving Diagnostic Information
In the context of SHM, one must consider the possibility that the optimization of error detection impacts the information collected for fault diagnosis. If Σ and D, from Figure 1, are completely distinct then there is no danger that optimizing error detection will impact fault diagnosis. In general, we expect that these two information sources may overlap, Σ ∩D 6= ∅. For example, the set of observations for error detection of typestate properties are exactly what are needed to form sequence sets for the fault localization in [27]. While it may be permissible for optimization to degrade D in some way without impacting the output of fault diagnosis, we define a more conservative property here that suffices as long as fault diagnosis is deterministic relative to its input. Definition 3 (Diagnostic Information Preservation of Monitor Optimization for Error Detection). An optimized runtime monitor M 0 for property φ, preserves diagnostic information, D, relative to an unoptimized runtime monitor M , if for every trace π that would have been observed by M , M 0 observes π 0 , and D ∩ π = D ∩ π 0 .
4
Adapting Monitor Optimization to Diagnosis
Overhead and resource constraints are important considerations when designing runtime monitors. These considerations are equally important when designing diagnosis capabilities. In this section, we consider the potential for adapting several optimization techniques for monitoring aimed at error detection to optimize the recording of information for diagnosis. Stutter-optimization and hit-spectra present a clear opportunity for optimizing the recording of diagnosis information. Recall that stutter-optimization clones a loop prefix which contains instrumentation to support error detection, and leaves an uninstrumented loop suffix. From a diagnosis point of view, the bodies of the loop prefix and suffix are identical. Loop execution will remain in the prefix until all of the behavior relevant to error detection is covered thereby computing a hit-spectra for the prefix. For all paths through the loop that involve error detection instrumentation, this prefix hit-spectra is guaranteed to be the hit-spectra for the original loop. Consequently, diagnosis related instrumentation that records hit-spectra from the loop suffix can be safely removed.
Stutter-optimization and count-spectra require diagnosis related instrumentation in the loop suffix be preserved. This is because each execution of a block of code that is relevant for diagnosis must be recorded, and there is no way to infer the length of the loop suffix from the analysis performed for stutter-optimization of error detection monitors. Stutter-optimization and sequence sets present a more subtle opportunity for optimizing the recording of diagnosis information. Recall that stutter-optimization preserves error detection whenever the prefix has at least a minimum stutter distance d. The optimization will instrument d iterations of the loop, i.e., the loop prefix, and on each iteration the non-empty string π is generated. The loop prefix is thus guaranteed to generate a sequence of at least length d ∗ |π|. Prefixes and suffixes of that sequence will be combined with sequences occurring before and after the loop. By setting the sequence length to k, one can apply stutter-optimization to a loop using a distance of max(d, dk/|π|e), which will ensure an adequate stutter distance and a sufficiently long sequence of symbols from the loop prefix to generate all k-length subsequences. Using this distance, the diagnosis related instrumentation in the loop suffix may be removed. In this section, we have seen that for hit spectra and sequence set based fault diagnosis, stutter-optimization of error detection is diagnostic information preserving.
5
Challenges and Opportunities
In this section, we identify challenges and opportunities in runtime monitoring that we believe to be worth exploring in the broader context of software health management. The connections that arise from runtime verification in this context not only provide new requirements for designing error detection techniques, but also create new opportunities to improve the efficiency and effectiveness of fault detection and diagnosis, and produce better SHM systems. Property Selection and Specification. One of the main reasons for using runtime monitors is to check properties that cannot easily be verified prior to deployment using static analysis techniques. While considerable progress has been made with respect to specification of rich correctness properties amenable to runtime monitoring, various challenges and opportunities remain in this area. For example, care must be taken in developing property specifications such that sufficient information is captured for both detection and diagnosis. For an expressive path-property, the property specification required for detection may suffice as an input for diagnosis; however, for a less expressive state-property the diagnosis module may require a more elaborate specification to correctly identify the faulty component(s). For example, when checking the state property divide-by-zero, in addition to the point where the error was detected, the diagnosis module may require a trace of instructions that generated, propagated and wrote a value of zero at the location of interest. This diagnosis can be very challenging due to arbitrarily large number of observations and real-time constraints.
Implicit Constraints. Property specifications form the primary requirements for runtime monitor operation; however, because monitors operate as a component of a larger system, checking properties of the system under observation, and interfacing with the diagnosis component, they are subject to implicit constraints resulting from constraints on the system and on the diagnosis component. Moreover, the nature of the system, e.g., highly-dependable, real-time, distributed, fault-tolerant, can also be a source of implicit constraints. For example, many of the systems being developed in the context of SHM are real-time embedded systems operating on precise schedules. This implies that the scheduling constraints must not be compromised by the addition of detection and diagnosis. For critical systems, one must also assure that the detection, diagnosis, and recovery implementations do not themselves introduce faults lest the overall dependability of the system be decreased. Placement of Observations. The points at which program behaviors are observed to detect property violations affect not only the efficiency and proper functioning of the error detection capability, but they can also affect the efficiency and effectiveness of the diagnosis component to accurately identify the faulty component(s). We suggest that a static analysis that is geared towards improving the efficiency of monitors and the effectiveness of diagnosis can be developed and employed in order to identify an appropriate set of program points for instrumentation. For example, there are many cases where the same instrumentation can be used to generate observations for error detection and diagnostic information. It may also be possible to coalesce data from multiple instrumentation points when it can be proved that error detection will not occur during some region of program execution, e.g., [33]. Clearly opportunities for piggybacking both observation and diagnostic data collection should be exploited. Exploiting Efficiency. If error detection and the collection of fault diagnosis information can be made more efficient, then the time gained might be exploited to gather alternate forms of diagnostic information that could improve diagnosis precision. The cost of error detection and the collection of fault diagnostics is spread throughout execution, but once an error is detected the system should execute recovery actions very quickly. This argues for minimizing the cost of executing diagnostic algorithms, which seems to run counter to the goal of making precise fault diagnoses. Here again efficiency improvements can be leveraged for improved diagnoses by shifting some diagnostic processing to the point at which diagnosis information is collected. This effectively amortizes diagnostic cost across the entire program execution, rather then concentrating it between error detection and recovery. Exploiting Diagnosis Algorithms. In our presentation, we adopted a conservative approach to optimizing error detection. With more information about the structure of diagnostic data and how a diagnosis algorithm processes that information it may be possible to achieve greater degrees of optimization of both error detection and of diagnostic data collection. For example, knowledge about redundancy of diagnostic data could be exploited. To illustrate, consider hit count spectra – one can easily optimize hit count data collection with removable instrumentation as has been done for test coverage data collection.
Predictive Error Detection. As discussed above the latency between error detection and recovery is a critical design constraint for SHM systems. One approach to relaxing this constraint is to shift error detection earlier in time. This can be achieved, for example, by migrating probes earlier in the code, e.g., the earliest point that is post-dominated by the original probe location, or by performing static analyses to calculate predicates on data values that when true guarantee that a path with probes leading to an error will be taken. This would allow a longer period of time for diagnosis to operate, and thereby produce a more precise result, or allow recovery to begin earlier. If an error is predicted long enough in advance, then program execution might be modified to avoid the failure thereby eliminating the need for recovery.
Acknowledgments The ideas in this paper have been influenced over the course of many wide-ranging conversations about dynamic analysis and monitor optimization with our colleague Sebastian Elbaum. We also thank our colleague Paul Miner for his helpful insights on software fault-tolerance and software health management. Finally, we thank Natasha Neogi who asked “What information is lost during monitor optimization?” during a talk we gave–her question inspired us to think more deeply about these issues. This work was supported in part by the National Science Foundation through awards CCF0747009 and CCF-0915526, the National Aeronautics and Space Administration under grant number NNX08AV20A, and the Air Force Office of Scientific Research through award FA9550-09-1-0129.
References 1. Barringer, H., Goldberg, A., Havelund, K., Sen, K.: Program monitoring with ltl in eagle. Parallel and Distributed Processing Symposium, International 17 (2004) 264b 2. Kim, M., Viswanathan, M., Ben-Abdallah, H., Kannan, S., Lee, I., Sokolsky, O.: Formally specified monitoring of temporal properties. In: Real-Time Systems, 1999. Proceedings of the 11th Euromicro Conference on. (1999) 114 –122 3. Havelund, K., Rou, G.: Synthesizing monitors for safety properties. In: Tools and Algorithms for the Construction and Analysis of Systems. Volume 2280 of Lecture Notes in Computer Science. Springer Berlin / Heidelberg (2002) 257–268 4. Avgustinov, P., Tibble, J., de Moor, O.: Making trace monitors feasible. In: Conf. on Obj. Oriented Prog. Sys. Lang. and App. (2007) 589–608 5. Chen, F., Ros¸u, G.: Mop: an efficient and generic runtime verification framework. In: Conf. on Obj. Oriented Prog. Sys. Lang. and App. (2007) 569–588 6. Havelund, K., Rosu, G.: Monitoring java programs with java pathexplorer. In: Proc. 1st Workshop on Runtime Verification. (2001) 7. NASA Aeronautics Research Mission Directorate, Aviation Safety Program: Integrated Vehicle Health Management Technical Plan, Version 2.03. http://www.aeronautics. nasa.gov/nra_pdf/ivhm_tech_plan_c1.pdf (2009) 8. Strom, R.E., Yemini, S.: Typestate: A programming language concept for enhancing software reliability. IEEE Trans. Softw. Eng. 12 (1986) 157–171
9. Bodden, E., Lam, P., Hendren, L.: Finding programming errors earlier by evaluating runtime monitors ahead-of-time. In: Int’l Symp on Found. of Soft. Eng., New York, NY, USA (2008) 36–47 10. Bodden, E.: Efficient hybrid typestate analysis by determining continuation-equivalent states. In: Int’l. Conf. on Soft. Eng. (2010) 11. Blackburn, S.M., Garner, R., Hoffman, C., Khan, A.M., McKinley, K.S., Bentzur, R., Diwan, A., Feinberg, D., Frampton, D., Guyer, S.Z., Hirzel, M., Hosking, A., Jump, M., Lee, H., Moss, J.E.B., Phansalkar, A., Stefanovi´c, D., VanDrunen, T., von Dincklage, D., Wiedermann, B.: The DaCapo benchmarks: Java benchmarking development and analysis. In: Proc. of the 21st ACM SIGPLAN Conf. on Object-Oriented Programing, Systems, Languages, and Applications. (2006) 169–190 12. Purandare, R., Dwyer, M.B., Elbaum, S.: Monitor optimization via stutter-equivalent loop transformation. In: ACM Conf. on Obj. Oriented Prog. Sys. Lang. and App. (2010) 13. Seyster, J., Dixit, K., Huang, X., Grosu, R., Havelund, K., Smolka, S.A., Stoller, S.D., Zadok, E.: Aspect-oriented instrumentation with gcc. In: Proc. 1st International Conference on Runtime Verification. Lecture Notes in Computer Science, Springer-Verlag (2010) 14. Chen, F., Meredith, P.O., Jin, D., Rosu, G.: Efficient formalism-independent monitoring of parametric properties. Automated Software Engineering, International Conference on (2009) 383–394 15. Knight, J.C., Leveson, N.G.: An experimental evaluation of the assumption of independence in multi-version programming *. IEEE Transactions on Software Engineering 12 (1986) 96–109 16. Eckhardt, D.E., Caglayan, A.K., Knight, J.C., Lee, L.D., McAllister, D.F., Vouk, M.A., Kelly, J.J.P.: An experimental evaluation of software redundancy as a strategy for improving reliability. IEEE Trans. Softw. Eng. 17 (1991) 692–702 17. Chen, M.Y., Kiciman, E., Fratkin, E., Fox, A., Brewer, E.: Pinpoint: Problem determination in large, dynamic internet services. In: DSN ’02: Proceedings of the 2002 International Conference on Dependable Systems and Networks, IEEE Computer Society (2002) 595– 604 18. Candea, G., Kawamoto, S., Fujiki, Y., Friedman, G., Fox, A.: Microreboot — a technique for cheap recovery. In: OSDI’04: Proceedings of the 6th conference on Symposium on Operating Systems Design & Implementation. (2004) 31–44 Adopts the philosophy of converting all failures to crashes and then focuses on reboot of crashed components as the only recovery strategy. Downside is that this sacrifices any opportunity to do effective fault localization to better target the recovery. Upside is it is simple. 19. Tang, Y., Gao, Q., Qin, F.: Leaksurvivor: towards safely tolerating memory leaks for garbagecollected languages. In: ATC’08: USENIX 2008 Annual Technical Conference on Annual Technical Conference, USENIX Association (2008) 307–320 20. Bond, M.D., McKinley, K.S.: Tolerating memory leaks. In: OOPSLA ’08: Proceedings of the 23rd ACM SIGPLAN conference on Object-oriented programming systems languages and applications, ACM (2008) 109–126 21. S¨ozer, H., Tekinerdo˘gan, B., Aks¸it, M.: Flora: a framework for decomposing software architecture to introduce local recovery. Softw. Pract. Exper. 39 (2009) 869–889 22. Walter, C.J., Lincoln, P., Suri, N.: Formally verified on-line diagnosis. IEEE Trans. Softw. Eng. 23 (1997) 684–721 23. Abreu, R., Zoeteweij, P., Gemund, A.J.C.v.: Spectrum-based multiple fault localization. In: ASE ’09: Proceedings of the 2009 IEEE/ACM International Conference on Automated Software Engineering, IEEE Computer Society (2009) 88–99 24. Abreu, R., Zoeteweij, P., van Gemund, A.J.C.: On the accuracy of spectrum-based fault localization. In: TAICPART’07: Proceedings of the Testing: Academic and Industrial Conference Practice and Research Techniques, IEEE Computer Society (2007) 89–98
25. Abreu, R., Zoeteweij, P., Golsteijn, R., van Gemund, A.J.C.: A practical evaluation of spectrum-based fault localization. J. Syst. Softw. 82 (2009) 1780–1792 26. S¨ozer, H., Abreu, R., Aks¸it, M., van Gemund, A.: Increasing system availability with local recovery based on fault localization. In: Proc. of 10th International Conference on Quality Software. (2010) 276–281 27. Dallmeier, V., Lindig, C., Zeller, A.: Lightweight defect localization for java. In: ECOOP 2005 - Object-Oriented Programming. Volume 3586 of Lecture Notes in Computer Science. Springer Berlin / Heidelberg (2005) 528–550 28. Hopcroft, J.E., Ullman, J.D.: Introduction to Automata Theory, Languages and Computation. Addison-Wesley (1979) 29. Xie, Y., Naik, M., Hackett, B., Aiken, A.: Soundness and its role in bug detection systems. In: Proc. of the Workshop on the Evaluation of Software Defect Detection Tools. (2005) 30. Bodden, E., Hendren, L.J., Lam, P., Lhot´ak, O., Naeem, N.A.: Collaborative runtime verification with tracematches. In: Works. on Runtime Verif. (2007) 22–37 31. Dwyer, M.B., Diep, M., Elbaum, S.G.: Reducing the cost of path property monitoring through sampling. In: Int’l. Conf. on Aut. Soft. Eng. (2008) 228–237 32. Arnold, M., Vechev, M., Yahav, E.: Qvm: An efficient runtime for detecting defects in deployed systems. In: Conf. on Obj. Oriented Prog. Sys. Lang. and App. (2008) 143–162 33. Dwyer, M., Purandare, R.: Residual dynamic typestate analysis. In: Int’l. Conf. on Aut. Soft. Eng. (2007) 124–133 34. Pozo, R., Miller, B.: Scimark 2.0. http://math.nist.gov/scimark (2004)