Hindawi Publishing Corporation e Scientific World Journal Volume 2015, Article ID 573068, 7 pages http://dx.doi.org/10.1155/2015/573068
Research Article Pattern Recognition Methods and Features Selection for Speech Emotion Recognition System Pavol Partila, Miroslav Voznak, and Jaromir Tovarek Department of Telecommunications, Faculty of Electrical Engineering and Computer Science, VSB-Technical University of Ostrava, 17 Listopadu 15, 70833 Ostrava, Czech Republic Correspondence should be addressed to Miroslav Voznak;
[email protected] Received 27 August 2014; Accepted 27 October 2014 Academic Editor: Ivan Zelinka Copyright © 2015 Pavol Partila et al. This is an open access article distributed under the Creative Commons Attribution License, which permits unrestricted use, distribution, and reproduction in any medium, provided the original work is properly cited. The impact of the classification method and features selection for the speech emotion recognition accuracy is discussed in this paper. Selecting the correct parameters in combination with the classifier is an important part of reducing the complexity of system computing. This step is necessary especially for systems that will be deployed in real-time applications. The reason for the development and improvement of speech emotion recognition systems is wide usability in nowadays automatic voice controlled systems. Berlin database of emotional recordings was used in this experiment. Classification accuracy of artificial neural networks, k-nearest neighbours, and Gaussian mixture model is measured considering the selection of prosodic, spectral, and voice quality features. The purpose was to find an optimal combination of methods and group of features for stress detection in human speech. The research contribution lies in the design of the speech emotion recognition system due to its accuracy and efficiency.
1. Introduction The development of applications and services is trying to deploy natural interaction between man and computer. Specifying commands by voice and movements is very popular nowadays. The majority of information is extracted from human speech with rather good accuracy. Human speech also includes secondary information, which holds properties of the speaker. Age, gender, emotional state, speech error, and other features are contained in human speech. The mentioned source characteristics are highly valuable, because speech features can be simulated only by person with good acting skills. As the title suggests, this paper describes a system for classifying emotional state of human speech. Emotion is one of the characteristics of human which describes his mental condition affecting physiological changes in the human body. These changes are also reflected in the human speech. Information about the emotional state is requested in many fields. Statistical evaluation of customer satisfaction and his interest in the products is evaluated by affected emotional state. This information is a direct response to any stimulus. Call center agents can be evaluated with regard to
their work and access to the customer. There is a chance to train new agents and teach them to correct the procedure of communication with the customer. Human body influenced by stronger emotions is getting stressed. Sectors such as police, firemen, and especially military generate the greatest emotional pressure on employees. Dispatching orders can be directly influenced by information from speech emotion recognition system. Speech signal can serve as an authorization key in access systems. Speech is affected by physiological changes caused by changing emotions. An authorized user can be denied because authorization unit recognizes the stress speech as a wrong key. These are just the first examples of utilizations for speech emotion recognition systems. It is obvious that the system will have great application in human-machine interaction. Therefore it is appropriate to identify a classification ability of different classifiers for different emotional states. One of the related works, but a more extensive research summary from Mr. El Ayadi et al., is published in the article “survey on speech emotion recognition: features, classification schemes, and databases,” which is mentioned in [1–4].
2
The Scientific World Journal
2. Speech Emotion Recognition System System design consists of several blocks, which it distributed to major functions. Input values are represented by audio signals from created database and used for training and testing. Block diagram of the system is shown in Figure 1. The quality of the input data, the audio signal in this case, has a direct impact on the classification accuracy. For this reason, the Berlin database containing over 500 recordings of actors consisting of men and women is used. The database contains 10 sentences in the seven emotional states. This corpus of recordings is considered as a highquality database, because it was created by professional actors in the sound studio. Blocks 𝑎, 𝑏, and 𝑐 represent point of view for emotion recognition. The system can be designed and used for detecting the stress of the speaker (option 𝑎), for recognition of all emotional states, as in the case of the Berlin database in which they are seven (option 𝑏). Other approaches to the problem are represented by block 𝑐. As mentioned, the speech signal has to be modified by routine preprocessing operations such as removing the DC component, preemphasis, and segmentation stochastic signal into quasiperiodic frames. Speech recognition system is context independent, that is, taking into account only signal parameters, not content information. These parameters are the training and testing vectors for classifiers [5–7]. The calculation parameters are represented by the features extraction block that extracts the following: (i) 39 Mel-frequency cepstral coefficients (MFCC) and dynamic parameters (first and second derivative of MFCC), (ii) 12 linear prediction coefficients (LPC), (iii) 12 linear spectral pairs (LSP), (iv) 8 prosodic features (RMS energy, log-energy, zero crossing rate (ZCR), mean crossing rate (MCR), position of maximum, maximum, minimum, and harmonic-to-noise ratio (HNR) [8].
Berlin EmoDB
SERS
a
Control
Preprocessing b
Features extraction
c
Classification
Recognition rate
Emotion
Figure 1: Block diagram of speech emotion recognition system (SERS). The system consists of a database that is used for training and testing and other blocks that describe functions of the algorithm. Different views on the issue are represented by blocks. (𝑎) Stress versus neutral state classification, (𝑏) each kind of emotion, and (𝑐) other approaches. Scenario option is represented by control block.
Hidden layer Input
w
Features
+
Output layer w
+
b
b
Output Classes/ emotions
Figure 2: Artificial neural network architecture with hidden layers and output classes.
3.1. Artificial Neural Network. Our emotional state classification problem with high number of parameters can be considered as a pattern-recognition problem. In this case, two-layer feedforward network can be used. A two-layer feedforward network, with sigmoid hidden and output neurons, can classify vectors arbitrarily well, given enough neurons in its hidden layer. The network is trained with scaled conjugate gradient (SCG) backpropagation. We shall denote the input values to the network by 𝑥𝑖 where 𝑖 = 1, . . . , 𝑑. The first layer of network forms 𝑀 linear combinations of these inputs to give a set of intermediate activation variables 𝑎𝑗(1) :
3. Classifiers Individual research shows that it cannot be said which classifier for emotion recognition is the best. Each classifier or their combination achieved some results accuracy, which depends on several factors. The success of classifier is directly dependent on the data. This is derived from the fact that the accuracy varies with the data character such as the quantity, density distribution of each class (emotions), and the language too. One classifier has different results with acted database, where the density of each emotion is equitable and different with real data from call center where normal (calm) emotion state occupies 85 to 95 percent of all data. Appropriate choice of parameters has a considerable effect on the accuracy of these classifiers. The following subsections describe the used classification methods.
𝑑
𝑎𝑗(1) = ∑𝑤𝑖𝑗(1) 𝑥𝑖 + 𝑏𝑗(1) ,
𝑗 = 1, . . . , 𝑀,
(1)
𝑖=1
with one variable 𝑎𝑗(1) associated with each hidden unit. Here
𝑤𝑖𝑗(1) represents the elements of first-layer weight matrix and
𝑏𝑗(1) is the bias parameters associated with the hidden units. Demonstration of such a network with speech features as an input, 5 hidden layers, and two output classes is shown in Figure 2. SCG training implements mean squared error 𝐸(𝑤) associated with gradient ∇𝐸 and avoids the line search per learning iteration by using Levenberg-Marquardt approach
The Scientific World Journal
3
in order to scale the step size. A weight in the network will be expressed in vector notation: (1) (1) (𝑙+1) (1) (1) , . . . , 𝑤𝑁 𝜃 , 𝑤𝑖𝑗+1 , 𝑤𝑖+1𝑗+1 , . . .) . (2) 𝑤 = (. . . , 𝑤𝑖𝑗(1) , 𝑤𝑖+1𝑗 1𝑗 𝑗
The vector-delta 𝐸 points in the direction in which 𝐸(𝑤) will decrease at the fastest possible rate. Weight update equation is shown below, where 𝑐 is suitable constant: 𝑤 (𝑘 + 1) = 𝑤 (𝑘) − 𝑐∇𝐸.
(3)
The gradient descent method for optimization is very simple and general. Only local information, for estimating a gradient, is needed for finding the minimum of the error function [9, 10]. 3.2. 𝑘-Nearest Neighbour. The 𝑘-NN is a classification method on the principle of analogies learning. Samples from the training set are 𝑛 numeric attributes, and each sample represents a point in 𝑁-dimensional space. This space of training samples is scanned by the classifier due to determining the shortest distance between training and unknown samples. Euclidean and other distances can be computed. In other words, an object is classified by a majority vote of its neighbours, with the object being assigned to the class most common amongst its 𝑘 nearest neighbours (𝑘 is a positive integer, typically small). If 𝑘 = 1, then the object is simply assigned to the class of its nearest neighbour. The various distances between the vectors 𝑥𝑖 and 𝑦𝑖 are as follows: 𝑛
2
𝑑 (𝑋, 𝑌) = √ ∑ (𝑥𝑖 − 𝑦𝑖 ) .
(4)
𝑖=1
The neighbourhood distance is calculated through Euclidean metric. Given an 𝑚-by-𝑛 data matrix 𝑋, it is treated as 𝑚 (1by-𝑛) row vectors 𝑥1 , 𝑥2 , . . . , 𝑥𝑚 . 3.3. Gaussian Mixture Model. A Gaussian mixture model is a parametric probability density function represented as a weighted sum of Gaussian component densities. GMMs are commonly used as a parametric model of the probability distribution of continuing measurements or features in biometric system, such as vocal tract, in speaker recognition systems as well. Probability distribution of the parameter vectors derived from human speech can be described using GMM: 𝑠
𝑀𝑠
𝑝 (𝑜 | 𝜆 ) = ∑𝑤𝑖𝑠 𝑝𝑖𝑠 (𝑜) ,
(5)
𝑖=1
where 𝑀 is the number of components for 𝑠 class, 𝑤𝑖 , 𝑖 = 1, . . . , 𝑀 are weights of components complying the condition that sum of all weights is 1, and 𝑝 means the probability density of the components represented by the mean value and covariance matrix 𝐶𝑖 . Gaussian model for class “𝑠” is defined by (6) 𝜆𝑠 = {𝑤𝑖𝑠 , 𝜇𝑖𝑠 , 𝐶𝑖𝑠 } ,
𝑖, . . . , 𝑀𝑠 .
(6)
The criterion of maximum likelihood depends on the probability density 𝑝 and sequence parameters 𝑂 = (𝑜1 , 𝑜2 , . . . , 𝑜𝑛 ), as seen bellow [11, 12]: 𝜆𝑠 = arg max 𝑝 (𝑜 | 𝜆𝑠 ) .
(7)
4. Experiment The aim of the experiment was to clarify the significance of chosen groups of features, as well as classification ability of selected classification methods for speech emotion recognition system. Samples of examination were formed from recordings of human speech with various emotional characters. The following settings and features were used in the experiment: (i) input samples—Berlin database of emotional utterances: (a) 10 different sentences recorded by 10 different actors (both genders), (b) over 530 samples consisting of 7 emotions: anger, boredom, disgust, fear, happiness, sadness, neutral state; (ii) feature extraction—computing of input vectors (speech parameters): (a) 13 MFCC coefficients 𝑐𝑚 = [𝑐𝑚 (0), . . . , 𝑐𝑚 (12)], 13 dynamic Δ𝑐𝑚 , and 13 acceleration coefficients of MFCC Δ2 𝑐𝑚 , (b) 12 LPC coefficients, (c) 12 LSP coefficients, (d) 8 prosodic features; (iii) emotion classification: (a) GMM—64 mixture components, (b) 𝑘-nearest neighbours (set up 5 neighbours); (c) artificial neural network—feedforward backpropagation.
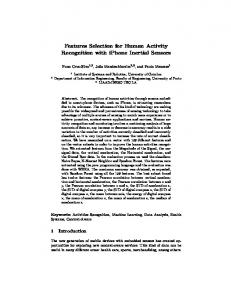
5. Result One of the points of view is recognizing the stressedout person, which means recognizing deviations from the neutral state. This state is not defined in the Berlin database. Therefore, it was necessary to assemble a set of data, the socalled “stress cocktail” from defined emotional states. The stress of a person can be assembled from emotional states, other than neutral state. Emotions, anger and fear, were used to compile the stress data set with 50/50 ratio that these emotional states are reflected most often when a person is exposed to stressful situations. Fear and anger were selected because of the major sound differences from neutral state. Confusion matrices for each set of features are shown in Tables 2, 3, 4, and 5. The meaning of cells describes Table 1. True positive (TP) represents correctly classified first class
4
The Scientific World Journal ROC-LPC
1 0.8
0.8 True positive rate
True positive rate
ROC-LSP
1
0.6 0.4 0.2
0.6 0.4 0.2
0 0
0.2
0.4 0.6 False positive rate
0.8
0
1
0
0.2
(a)
0.8
1
0.8
1
ROC-MFCC
1 0.8 True positive rate
0.8 True positive rate
0.6
(b)
ROC-prosodic
1
0.4
False positive rate
0.6 0.4
0.6 0.4 0.2
0.2
0
0 0
0.2
0.4 0.6 False positive rate
0.8
ANN K-NN GMM
1
0
0.2
0.4 0.6 False positive rate
ANN K-NN GMM (c)
(d)
Figure 3: Receiver operating characteristic of GMM, 𝑘-NN, and ANN classifier in neutral state versus stress recognizing for LPC, LSP, prosodic, and MFCC features.
Table 1: Confusion matrix: description of cells.
Output classes
Classifier True positive False positive Positive predictive value False negative True negative Negative predictive value Sensitivity Specificity Target classes
Precision
(neutral) and true negative (TN) correctly classified second class (stress). The GMM, 𝑘-NN, and the ANN were used to classify the stress versus neutral state. Results for all three classifiers are shown in Figure 3. The receiver operating characteristic (ROC) is applied for better system understanding. ROC curve is a tool for the evaluation and optimization of binary classification system (test), which shows the relationship
between the sensitivity and specificity of the test or the detector for all possible threshold values [13]. The results in Tables 6, 7, and 8 describe classification accuracy for a particular type of classifier that has been trained by best-scored MFCC features of emotion pair. The classifier was trained by pair of emotions and values in the tables show tested ability of recognizing emotional state (left table header). All three classifiers showed the best recognition ability for the emotional state of anger. Emotional state of sadness was recognized with the evaluation very well. On the other hand, the worst-recognition ability of the system was the emotional state of fear (GMM and ANN) and disgust (ANN).
6. Conclusion Neutral state versus stress scenario has been used for evaluating the accuracy of classification methods and features. The
The Scientific World Journal
5 Table 2: Performance results of classifiers for LPC features.
LPC Neutral state Stress
1718 5.1% 7542 22.5% 18.6% Neutral state
ANN 920 2.7% 23410 69.7% 96.2%
65.1% 75.6% 74.8%
Stress
2233 6.6% 7027 20.9% 24.1% Neutral state
k-NN 3241 9.6% 21089 62.8% 86.7%
40.8% 75.0% 69.4%
Stress
5240 15.6% 4020 12.0% 56.6% Neutral state
GMM 6023 17.9% 18307 54.5% 75.2%
46.5% 81.9% 73.4%
Stress
Table 3: Performance results of classifiers for LSP features. LSP Neutral state Stress
3466 13.4% 5794 22.4% 37.4% Neutral state
ANN 1814 7.0% 14820 57.2% 89.1%
66.1% 71.7% 70.6%
Stress
3409 13.2% 5851 22.6% 36.8% Neutral state
k-NN 3369 13.0% 13265 51.2% 79.7%
50.3% 69.4% 64.4%
Stress
5778 17.2% 3482 10.4% 62.4% Neutral state
GMM 5452 16.2% 18818 56.2% 77.6%
51.5% 84.4% 73.4%
Stress
Table 4: Performance results of classifiers for prosodic features. LSP Neutral state Stress
4470 13.3% 4790 14.3% 48.3% Neutral state
ANN 1699 5.1% 22629 67.4% 93.0%
72.5% 82.5% 80.7%
Stress
3953 11.8% 5307 15.8% 42.7% Neutral state
k-NN 2503 7.5% 21825 65.0% 89.7
61.2% 80.4% 76.7%
Stress
6483 19.3% 2777 8.3% 70.0% Neutral state
GMM 4774 14.2% 19556 58.2% 80.4%
57.6% 87.6% 70.1%
Stress
Table 5: Performance results of classifiers for MFCC (dynamic and acceleration coefficients too) features. MFCC Neutral state Stress
7445 22.1% 1684 5.0% 81.6% Neutral state
ANN 1901 5.7% 22587 67.2% 92.2% Stress
79.7% 93.1% 89.3%
4919 14.6% 4210 12.5% 53.9% Neutral state
k-NN 2209 6.6% 22279 66.3% 91.0%
69.0% 84.1% 80.9%
Stress
6305 18.8% 2824 8.4% 69.1% Neutral state
GMM 3507 10.4% 20981 62.4% 85.7%
63.3% 88.1% 81.2%
Stress
Table 6: Gaussian mixture model classification accuracy for different combinations of emotions [%]. Train 2/test Anger Boredom Disgust Fear Happiness Sadness Neutral state
Anger — 76.3 59.1 52.4 42.7 87.1 78.6
Boredom 91.7 — 64.3 72.6 83.9 67 53.3
Disgust 85.7 64.9 — 59.7 73.7 75.5 69.1
Train 1 Fear 83.4 66.2 62.5 — 73.9 73 63.9
Happiness 70 71.9 56 47.2 — 85.5 74
Sadness 96.4 65.3 78.5 81.8 90.5 — 65.7
Neutral state 90.8 59 64.7 70.4 82.4 75 —
6
The Scientific World Journal Table 7: 𝐾-nearest neighbours classification accuracy for different combinations of emotions [%].
Train 2/test Anger Boredom Disgust Fear Happiness Sadness Neutral state
Anger — 92 49 46.9 31.9 89.2 79.8
Boredom 91.2 — 55 60.3 78 70.5 40.5
Disgust 90.3 70.4 — 56.5 72.7 84.8 70.6
Train 1 Fear 89.8 67.7 59.7 — 73.1 79.7 66
Happiness 81.1 75.9 51.8 47.8 — 89.6 77.4
Sadness 94.7 61.6 71.2 75.1 86.1 — 65.7
Neutral state 92.4 64.6 56.6 68.2 78.7 81.1 —
Table 8: Feed forward backpropagation neural network classification accuracy for different combinations of emotions [%]. Train 2/test Anger Boredom Disgust Fear Happiness Sadness Neutral state
Anger — 92 79.8 69.6 32.3 97.9 93
Boredom 95.8 — 79.1 70.6 88.3 81.5 49.9
Disgust 93.7 87.6 — 73.7 79.8 92.6 86
results show that the most precise method for recognizing speech of the human stress state is an artificial neural network, which achieved the best results for all sets of parameters (90% for MFCC). The most significant feature for emotion classification is MFCC. This fact demonstrates accuracies of all the classifiers and the ratio of the sensitivity and specificity of the ROC curve shown in Figure 3. One of the reasons is the individuality of MFCC coefficients, which are not mutually correlated. This experiment shows that these classification methods can be used on the recognition of emotional state. At the same time, the question arises: what emotional states will characterize stress. The answer will probably depend on which system would be applied. Another fact is that we cannot determine the intensity of emotionally stimulated Berlin database. One of the main tasks will be to compare these results with the emotional recordings of the realistic environmental conditions.
Train 1 Fear 92.4 83.4 68.2 — 83.9 95.3 85.1
[3] [4]
[5]
[6]
[7]
[8]
Conflict of Interests The authors declare that there is no conflict of interests regarding the publication of this paper.
References [1] M. Zarkowski, “Identification-driven emotion recognition system for a social robot,” in Proceedings of the 18th International Conference on Methods and Models in Automation and Robotics (MMAR ’13), pp. 138–143, August 2013. [2] S. Bakhshi, D. Shamma, and E. Gilbert, “Faces engage us: photos with faces attract more likes and comments on Instagram,” in Proceedings of the 32nd Annual ACM Conference on Human
[9]
[10]
[11]
Happiness 87.9 91.2 77.7 68.2 — 97.5 88.2
Sadness 98.1 75.1 86.4 82.2 95 — 52.4
Neutral state 96.7 77.1 77.6 76.2 88.9 85.2 —
Factors in Computing Systems (CHI ’14), pp. 965–974, ACM, New York, NY, USA, 2014. M. A. R. Ahad, Motion History Images for Action Recognition and Understanding, Springer, London, UK, 2013. M. El Ayadi, M. S. Kamel, and F. Karray, “Survey on speech emotion recognition: features, classification schemes, and databases,” Pattern Recognition, vol. 44, no. 3, pp. 572–587, 2011. S. G. Koolagudi and K. S. Rao, “Emotion recognition from speech: a review,” International Journal of Speech Technology, vol. 15, no. 2, pp. 99–117, 2012. M. Voznak, F. Rezac, and J. Rozhon, “Speech quality monitoring in Czech national research network,” Advances in Electrical and Electronic Engineering, vol. 8, no. 5, pp. 114–117, 2010. P. Partila, M. Voznak, M. Mikulec, and J. Zdralek, “Fundamental frequency extraction method using central clipping and its importance for the classification of emotional state,” Advances in Electrical and Electronic Engineering, vol. 10, no. 4, pp. 270– 275, 2012. F. Eyben, F. Weninger, M. Wollmer, and B. Schuller, openSMILE—the Munich open Speech and Music Interpretation by Large Space Extraction toolk it, TU Munchen, 2013, http:// opensmile.sourceforge.net/. T. Neuberger and A. Beke, “Automatic laughter detection in spontaneous speech Using GMM-SVM method,” in Text, Speech, and Dialogue, vol. 8082 of Lecture Notes in Computer Science, pp. 113–120, 2013. J. Krajewski, S. Schnieder, D. Sommer, A. Batliner, and B. Schuller, “Applying multiple classifiers and non-linear dynamics features for detecting sleepiness from speech,” Neurocomputing, vol. 84, pp. 65–75, 2012. S. Ntalampiras and N. Fakotakis, “Modeling the temporal evolution of acoustic parameters for speech emotion recognition,” IEEE Transactions on Affective Computing, vol. 3, no. 1, pp. 116– 125, 2012.
The Scientific World Journal [12] H. Hu, M.-X. Xu, and W. Wu, “GMM supervector based SVM with spectral features for speech emotion recognition,” in Proceedings of the IEEE International Conference on Acoustics, Speech and Signal Processing (ICASSP ’07), pp. IV-413–IV-416, Honolulu, Hawaii, USA, April 2007. [13] J. Davis and M. Goadrich, “The relationship between precisionrecall and ROC curves,” in Proceedings of the 23rd International Conference on Machine Learning (ICML ’06), pp. 233–240, 2006.
7