PEANO - A Tool for On-Line Calibration Monitoring Mario Hoffmann OECD Halden Reactor Project - Institute for Energy Technology +47 6921 2200, +47 6921 2460,
[email protected]
Abstract On-Line Monitoring (OLM) of a channel’s calibration state evaluates instrument channel performance by assessing its consistency with other plant indications. Industry and experience at several plants has shown this overall approach to be very effective in identifying instrument channels that are exhibiting degrading or inconsistent performance characteristics. The Halden Reactor Project has developed the signal validation system PEANO [1], which can be used to assist with the tasks of OLM. To further enhance the PEANO System for use as a calibration reduction tool, two additional modules have been developed. The HRP Prox, which performs preprocessing and statistical analysis of signal data and the Batch Monitoring Module (BMM), which is an off-line batch monitoring and reporting suite. The purpose and functionality of the HRP Prox and BMM modules are discussed in this report, as well as the improvements made to the PEANO Server to support these new modules. 1.
INTRODUCTION
PEANO is a system for On-Line Calibration Monitoring and real-time signal validation, based on empirical models, which has been developed at the OECD Halden Reactor Project in Norway. The system utilizes fuzzy logic and Auto-Associative Neural Networks to calculate the predictions of the monitored signals. Recently the system has been extended to better fit the industries need for on-line calibration monitoring systems. 2.
ON-LINE CALIBRATION MONITORING
On-Line Monitoring of a channel’s calibration state evaluates instrument channel performance by assessing its consistency with other plant indications. Experiences at several plants have shown this overall approach to be very effective in identifying instrument channels that are exhibiting degrading or inconsistent performance characteristics. On-Line monitoring of instrument channels provides information about the condition of the monitored channels through accurate, more frequent monitoring of each channel’s performance over time. This type of performance monitoring is a methodology that offers an alternate approach to traditional time-directed calibration and opens the possibility for a state-based calibration strategy. On-line monitoring of these channels can provide an assessment of instrument performance and provide a basis for determining when adjustments are necessary. Elimination or reduction of unnecessary field calibrations can reduce associated labor costs, reduce personnel radiation exposure and reduce the potential for miss-calibration. In addition, with a time-based maintenance strategy, a sensor that does require calibration might be skipped simply because the calibration interval has not passed yet, even though the sensor is in need of maintenance. This can potentially lead to unexpected down-time and safety hazards. This state-based calibration strategy has got an increasing interest among the utilities since the US NRC in 2000 accepted the possibility to monitor on-line the calibration state of the plant process instrumentation. The NRC expressed their position on on-line calibration monitoring in the Safety Evaluation Report (SER-93653-1, 24 July
2000), written in response to the EPRI Topical Report (TR-104965) on “On-Line Monitoring of Instrument Channel Performance”. The topical report was prepared by the EPRI On-Line Monitoring User Group, which is actively working on an implementation plan to get the technique of on-line calibration monitoring implemented in the industry. Investigations performed by the EPRI On-Line Monitoring User Group show that a large portion of the calibrations effort are currently performed on checking sensors that are not in need of any maintenance. In one case it was found that out of the 646 sensors that were calibrated, only 3 had drifted and were in need of maintenance. If one considers that an average calibration takes about 8-10 hours to perform, the potential for savings becomes clear and a shorter plant refueling outage duration suggests that a different approach to instrument calibration is needed. 3.
PEANO
The PEANO System is a complete system for on-line calibration monitoring and real-time sensor validation. The overall system is comprised of several different modules, e.g. HRP Prox pre-processing module, the PEANO Modeling Tool, PEANO Server and the Batch Monitoring Module. In this section a short description of the various modules will be given, indicating the purpose and functionality. 3.1
Pre-processing Module - HRP Prox
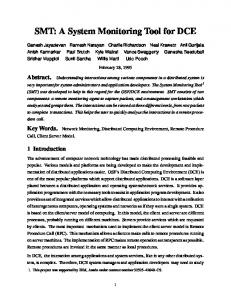
The pre-processing module is a user-friendly tool to process and analyse data files to be used in empirical based systems for on-line monitoring, like PEANO and ALADDIN [2]. Both PEANO and ALADDIN use neural networks to learn what constitutes “normal” conditions in a process, and require a sizeable amount of data during the learning phase. Reliable learning (modelling) can more easily be achieved when the training data is “clean”, i.e. it does not contain outliers and/or an excessive amount of noise or bad data (e.g. data that are considered unreliable, like stuck or abnormally set to zero for a long period of time). Also, reducing the amount of data by downsampling excessive information and performing cross-correlation analysis may help minimizing the duration of the learning phase. The HRP Prox suite will display different kinds of statistics, including: • The cross correlation between the signals. • The signal-to-noise ratio for each signal. • Simple statistics for each signal (max, min, average, std.dev., max step change). The cross correlation is displayed both as an image and as a floating-point value. In the image, as shown in figure 1, the signals are arranged in a symmetric matrix with increasing signal number from left-to-right and from top-tobottom. The degree of yellow color indicates the cross correlation value (in a black and white copy the lighter color indicates a stronger correlation).
Figure 1. HRP Prox - Statistics Window The program will detect bad data and either automatically remove it, or let the user select which data to remove. Bad data is defined as groups of data that appears to be stuck at a certain value for a long period of time. Also outliers can be detected and either removed automatically, or the user can have manual control over which samples are removed. Outliers are defined as data that deviates from the average of the signal samples value (within a specified time window) by more than a given value (given as a multiple of the standard deviation within the same time window). The data can also be down sampled, if the sample interval is to short and results in an excessive amount of data. For example, the user may wish to retain only every 3rd data point, in which case the number of sampling points is reduced by 67 %. The program can de-noise the data for one signal or all signals using the same Wavelet Denoising module as in PEANO. The user may choose which signal to view in the included graph (this can be used to check how well the de-noising is performing). The user must choose which Wavelet basis to use (Daubechies, Symlets, BattleLemariè, or Spline) and the parameter values accompanying it, as well as the Denoise method (Hard-thresholding or Multiresolution). 3.2
PEANO
The PEANO System has originally been developed as a real-time sensor validation system. However, the techniques and methods used in PEANO can be used to support the task of sensor calibration monitoring. Utilities are more and more looking for tools to help them to safely implement a state-based calibration strategy, as opposed to the familiar time-based strategy, in an attempt to shorten their maintenance periods. As described in this paper the PEANO System has been extended with additional modules to effectively support this task. The PEANO System already consisted of a PEANO Modeling Tool and a PEANO Server and PEANO Monitor. The latter two are used for the purpose of real-time sensor validation. These are not needed when the system is
applied for calibration monitoring, but can still be applied in parallel and provide additional benefits (e.g. help to make better operational decisions and provide better input data for other Computerized Operator Support Systems, like alarm systems and diagnosis systems). 3.3
Batch Monitoring Module
The Batch Monitoring Module (BMM) is a specific tool for processing large amounts of data stored during plant operation, in order to monitor this data in a batch mode for a Calibration Reduction purpose. Fig.2 shows the user interface and a typical result window for one sensor. BMM uses the same monitoring methods and algorithms as the PEANO Server. BMM makes use of PEANO models that have been developed with the PEANO Modelling tool. These are the same models that can be used by the PEANO Server for a real-time application of the system. If a PEANO expert has developed a model for a plant’s process, any user can apply BMM in order to monitor data for a Calibration Reduction purpose.
Figure 2. PEANO Batch Monitoring Module BMM will, on request, provide a Calibration Report in the form of a printable document. This report presents an overview over the calibration state of all sensors, and points out those in need of calibration. This information can be very valuable during the planning stages of a maintenance period and can assure that calibration efforts are targeted on those sensors that are in need of maintenance. A typical graph included in the report is the average calibration error for each sensor, as shown in fig. 3. A sensor with a calibration problem can quickly be identified from this graph.
Figure 3. Average validation error graph
4.
ON-LINE CALIBRATION MONITORING
With the addition of the pre-processing module (HRP Prox) and the Batch Monitoring Module, the PEANO system fits very well into the overall scheme of on-line calibration monitoring, as shown in fig. 4. When a timeline is considered over the horizontal axis, the time can typically be divided into plant operation and a maintenance period. Before the actual maintenance period, some time will be spent on the maintenance planning, while the plant is still in operation. When the maintenance planning is conducted properly and with the correct information, e.g. from a calibration monitoring system, the maintenance period can be shortened, without a compromise on the quality and safety. The figure further indicates at what time the various PEANO modules are applied to fit in this overall strategy.
Plant Operation
Maintenance
Maintenance Planning
PEANO
PEANO Prox v1.0
PEANO Batch Monitoring
PEANO Modelling Tool PEANO Server
Figure 4. PEANO in an on-line calibration strategy To develop a PEANO model, one needs access to recorded historic plant data that represents correct measurements of the sensors in the plant states of operation that one wants to have monitored by the system. Rarely, the data retrieved from the plant computer can be used directly, since it often exhibits gaps in the data, noise and outliers. The HPR Prox is used to prepare this data for the modeling task at hand. Additionally, by analyzing the statistical properties of the data, groups of sensors can be selected that are well suited to be applied in one model, since the model performance is based on the correlation between the sensors. Once the data is prepared a model can be developed with the PEANO Modeling Tool. This application guides the user through the model development process, without the need of any thorough knowledge of the underlying fuzzy logic and neural network techniques. The model can then be applied in either the PEANO Server or the Batch Monitoring Module (BMM).
The Batch Monitoring Module is applied during the maintenance planning to get better knowledge about the state of the sensors in the process. The sensor measurements of a whole fuel cycle can be analyzed in a matter of minutes and the results provide a valuable insight in a sensor’s state and help to decide if a re-calibration should be performed. If the PEANO System is applied for real-time signal validation, the PEANO Server is typically connected to the process computer and the validation results need to be fed into the process computer and shown in the human system interface that the operator uses to control and monitor the process. 5.
CONCLUSIONS
From experience in the industry it has become clear that On-Line Monitoring of instrument channels can be an important tool for calibration reduction in the process of adapting a state-based maintenance strategy. This approach offers utilities the potential for a considerable reduction in maintenance costs and contributes to the plant safety through timely detection of problems. With the addition of the HRP Prox and the Batch Monitoring Module to PEANO, the system supports the industry with the tasks of on-line monitoring for calibration reduction. The ability to detect sensor calibration problems with the techniques applied in the PEANO System has been proven in the past through many pilot tests and applications. With the latest PEANO System utilities can easily benefit from these advanced techniques and improve their maintenance strategy with calibration reduction through on-line monitoring. 6.
REFERENCES
[1]
Fantoni, P., 2000. A Neuro-Fuzzy Model Applied to Full Range Signal Validation of PWR Nuclear Power Plant Data. International Journal of General Systems 29, 305-320.
[2]
Roverso, D., 2002. Plant Diagnostics by Transient Classification: The ALADDIN Approach. International Journal of Intelligent Systems Vol. 17 No. 8, 767-790.