Indian J. Genet., 76(2): 173-180 (2016) DOI: 10.5958/0975-6906.2016.00027.4
Performance evaluation of neural network, support vector machine and random forest for prediction of donor splice sites in rice 1
1,
Prabina Kumar Meher, Tanmaya Kumar Sahu and A. R. Rao * 1
Division of Statistical Genetics, Centre for Agricultural Bioinformatics, ICAR-Indian Agricultural Statistics Research Institute, New Delhi 110 012
(Received: March 2015; Revised: February 2016; Accepted: February 2016)
Downloaded From IP - 14.139.248.10 on dated 7-Jun-2016
www.IndianJournals.com
Members Copy, Not for Commercial Sale
Abstract Prediction of splice sites plays an important role in predicting the gene structure. Rice being one of the major cereal crops, continuous improvement is possible with the prediction of unknown genes associated with complex traits. Machine learning techniques i.e., Artificial Neural Network (ANN) and Support Vector Machine (SVM) have been successfully used for the prediction of splice sites but comparison of their performance has not been made yet to our limited knowledge. Further, Random Forest (RF), another machine learning method, has been successfully used and reported to outperform ANN and SVM in areas other than splice site prediction. In this study we have developed an approach to encode the splice site sequence data of rice into numeric form that are subsequently used as input in ANN, SVM and RF for prediction of donor splice sites. The performances were then evaluated and compared using receiving operating characteristics (ROC) curve and estimate of area under ROC curve (AUC), averaged over 5-fold cross validation. The result reveals that AUC of RF is higher than ANN and SVM which implies that it can be preferred over SVM and ANN in the prediction splice sites.
Key words:
Gene structure, splice site, machine learning, rice
Introduction Splicing is a process that allows for introns to be removed and exons joined together to form mature mRNA after transcription and further translation into protein (Baten et al. 2006). The splice site junction is found where an intron meets an exon. These splice site motifs provide signals to allow for correct splicing to occur. The splice sites are characterized as the acceptor (3) and donor (5) splice sites in most of the eukaryotes. In most of the situations, these signals
consist of invariant dinucleotides GT at the start and AG at the end of the intron as well as partially conserved nucleotides surrounding splice junction (Sonnenburg et al. 2007). Several methods have been developed over the years for the prediction of splice sites and most of them are based on Artificial Neural Network (ANN) (Weber 2001; Sonnenburg et al. 2002; Rajapakse and CaH, 2005) and Support Vector Machine (SVM) (Zien et al. 2002; Degroeve et al. 2002; Sun et al. 2003; Saeys et al. 2004; Huang et al. 2006; Baten et al. 2006; Sonnenburg et al. 2007; Chen et al. 2009). Some of the approaches are also based on classification trees (Burge and Karlin 1997; Pertea et al. 2001; Patterson et al. 2002). In splice site prediction using machine-learning approaches, sequence data are first encoded into numeric form and are then used as input to train, validate and test the model. Besides SVM and ANN, Random Forest (RF) (Breiman 2001) is another machine learning technique that has been extensively used in the area of genomic research (Bureau et al. 2005; Meng et al. 2009). It is an extension of Breiman’s earlier work on Classification And Regression Trees (CART) (Breiman et al. 1984) and bootstrap aggregating (bagging; Breiman, 1996). RF has been widely applied to different benchmarks studies and in many cases, outperforms other classifiers like Linear discriminant analysis (LDA), Knearest-neighbor (kNN), SVM, Quadratic discriminant analysis (QDA), ANN etc. (Wu et al. 2003; Lee et al. 2005; Hamby and Hirst 2008; Dehzangi et al. 2010; Khalilia et al. 2011). However, its application in the
*Corresponding author’s e-mail:
[email protected] Published by the Indian Society of Genetics & Plant Breeding, F2, First Floor, NASC Complex, PB#11312, IARI, New Delhi 110 012 Online management by indianjournals.com
174
Prabina Kumar Meher et al.
area of splice site prediction is yet to be fully explored. Further, in earlier studies, no comparative analysis has been carried out between ANN and SVM for prediction of splice sites. Therefore, it is required to apply the RF for splice site prediction as well to perform a comparative analysis among SVM, ANN and RF. In the present study, a new encoding approach has been devised to encode the splice site sequences of rice genome. The encoded dataset was further used as input for predicting the donor splice sites using ANN, SVM and RF. In addition, a comparative analysis was carried out to assess the performances of ANN, SVM and RF in terms of Receiving Operating Characteristics (ROC) curve and estimate of Area Under ROC curve (AUC) (Fawcett 2006).
Downloaded From IP - 14.139.248.10 on dated 7-Jun-2016
www.IndianJournals.com
Members Copy, Not for Commercial Sale
Materials and methods Collection and processing of data Exon and intron sequences of Oryza sativa were collected from the FTP site of Rice Genome Annotation Project (ftp://ftp.plantbiology.msu.edu/pub/ data/ Eukaryotic_Projects/ o_sativa/ annotation_dbs/ pseudomolecules/version_7.0). The true splice sites (TSS) having 100 nucleotides at exon end and 102 nucleotides at intron start (including the conserved dinucleotide GT at intron start) were extracted from the collected exon and intron sequences thorough a perl program. Further, the false splice sites (FSS) of length 202 were extracted from the exonic and intronic st nd sequences having GT at 101 and 102 positions respectively. Keeping in view the availability of computational resources at hand, a sample dataset with 10000 TSS and 10000 FSS were considered for the analysis. Selection of window size Optimization of window size for different genomes is crucial for the induction of accurate species-specific splice site prediction model [Degroeve et al. 2002; Meher et al. 2014a]. Here, the idea of modified Bhattacharya distance (Comaniciu et al. 2003) was explored to determine the initial window size. Besides the initial window size, four more window sizes in the vicinity of splice junction were considered to assess about the impact of window size on the prediction accuracy as well as to determine the optimum window size. Redundancy check The redundancy check was performed for the
[Vol. 76, No. 2
considered five different window sizes and the percentage of duplicate (overlapping) sequence within and between TSS and FSS was observed. Finally, the window size(s) having more than 50% overlapped sequences were excluded as presence of large number of overlapped sequences may lead prediction accuracy biased towards the class having large number of overlapped sequence. The remaining window sizes were further considered to determine the optimum window size on the basis of lower misclassification error. Associations among nucleotides Associations among nucleotides were computed by using the method proposed by Meher et al. (2014b) and is describe as follows; Consider a sequence dataset having N sequences of equal length P and let
( x 1 k , x 2 k , ..., x P k ) 1, 2,..., P
be the k
,
th
Sk
xik { A, T , G , C}; i
sequence. Then for the i
th
position, the occurrence of base s can be described by an indicator variable
I is i.e.,. I is I ( xik s ) =
1, if s occurs i 1, 2,..., P; s { A, T , G , C}; 0, otherwise k 1, 2,..., N . Then, association between base s and th
th
t at i and j position respectively is computed by N
ai , j ( s, t )
I (x
ik
k 1
N
I (x k 1
ik
s ) I ( x jk t ) N
s ). I ( x jk t )
i j
k 1
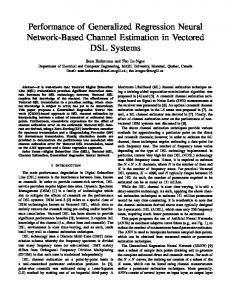
Initially, window length of 30 bp was taken for computing association matrices. Sixteen association matrices, each of order P × P (where, the diagonal elements are kept zero), were obtained corresponding to 16 combinations of di-nucleotides and out of them 10 association matrices are enough to fully portrait the association structure as the remaining 6 can be obtained by taking the transpose of the others (Meher et al. 2014b). The heat maps were then generated separately for TSS and FSS and the color keys with histogram are plotted (Fig. 1, only 5 combinations are plotted) to visualize the variability in the association pattern both in TSS and FSS motifs.
Downloaded From IP - 14.139.248.10 on dated 7-Jun-2016
www.IndianJournals.com
Members Copy, Not for Commercial Sale
May, 2016]
Machine learning techniques for splice site identification
Fig. 1. Color keys of the heat maps generated using the association matrices of TSS and FSS. Out of 16 possible association matrices, 10 are enough to portrait the associations. Here, color keys of only five associations (AA, AT, AG, AC and TT) are provided. It can be observed from histogram that there is a higher degree of variability in the association of TSS as compared to the FSS
175
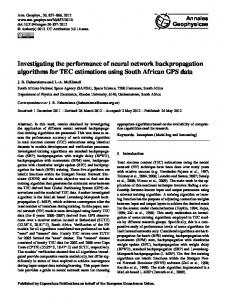
Fig. 2. Flow diagram of encoding the training and test sequence datasets. In each fold of the five-fold cross validation, training sets of TSS and FSS i.e., encoding subsets are used for computing the respective association matrices. Then, the differences in the association matrices are computed. Finally, training and test sequence datasets are passed through these difference matrices to get the encoded sequence data
Encoding of splice site motif
Prediction using SVM, ANN and RF
From Fig. 1 it is observed that the variability in the association is more in TSS than FSS. Keeping in mind the differences in variability in the association pattern between TSS and FSS, a sequence encoding approach is proposed here and the steps are as follows;
The encoded sequence datasets were used as input in the considered machine learning techniques for the prediction of donor splice sites. Initially, the encoded datasets were divided into five non-overlapping subsets for adopting five-fold cross validation procedure, separately for the TSS and FSS. In each fold, one set of TSS and one set of FSS together were used as the test set and the remaining sets were used together as the training set. The training of the models was done with optimized parameters setting.
a.
Use a subset of TSS and FSS for finding the respective association matrices.
b.
Subtract the association matrices of FSS from the corresponding association matrices of TSS.
c.
Pass all the 10000 motifs of TSS and FSS through difference matrices obtained in step-2 and encode the motifs into numeric form.
A flow diagram of the encoding procedure is presented in the Fig. 2. In this encoding procedure, a sequence of length was converted into a numeric vector of length l × (l–1). To check the consistency of the proposed encoding approach, five non-overlapping subsets of slice site motifs were used for the encoding.
A Comparison among SVM, ANN and RF was made using ROC curves. Further, the statistical comparison between two ROC curves was made using AUC and its Standard Error (Bradley 1997). The SE of AUC was computed as
SE=
θ(1-θ)+(N
(TSS)
2
-1)(Q1 -θ )+(N N
(TSS)
.N
(FSS)
(FSS)
2
-1)(Q 2 -θ )
176
where
Prabina Kumar Meher et al.
θ 2.θ 2 Q1 = , Q2 = (1+θ) (2-θ)
;N
(TSS)
,N
(FSS)
and
are the number of positive instances (TSS), number of negative instances (FSS) and estimate of AUCROC respectively.
Downloaded From IP - 14.139.248.10 on dated 7-Jun-2016
www.IndianJournals.com
Members Copy, Not for Commercial Sale
Optimization of parameters For the optimization of parameters, a sample dataset of 2000 encoded TSS and 2000 encoded FSS were used. In RF, the number of variables to be chosen at each node i.e., mtry was optimized. The optimum one was identified out of the considered ten different values of mtry i.e., (p)/2, p, 2*p, 3*p, 4*p, 5*p, 6*p, 7*p, p/2 and p (=l×(l-1)). In case of SVM, the radial basis function was used as the kernel, where the optimum value of gamma was obtained from different values of gamma i.e., 0.01, 0.02, 0.03, 0.04, 0.05, 0.06, 0.07, 0.08, 0.09 and 0.1. Similarly, in ANN, the optimum number of units in the hidden layer was obtained from ten different units in the hidden layer i.e., 5, 10, 15, 20, 25, 30, 35, 40, 45 and 50. In all the cases, the optimum value of parameter was obtained based on the lowest misclassification error averaged over five-fold cross validation.
[Vol. 76, No. 2
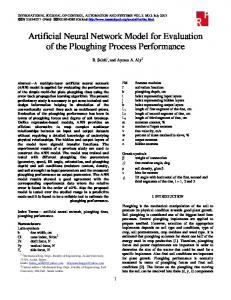
as input. Most of the encoding procedures are based on the nucleotide dependency features surrounding the splice junction. In this study, we proposed an encoding procedure based on the association among adjacent and non-adjacent nucleotides in splice site motifs. The encoded dataset of donor splice sites were used as input in ANN, SVM and RF classifiers for the prediction purpose. In splice site prediction, species specific window size determination is important and thus the Bhattacharya distance was used to have an idea about the initial window size. Using the position wise aligned sequence dataset of TSS and FSS motifs, Modified Bhattacharya distance was computed and plotted (Fig. 3) for 20 positions in splice site motif (10 positions at the exon end and 10 positions at the intron start excluding GT at the beginning of intron). It is seen from Fig. 3 that the three positions at the exon end
Implementation of SVM, ANN and RF The “e1071” (Meyer et al. 2012), “RSNNS” (Bergmeir et al. 2012) [28] and “randomForest” (Liaw and Wiener, 2002) packages of R software were used for implementing SVM, ANN and RF respectively on the encoded data sets. The SVM model was trained with the radial basis function as kernel with optimum value of gamma. In the ANN model, multilayer perceptron was used with “Randomize_Weights” as initialization function, “Std_Backpropagation” as learning function and “Act_Logistic” as hidden activation function with optimum number of units in the hidden layer. RF was trained with optimum number of mtry and 10000 trees (ntree) in the forest. Results and discussion Accuracy in the prediction of gene structure is highly dependent on the accuracy of splice site prediction (Baten et al. 2006). During last decade, several methodologies have been developed for the prediction of splice sites and among them machine learning based methods are more successful in terms of prediction accuracy (Wei et al. 2012). For prediction using machine learning techniques, the sequence data are first encoded into numeric form and are then used
Fig. 3. Modified Bhattacharya distances between the positions of TSS and FSS. It can be seen that the distances at seven positions in splice site motif (3 at exon end and 4 at intron start, excluding conserved two positions at the beginning of intron) are higher than the other positions. Hence, 9bp motif (including 2 bp GT at intron start) is considered as the initial window size
and four positions at the intron start excluding GT have the higher distances than other positions. Further, it is observed that the distances at the intron side are higher as compared to the exon side. Keeping these distances in mind, the initial window size considered was of 9 base pair (bp) having 3bp at the exon end and 6bp at the intron start (including GT). In addition, four more window sizes i.e., 15bp, 20bp, 25bp and 30bp were also considered by taking more positions at the intron side because of the higher distance. In the five different window sizes, redundancy check was performed to analyze the percentage of
May, 2016]
Machine learning techniques for splice site identification
177
Downloaded From IP - 14.139.248.10 on dated 7-Jun-2016
www.IndianJournals.com
Members Copy, Not for Commercial Sale
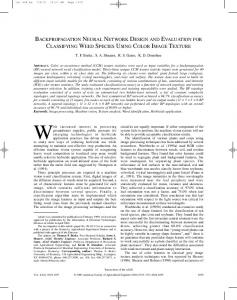
overlapped (identical) sequences present within and between TSS and FSS. The percentage of overlapping sequences for the 9bp window size in TSS as well between TSS and FSS is above 60% where as it is around 50% within FSS (Fig. 4). However, for the other window sizes viz., 15, 20, 25 and 30bp the percentage of identical sequences is less than 30. Hence, the 9bp window size was excluded and other four window sizes were considered for further prediction.
Fig. 5. Misclassification errors in RF, SVM and ANN for four different window sizes under different values of parameters. It can be seen that in all the three machine learning approaches, misclassification error (averaged over 5-fold) is lowest for 20bp window size. Here, misclassification error is the average of false positive (FP) and false negative (FN). The misclassification error was computed across different values parameter setting in RF, SVM and ANN
Fig. 4. Percentage of identical sequences within and between TSS & FSS. More than 60% of identical sequences are present within TSS and between TSS & FSS for 9bp window size. The percentage of identical sequences in other window sizes is less than 30
For each window size, misclassification error was obtained for all the three machine-learning approaches with different parameter combinations as mentioned in materials and methods and plotted in Fig. 5. It is observed that the misclassification error is lowest for the window size 20bp in all the three machine-learning techniques and considered as the optimum window size for final prediction. This implies that prediction accuracy is not necessary to increase with increase in the length of window size. A similar result has also been obtained in earlier study in human splice site prediction (Huang et al. 2006).
Default parameter setting in machine learning techniques does not always provide the best possible result and sometimes fine tuning of parameters are required to get maximum accuracy. Here, three parameters i.e., gamma for SVM, number of hidden units for ANN and number of variables to be chosen at each node in case of RF were optimized out of 10 values of parameters under each method. The optimum one was determined based on lowest misclassification error averaged over five-fold cross validation. For the window size of 20bp, the misclassification error was found minimum at mtry = 40, gamma = 0.05 and size of hidden layer = 5 for RF, SVM and ANN respectively (Fig. 6) and these parametric values were considered as optimum under respective method. The evolvement of machine learning techniques has been a boon for the scientific community working in the area of prediction or classification. SVM and ANN have been most commonly used in this area. However, the RF technique has been proved better
Downloaded From IP - 14.139.248.10 on dated 7-Jun-2016
www.IndianJournals.com
Members Copy, Not for Commercial Sale
178
Prabina Kumar Meher et al.
[Vol. 76, No. 2
Fig. 6. Misclassification errors in RF, SVM and ANN for 20 bp window size under 10 different values of parameters in each tecniques. It is observed that the misclassification error is lowest for RF at mtry=40; for SVM at gamma=0.05 and for ANN at number of hidden unit=5. These parameters were considered as optimum parameters and used in the final prediction model
over SVM and ANN in several benchmark studies since its induction. Since these techniques are more or less data dependent, choosing the better one is often a good practice. However, in the area of splice site detection they have been used independently. For this reason, a comparative analysis was carried out among these techniques using ROC and estimate of AUC. Using the optimum window size and parameter setting, the final prediction was made with ANN, SVM and RF using dataset that consist of 10000 encoded TSS and 10000 FSS motifs. The prediction was made through five-fold cross validation technique. The ROC curves are plotted for five differently encoded sets (Fig. 7) and AUC values with their standard error are also computed (Table 1). It can be seen from Table 1 Table 1.
Fig. 7. ROC curves of RF, SVM and ANN under five different encoding subsets. The ROC curves are plotted on the basis of test dataset averaged over 5-fold cross validation with the optimum parameter setting and window size of 20 bp length. It can be seen that ROC curve of RF is better than SVM and ANN in all the five different encoding subsets
that the AUC for RF is highest followed by SVM and ANN. Using a single dataset seems to be not sufficient in providing information regarding the success of encoding approach as far as consistency is concerned. So, it is required to use more number of non-overlapping
AUCs and their SE for ANN, SVM and RF under five different encoding subsets. It can be seen that the estimate of AUCs under RF is higher than that of ANN and SVM under all the encoding subsets
MLAs
Subset-1
Subset-2
Subset-3
Subset-4
Subset-5
ANN
0.929 (±0.001898)
0.928 (±0.00191)
0.927 (±0.001921)
0.930 (±0.00188)
0.929 (±0.00190)
SVM
0.939 (±0.001762)
0.941 (±0.00171)
0.940 (±0.00174)
0.939 (±0.00175)
0.938 (±0.00177)
RF
0.947 (±0.001637)
0.946 (±0.00164)
0.947 (±0.00164)
0.946 (±0.00164)
0.946 (±0.00165)
May, 2016]
Machine learning techniques for splice site identification
Downloaded From IP - 14.139.248.10 on dated 7-Jun-2016
www.IndianJournals.com
Members Copy, Not for Commercial Sale
subsets for the encoding to check the consistency of the encoding approach as far as prediction accuracy is concerned. Therefore, five non-overlapping subsets were used for the encoding approach and observed that in each case the performance (AUC) of the machine learning techniques are consistent in all the five differently encoded dataset. Also, it is seen that RF is consistently better than ANN and SVM in all the five encoded dataset. Thus, it is inferred that the RF can be used efficiently in place of SVM and ANN for the prediction of donor splice sites in rice. A comparative analysis among SVM, ANN and RF revealed that the RF was better than that of SVM and ANN in terms of estimate of AUC measured over five-fold cross validation technique. Hence, it is concluded that RF can be used as a feasible alternative to ANN and SVM for the prediction of donor splice sites in rice with high prediction accuracy. Further, the proposed encoding approach can also be used to encode the sequence data of other functional elements like splicing enhancer, splicing repressor, glycosylation site etc. Acknowledgements The authors sincerely acknowledge the Indian Agricultural Statistics Research Institute funded project having project code as AGENIASRISIL 201301300014 and the SCGL Facility developed under ICAR-NAIP grant NAIP/Comp-4/C4/C-30033/2008-09. References Baten A., Chang B., Halgamuge S. and Li J. 2006. Splice site identification using probabilistic parameters and SVM classification. BMC Bioinformatics, 7(Suppl 5): S15. Bergmeir C. and Benýtez J. M. 2012. Neural Networks in R Using the Stuttgart Neural Network Simulator. J. Stat. Soft., 46(7): 1-26. Bradley A. P. 1997. The use of the area under the ROC curve in the evaluation of machine learning algorithms. Pattern Recogn., 30: 1145-59. Breiman L. 1996. Bagging predictors. Mach Learn., 24(2): 123-140. Breiman L. 2001. Random Forests. Mach Learn., 45: 532. Breiman L., Freidman J. H., Olshen R. A. and Stone C. J. 1984. Classification and Regression Trees. Chapman and Hall, New York. Bureau A., Dupuis J., Falls K., Lunetta K. L., Hayward B., Keith T. P. and Van Eerdewegh P. 2005. Identifying snps predictive of phenotype using random forests.
179
Genet. Epidemiol., 28(2): 171-182. Burge C. and Karlin S. 1997. Prediction of complete gene structure in human genomic DNA. J. Comput. Biol., 268(1): 78-94. Chen Y., Liu F., Vanscheonwinkel B. and Manderick B. 2009. Splice site prediction using support vector machines with context-sensitive kernel functions. J Univers Comput Sci., 15(13): 2528-2546. Comaniciu D., Ramesh V. and Meer P. 2003. Kernelbased object tracking. IEEE Trans Pattern Anal Mach Intell., 25(5): 564-577. Degroeve S., De Baets B., Van de Peer Y. and Rouz P. 2002. Feature subset selection for splice site prediction. Bioinformatics, 18: S75-S83. Dehzangi A., Phon-Amnuaisuk A. and Dehzangi O. 2010 Using random forest for protein fold prediction problem: An empirical study.J. Inf. Sci. Eng., 26(6): 1941-1956. Fawcett T. 2006. An introduction to ROC analysis. Pattern Recogn. Lett., 27: 861-874. Hamby S. E. and Hirst J. D. 2008. Prediction of glycosylation sites using random forests. BMC Bioinformatics, 9(1): 500. Huang J., Li T., Chen K. and Wu J. 2006. An approach of encoding for prediction of splice sites using SVM. Biochemie, 88: 923-929. Khalilia M., Chakraborty S. and Popescu M. 2011. Predicting disease risk from highly imbalanced data using random forest. BMC Med. Inform. Decis. Mak., 11: 51. Lee J., Lee J., Park M. and Song S. 2005. An extensive comparison of recent classification tools applied to microarray data. Comput. Stat. Data An., 48: 869885. Liaw A. and Wiener M. 2002. Prediction and regression by random Forest. Rnews, 2: 18-22. Meher P. K., Sahu T. K., Rao A. R. and Wahi S. D. 2014a. Determination of window size and identification of suitable method for prediction of donor splice sites in rice (Oryza sativa) genome. J. Plant Biochem. Biotechnol., DOI 10.1007/s13562-014-0286-2. Meher P. K., Sahu T. K., Rao A. R. and Wahi S. D. 2014b. A statistical approach for 5’ splice site prediction using short sequence motif and without encoding sequence data. BMC Bioinformatics, 15: 362. Meng Y., Yu Y., Cupples L., Farrer L. and Lunetta K. 2009. Performance of random forest when snps are in linkage disequilibrium. BMC Bioinformatics, 10(1): 78. Meyer D., Dimitriadou E., Hornik K., Weingessel A., Leisch F., Chang C. C. and Lin C. C. 2012. e1071: Misc functions of the Department of Statistics (e1071), TU Wien, R package version 1.6-1.
180
Prabina Kumar Meher et al.
Patterson D. J., Yasuhara K. and Ruzzo W. L. 2002. PremRNA secondary structure prediction aids splice sites prediction. Pac. Symp. Biocomput., 223-234.
Sun Y. F., Fan X. D. and Li Y. D. 2003. Identifying splicing sites in eukaryotic RNA: support vector machine approach. Comput. Biol. Med., 33: 17-29.
Pertea M., Lin X. and Salzberg S. L. 2001. GeneSplicer: a new computational method for splice site prediction. Nucleic Acids Res., 29(5): 1185-1190.
Weber R. 2001. DNA splice sites prediction with kernels and voting. Proceedings of international conference on mathematical and engineering techniques in medicine and biological science, Nevada.
Rajapakse J. and CaH L.S. 2005. Markov encoding for detecting signals in genomic sequences. IEEE/ACM Trans. Comput. Biol. Bioinform., 2(2): 131-142.
Downloaded From IP - 14.139.248.10 on dated 7-Jun-2016
www.IndianJournals.com
Saeys Y., Degroeve S., Aeyels D., Rouzé P. and Van de Peer Y. 2004. Feature selection for splice site prediction: A new method using EDA-based feature ranking. BMC Bioinformatics, 5: 64.
Members Copy, Not for Commercial Sale
[Vol. 76, No. 2
Wei D., Zhang H., Jiang Q. and Wei Y. 2012. A New Classification Method for Human Gene Splice Site Prediction. Proceedings of the first international conference on health and science, Beijing, China: 121-130.
Sonnenburg S., Ratsch, G., Jagota, A. and Muller K. R. 2002. New methods for splice site recognition. Proceedings of the international conference on artificial neural networks, 2415: 329-336.
Wu B., Abbott T., Fishman D., McMurray W., Mor G., Stone K., Ward D., Williams K. and Zhao H. 2003. Comparison of statistical methods for classification of ovarian cancer using mass spectrometry data. Bioinformatics, 19(13): 1636-1643.
Sonnenburg S., Schweikert G., Philips P., Behr J. and Rätsch G. 2007. Accurate splice site prediction using support vector machines. BMC Bioinformatics, 8 (Suppl 10): S7.
Zien A., Ratsch G., Mika S., Scholkopf B., Lengauer T. and Muller K. 2000. Engineering support vector machine kernels that recognize translation initiation sites. Bioinformatics, 16(9): 799-807.