Both the input clinical data and the consultant decisions were treated on a ... network to provide reliable decision support for lower-third-molar treatment ...
Performance of a Neural Network Trained to Make Third-molar Treatment-planning Decisions MARK R. BRICKLEY, PhD, MScD, BDS, JONATHAN P. SHEPHERD, PhD, MSc, BDS The authors developed and tested 12 neural networks of different architectures to make lower-third-molar treatment-planning decisions, using a software-based neural network (Neudesk 1.2, Neural Computer Sciences, Southampton, UK). Network training was undertaken using clinical histories from 119 patients (with 238 lower third molars) referred for treatment planning (79 females and 40 males, mean age 25 years) together with output data consisting of actual treatments planned by a senior oral surgeon. Both the input clinical data and the consultant decisions were treated on a tooth-wlse basis and were coded to numerical values. Binary data (e.g., present/absent) were coded to 1 and 0, while quantitative data (e.g., age) were scaled to fall between 0 and 1. A network based on the optimal architecture was trained and then interrogated with test data derived from a further 174 patients (119 females and 55 males, mean age 26 years) with 348 lower third molars. Network decisions were dichotomized with a threshold of 0.8. With no knowledge of the network decisions, the senior oral surgeon indicated his preferred treatments. The teeth were then assigned to “gold-standard” categories of lndlcatlons present or absent based on National Institutes of Health consensus criteria. Against this, the network achieved a sensitivity of 0.78, which was slightly Inferior to that of the oral surgeon (0.88) although this difference was not significant, and a specificity of 0.98, compared with 0.99 for the oral surgeon (p = NS). Agreement between the oral surgeon and network decisions was very high (kappa = 0.850). This study demonstrates that It Is possible to train a neural network to provide reliable decision support for lower-third-molar treatment planning. Key words: Decision support; neural network; third molars, (Med Decis Making 1996; 16:153-160)
For such a high-volume procedure, it is particularly important to audit and improve treatment planning, because even small changes in policy may result in substantial changes in overall cost and in the numbers of patients with complications, in both the public and the private sectors. Neural networks provide one possible approach to improving decision making.
The removal of third molars utilizes substantial resources in the United Kingdom’ and in other western countries. In the United Kingdom alone, expenditures for this procedure amounted to approximately 622 million in the health insurance sector and~R35 million in the state-support service during 1993. Furthermore, there is evidence that the numbers of lower third molars being removed are rising both in general practice and in the hospital service in the United Kingdom. There are many possible reasons for this increase, including increasing awareness of the possibility of unerupted teeth, the use of panoral radiography,’ and reduction in the caries rate. Whatever the reason, this procedure has an important place in the provision of oral care, and all the indications are that it will continue to do so.
Neural Networks In a limited way, neural networks replicate some of the functions of the brain. In particular, neural networks have the ability to “learn” from information presented to them. Neural networks have been used to model the decision-making process in several areas of medicine. Perhaps the most obvious application is to model processes and disorders of the nervous system. A recent study modeled Parkinson’s disease using a closed-loop (or recurrent) neural network to reproduce the typical pattern of muscle activity seen in this disease. The authors also reproduced the effects of therapy.’ Neural networks
Received July 11, 1994, from the Clinical Decisions Research Group, Department of Oral Surgery, Medicine and Pathology, Dental School, University of Wales College of Medicine, Heath Park, Cardiff, CF4 4XY, Wales. Revision accepted for publication September 15, 1995. Address correspondence and reprint requests to Dr. Brickley. 153
154
l
Brickley, Shepherd
have also been used to model schizophrenia 4 and Alzheimer’s disease.’ Many other recent studies have utilized neural networks in this area.6-18 Considerable research has also been undertaken into applications of neural networks for the modeling of cardiac health and disease. 19-23 Research has been especially targeted at automatic processing of electrocardiograms (ECGs) and understanding their meanings, tasks for which neural networks are well suited. For example, one study examined the use of a neural network to recognize a particular subset of the ECG-wave pattern (ST-T segment).24,25 Neural networks have also been applied to screening for and diagnosis of neoplasia.26 For example, one study27 developed a neural network to detect melanoma. In an investigation28 in which neural networks were applied to the assessment of cervical smears, a network correctly categorized 98% of 524 cell images as being either normal or abnormal. Several studies have focused on other tumors. 29-37 Neural networks have been used to interpret radiographs: a network has been devised to categorize the features of neonatal chest radiographs.38 The neural network achieved greater agreement with two clinicians than they did with each other. Neural networks have also been applied to problems in pathology and laboratory tests; these applications have been comprehensively reviewed.” Neural networks have been developed for use in anesthesia monitoring systems. 40 Other studies have used networks to predict lengths of hospital stay” and likelihoods of admission:’ However, little research has been undertaken on applications of this technique to dentistry. The network architecture (or design structure1 used in this study is the feed-forward type (see below). This type of network has many biomedical applications. The network consists of three layers; an input layer, a “hidden” intermediate layer, and an output layer. Each layer contains one or more “nodes,” which are the basic elements from which a network is conceptually constructed. A node (synonymous with a “neuron”1 effectively acts as a very simple computer, in that it processes information regarding the size of the signal on each of its input connections (“synapses”) to produce a graded output signal that has a defined relationship to the weighted sum of the inputs. The particular relationship between input strength and output depends on the mathematical configuration used, but is always a predictable relationship. The output signal of each node then becomes one of the input signals, for each node in the next-lower network layer, after modification by a “weighting” factor that can be considered to be similar to the “resistance”of the connections. In the network considered here (as well as in many others) the system is fully con-
MEDICAL DECISION MAKING
nected: each node within a layer synapses with every node in the layer above it. During operation, no feedback of information either backwards to earlier layers or sideways within a layer is allowed. This type of network architecture is called “feed-forward.” Information input and output are always presented as numerical values, although these values are often derived from coding of non-numerical information. The network is at first untrained, and any given pattern of input information will give a meaningless (though not random) output. Therefore, before the network can be used it must be trained. The training process, which is iterative, is undertaken by presenting the network with information for which the appropriate outputs or results are known, together with those outputs. For example, data relating to clinical history, examination, and treatment given can be entered to train a network to make decisions about treatment for future cases. During the training sequence, the network produces a “guessed’ output for each set of inputs and compares this with the known actual value, producing an error value. These error values are then used to adjust the weightings on each synapse in such a way as to improve the performance (using backpropagation). 43 The process is repeated many times in a cyclic fashion until the performance of the network is optimal. Each iteration around the training cycle is known as an epoch. Either undertraining or overtraining can result in poor network performance. When training cycles (epochs) are insufficient, the network weights will not have adjusted sufficiently from their initial randomized states to maximize the performance of the network. However, it is also possible to overtrain the network, (analogous to overfltting in logistic regression techniques) in which case the network will produce a very low error with the training set (indicating that the outputs given for this data set closely match the known results1 but will not perform well when making decisions based on other data; that is, the network loses its ability to generalize. It follows from this that there exists an optimal number of epochs for a given network architecture; only when trained for that number of epochs will the network perform optimally. It is important to stop training at this optimal number of epochs, known as the training end point. It is not possible to select an appropriate end point by use of the training set error alone, since this will reduce continuously beyond the optimal end point. The training end point can, however, be derived by cross-validation. Cross-validation consists of reserving a proportion of the training set (as the cross-validation set). At the end of each training cycle this cross-validation set is used to test the network and the resultant error is calculated for the
VOL 16/NO 2, APR-JUN 1996
cross-validation set (cross-validation error). The cross-validation error will be seen to fall with each epoch prior to the optimal end point (as the network weights are optimized), will reach a minimum at the optimal training end point, and will then rise with each subsequent training cycle (as the network becomes overtrained). Following determination of the optimal training end point, the network can be trained a second time from an initial randomized state using the whole training set for this optimal number of epochs. This results in an optimally trained network. The trained network can be used to predict output values for new sets of unknown information. For example, clinical decisions might be made by the network based on clinical information presented as input to the network. The study described here compared lower-thirdmolar treatment-planning decisions made by several neural networks of differing architectures, developed a definitive network based on the optimal architecture, and then compared decisions made by this network with those of a senior oral surgeon.
Method Patients who attended the Department of Oral Surgery, University Dental Hospital of Wales, for treatment planning regarding their third molars were examined and interviewed by an independent research worker. The information that was collected included: demographic data; the degree of eruption of each third molar; whether the patient had experienced pericoronitis, and, if so, any treatment that had been provided; and the presence of any disease currently associated with each lower third molar, such as pericoronitis, periodontal disease, cyst formation, and caries in the third molar or in the distal aspect of the second molar. To assess whether any periodontal disease affecting the third molar was present, measurements of periodontal probing depth distal to the lower second molar, plaque retention, intrabony defects associated with the distal aspect of the second molar, and the sagittal inclination of the third molar were recorded. These variables are those reported by Kugelberg44 as being important in relation to periodontal disease associated with third molars. Probing depth measurements were made using a Williams 14W periodontal probe. Referrals from senior orthodontists were also logged. Immediately following this clinical examination, a panoramic radiograph was studied by a dentally qualified research worker, who noted the presence of any cystic change around each unerupted third molar and any resorption of the adjacent tooth. Cys-
Neural Network in Dentistry Treatment Decislons
Table 1
l
l
155
Coding Scheme for Clinical Information
Variable
Age Gender Smoking status Social class Trismus of mandible Mouth opening Previous active orthodontic care Orthodontic request for removal Eruption status of third molar Pericoronitis Swelling around tooth Caries Periodontal disease Cystic change Resorption of third molar
Coding Method Numeric Two separate input nodes for gender Binary (yes/no) Scare 1 to 5 Binary (yes/no) Numeric Binary (yes/no) Binary (yes/no) Scale 0 to 1 Three separate binary variables: Pericoronltis yes/no, Multiple episodes, Current pericoronitis Binary (yes/no) Two separate binary variables for caries in third molar and adjacent tooth Two variables for bleeding on probing and for pocket depth adjacent to third molar Binary (yes/no) Binary (yes/no)
tic change was defined as a widening of the follicular space of more than 3 mm. These data were then presented to a senior oral surgeon who had no knowledge of the identities of the patients. For each lower third molar, the oral surgeon indicated whether he would schedule that tooth for removal. Once this data collection was complete, the original clinical data were coded numerically, as were the oral surgeon’s decisions. Table 1 presents the details regarding the variables used and how these were coded. Most variables were dichotomous and were coded with a value of 1 for a positive reply and a value of 0 for a negative reply. Age was scaled on a linear scale to fit the range 0 and 1, with an age of 10 years scaled to 0 (third molars are never removed in patients younger than 10) and an age of 90 years scaled to 1. Gender was input as two separate nodes (male/female) with one of the nodes assigned a value of 1 while the other was assigned a value of 0. Social class was placed on a five-point O-l interval scale, with higher social classes being assigned a lower number (atcording to the social classification scale widely used in the United Kingdom). Maximal mouth-opening was scaled on a linear O-l scale using 30 mm as a minimum and 7.5 mm as a maximum value. Eruption status was scaled on a 3-point scale (0 = unerupted, 0.5 = partially erupted, 1 = fully erupted). Periodontal pocket depths were scaled on a linear O-l scale with 0 mm as a minimum and 15 mm as a maximum. These coded data were used to train a neural network running on network simulation soft-
156
l
Table 2
Brickley, Shepherd
l
NIH Consensus Criteria for Lower-third-molar Surgery
Single episode of pericoronitis and recurrent pericoronitis Unrestorable caries in third molar tooth Distal caries in adjacent tooth (where removal of third molar would aid restoration) Peridontaf disease (later defined in more detail by Kugelberg) Evidence of follicular enlargement Resorotion of third molar tooth or adjacent tooth
ware (Neudesk 2.0, Neural Computer Sciences, Southampton, UK). The output data were always coded to a single variable. The training output data were obtained from consultant oral surgeons’ treatment decisions regarding the training cases. A decision to schedule the third molar for removal was assigned a value of 1, while a non-intervention decision was assigned a value of 0. Clinical information for 119 patients with 238 lower third molars attending for lower-third-molar treatment planning (79 females, 40 males, mean age 25 years) was included in the training-data set. Thus, the ratio of the number of teeth comprising the training-data set to the number of input variables was 12.55:1. Training output data consisted of clinical decisions regarding the need for removal of lower third molars; the oral surgeon elected to schedule 118 lower third molars for removal. Training was completed in two phases. During phase one, the optimal training end point (i.e., the number’ of iterative training cycles that produced the optimal network) was selected, and, in phase two, each network was trained to this point. During phase one, a cross-validation subset consisting of 20% of the training data (43 teeth) was utilized to determine the optimum training end point. This validation set was randomly selected from the training data. After each training cycle, the error produced by the network against this cross-validation set was calculated. The optimal training end point was the number of cycles at which this cross-validation error was minimal. During training phase two, each network was trained using the whole of the training set (119 cases; 238 teeth) for this optimal number of training cycles to yield an optimally trained network. Training was largely independent of the number of cases used, but since all training cycles took the same amount of time to perform (approximately 1 minute), overall training time was directly dependent on the number of training cycles. This process resulted in a network whose output was on a numerical scale between 0 and 1. This output variable was continuous in the sense that for a given pattern of input data the network could yield any value between 0 and 1. However, since the output training data (the senior oral surgeon’s decisions for teeth in this training-data set) contained only bi-
MEDICAL DECISION MAKING
nary extract/do-not extract information, which was coded at the training stage by assigning a do-not‘extract decision a value of 0 and an extract decision a value of 1, it was necessary to change the continuous output of the trained network into a binary extract/do-not-extract dichotomous format. This was achieved by use of a cutoff value (lying between 0 and 1). Network outputs below this cutoff were treated as do-not-extract‘ decisions, while those above it were treated as extract decisions. A value of this cutoff point that obtained optimal agreement between the raw net decisions and the oral surgeon’s decisions for each network architecture tested was calculated as follows: the cutoff point was varied between 0 and 1 in ten stages. At each cutoff point, the raw network outputs for each test case were compared with the cutoff point and placed in a treat/no-treat category. The resultant binary treatment decisions were then compared with the human consultant’s decisions to calculate crude agreement and kappas. The kappa values calculated for the individual cutoff points were compared to determine the optimal cutoff value for dichotomization. Ten networks that had between one and ten nodes in a single hidden layer were evaluated. Two further networks with two hidden layers and two or three nodes in each hidden layer were also evaluated. Each network was trained to the optimal level by cross-validation within the training set. Following training, each network architecture was tested against a test data set. Clinical information from a further 178 patients (119 females, 55 males, mean age 24 years) with 348 lower third molars was included in the test data set. These cases were collected and documented in the same manner as those in the training set by the same research worker. The data were presented to the same oral surgeon, who stated whether he would have removed each lower third molar. The oral surgeon made these decisions without knowing the networkgenerated decisions. Following this process, the network decisions derived from the various network architectures were compared with those of the oral surgeon: kappa values and crude agreement rates were calculated to determine how closely the network decisions and the oral surgeon’s decisions matched one another. The network decisions and the oral surgeon’s decisions were also compared with the optimal treatment decisions that would have been made if the most widely agreed upon consensus criteria (the NIH criteria? had been rigidly followed (table 2 ) . The “gold standard’ decisions were decided upon by three oral surgeons, who were asked to apply the NIH criteria regardless of whether they felt this yielded an optimal decision. Although the NIH stan-
Neural Network In Dentistry Treatment Decisions
VOL 16/NO 2, APR-JUN 1906
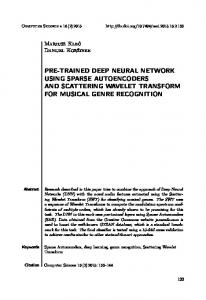
Results The optimal number of training cycles (epochs) was found to be between 70 and 75. Figure 1 shows T
o.l\ 0
10
20
30
40
50,
do
70
80
so
loo
110
120
130
140
100
160
Training Cycle (epochs) FIGURE 1. Reduction in neural network training cycle error with iterative training cycles (epochs).
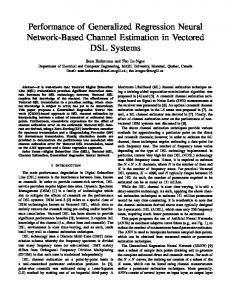
- Cross validation error
Training Cycle (epochs) FIGURE
157
the reduction of training-cycle error of the optimal network architecture (discussed below) measured at the end of each training cycle over a deliberately extended training period, while figure 2 demonstrates that the validation error reached a minimum after 70 iterations around the training cycle (epochs), this being the optimal end point for training. Raw network data were dichotomized by selecting a cutoff point above which the network output was taken to indicate a decision to remove the lower
dard is fairly well defined, some areas of controversy still exist, in particular in relation to a single episode of pericoronitis. Nevertheless, it represents the best available standard, and calculations of sensitivity and specificity were based on it.
0.45
l
2. Reduction in neural network error on a cross-validation set with iterative training cycles (epochs).
158
l
Brickley, Shepherd
0.1
MEDICAL DECISION MAKING
0.2
0.3
0.4
0.6
0.5
0.7
0.9
0.8
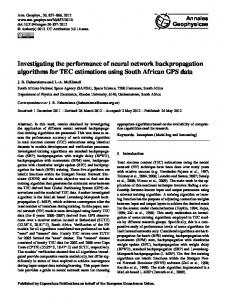
Cutoff utilized for dichotomized network output” to an extract/do not extract decision Variation in agreement (kappa) between the neural network and the oral surgeon with various cutoff points for dichotomizing network output to an extract/do-not-extract decision.
F IGURE 3.
third molar. Figure 3 shows the variation in agreement (kappa) obtained between decisions resulting from dichotomizing the outputs from the optimal network using ‘a cutoff value and the oral surgeon’s’ decisions for the same series of test cases as the cutoff point was varied between 0 and 1. Agreement between the network and the consultant was maximized using a cutoff point of 0.8 (that is, when the raw network outputs of less than 0.8 were assigned to “not scheduled for removal” while outputs of greater than 0.8 were taken to represent removal decisions), and this cutoff value was used in subsequent analysis. Table 3 presents data regarding agreement between the neural network decisions and oral surgeon’s decisions with different network architectures. Both crude percentage agreements (i.e., the percentage of decisions in which the network and the oral surgeon agreed) and kappas, which include corrections for the agreements that might be expected by change, are shown. Very little variation in agreement was seen with the different network architectures, there being no significant difference between architectures. However, the optimal network performance occurred with a single hidden layer of Table 4
l
Table 3
l
Differences in Rates of Crude Agreement and Kappa between a Consultant Oral Surgeon and Neural Networks Trained to Make Lower-thirdmolar Treatment-planning Decisions
Neural Network Architecture
Kappa
Agreement
1 node In 1 hidden layer 2 nodes in 1 hidden layer 3 nodes in 1 hidden layer 4 nodes in 1 hidden layer 5 nodes in 1 hidden layer 8 nodes in 1 hidden layer 7 nodes in 1 hidden layer 8 nodes in 1 hidden layer 9 nodes In 1 hidden layer 10 nodes In 1 hidden layer 2 nodes in each of 2 hidden layers 3 nodes In first hidden layer, 2 In a second hidden layer
0.83784 0.85004 0.8357 0.83837 0.84281 0.82949 0.83573 0.84281 0.82882 0.84948
0.928
0.82882
0.925
0.84281
0.931
0.934
0.928 0.928 0.931 0.925 0.928 0.931 0.925 0.934
two nodes. This network achieved a kappa of 0.850 and a crude agreement of 93.4%. This network was therefore subsequently used to estimate sensitivity and specificity. True-positive, true-negative, false-positive, and false-negative values are shown in table 4 for the
Performances of a Senior Oral Surgeon and a Neural Network In Relation to NIH “Gold-standard” Criteria for Treatment Planning of Lower-third-molar Surgery
Oral surgeon Neural network
True Positive
False Positive
True Negatlve
False Negative
Speclflolty
Sensltlvlty
117 104
5 3
210 212
18 29
0.98 0.99
0.88 0.78
VOL 16/NO 2, APR-JUN 1996
decisions of the neural network and the oral surgeon as judged against the NIH consensus criteria. Sensitivity and specificity are also shown. The sensitivity or specificity values of the network and the oral surgeon were not significantly different.
Discussion These data demonstrate that in more than 90% o f cases a neural, network can be trained to emulate decisions made by a senior oral surgeon regarding the need to remove a given lower third molar. Earlier work demonstrated that this is a much higher rate of agreement than is achieved between clinicians.46 The network and the oral surgeon could not be differentiated in terms of sensitivity or specificity values when checked against the NIH standard. Although debate still exists as to how tarnished or otherwise this “gold” standard is, this study demonstrates that computer neural networks can emulate a given oral surgeon’s performance with a high degree of accuracy. Several networks might be trained to encompass differing treatment philosophies of different oral surgeons. Research has already demonstrated that there are wide small-area differences between scheduled treatments in terms of both health care units and individual surgeons, 47 and that current practice (in the U.K) is unsatisfactory because vvidely varying operation rates cannot possibly reflect different disease levels for patient populations. One use of a network such as the one presented here might be to facilitate uniform treatment planning based on consensus criteria. Further development of the network presented here should be undertaken. In particular, it would be useful to examine the interdependency of the input variables for the optimal network to determine whether it would be possible to simplify the data set. However, the current data set contains only information that is routinely collected during clinical practice and is thus readily available. Neural networks such as the one presented here are only one of several multivariate techniques, and the problem of improving the rationality of third-molar treatment planning could possibly be addressed by application of other techniques, such as logistic regression. However, neural networks have the advantage of using clinical data and thus lend themselves to rapid redevelopment, for example, to incorporate new treatment philosophies. Further research should be undertaken to compare the network presented here with other techniques. For a high-volume, high-cost procedure such as removal of third molars, small changes in treatment philosophy could result in large savings in terms of both costs and patient morbidity. In the United King-
Neural Network in Dentistry Treatment Decisions
l
159
dom alone, in the year 1992-93, 48,200 third-molar procedures were performed (usually removal of both lower third molars with general anesthesia) at a cost of E2l million in hospital practice, while a further 41,000 such procedures were performed in general dental practice at a cost of El.5 million. In addition, although precise figures are unavailable, approximately 20,000 more procedures were performed under private health care arrangements, at a cost of 627 million. 47 In relation to third molars, there is little uniformity of policy, and many procedures are being undertaken inappropriately.” In our study, between 20% and 30% of lower-third-molar removals were found to have been undertaken without justification according to NIH criteria; considering teeth that did not fulfil the criteria for removal, 78% were nevertheless scheduled for removal. The network developed in this study could, if implemented in an appropriate format, be used to provide decision support in this area, leading to reduction of false-positive diagnoses from 20-30% to 2-3%. This could potentially save E10-12 million per annum in the U.K. and, according to the incidence of permanent nerve damage reported by Blackburn and Bramley following third-molar surgery, result in 60-70 patients’ avoiding permanent numbness of the lip and tongue each year in the U.K. alone. It is, however, important to note that these changes would require significant modification of current practice and a disinvestment in decisions made by oral and maxillofacial surgeons. Neural networks provide one method of improving the rationality of third-molar treatment planning by providing a means of introducing uniformity and adherence to the best standards of care. Implementation is, of course, another matter.
References 1. 2.
3. 4. 5.
6. 7. 8.
Shepherd JP, Jones GM. Trends in oral surgery practice. Br Dent J. 1987;175:237-40. Osman F, Scully C, Dowel1 TB, Davies RM. Use of panoramic radiographs in general dental practice in England. Community Dent Oral Epidemiol. 1986;14:8-9. Borrett DS, Yeap TH, Kwan HC. Neural networks and Parkinson’s disease. Can J Neurol Sci. 1993;20:107-13. Cohen JD, Servan-Schreiber D. Context, cortex, and dopamine: a connectionist approach to behavior and biology in schizophrenia. Psycho1 Rev. 1992;99:45-77. Kippenhan JS, Barker WW, Pascal S, Nagel J, Duara R. Evaluation of a neural-network classifier for PET scans of normal and Alzheimer’s disease subjects. J Nucl Med. 1992;33: 1459-67. Carrie JR. Evaluation of a neural network model of amnesia in diffuse cerebral atrophy. Br J Psychiatry. 1993;163:217-22. Humphreys GW, Freeman TA, Muller HJ. Lesioning a connectionist model of visual search: selective effects on distractor grouping. Can J Psychol. 1992;46:417-60. Jamieson PW. A computational model of levodopa pharma-
160 . Brickley, Shepherd
codynamics in Parkinson’s disease. Clin Neuropharmacol. 1991;14:498-513. 9. Kemp B. Cerebral information processing estimated by unpredictability of the EEG. Clin Neurol Neurosurg. 1992;94 suppl:S103-5. 10. Kosugi Y, Sase M, Kuwatani H, et al. Neural network mapplng for nonlinear stereotactic normalization of brain MR images. J Comput Assist Tomogr. 1993;17:455-60. 11. Kruschke JK. Alcove: an exemplar-based connectionlst model of category learning. Psycho1 Rev. 1992;99:22-44. 12. Neilson PD. The problem of redundancy in movement control: the adaptive model theory approach. Psycho1 Res. 1993; 55:99-106. 13. Parks RW, Levine DS, Long DL, et al. Parallel distributed processing and neuropsychology: a neural network model of Wisconsin card sorting and verbal fluency. Neuropsychol Rev. 1992;3:213-33. 14. Pfurtscheller G, Flotzinger D, Mohl W, Peltoranta M. Prediction of the side of hand movements from single-trial multichannel EEG data using neural networks. Electroencephalogr Clin Neurophyslol. 1992;82:313-5. 15. Rosenbaum DA, Engelbrecht SE, Bushe MM, Loukopoulos LD. A model for reaching control. Acta Psychol. 1993;82(131:237-50. 16. Schaltenbrand N, Lengelle R, Macher JP. Neural network model: application to automatic analysis of human sleep. Comput Biomed Res. 1993;26:157-71. 17. Swihart SL, Matheny A. Classification of chromatic visual evoked potentials wlth the aid of a neural net. Comput Biol Med. 1992;22:165-71. 18. Vlnogradov S, King RJ, Huberman BA An associationist model of the paranoid process: application of phase transitions in spreading activation networks. Psychiatry. 1992;56: 79-94. 19. Allen J, Murray A Development of a neural network screening aid, for diagnosing lower limb peripheral vascular disease from photoelectric plethysmography pulse waveforms. Physiol Meas. 1993;14:13-22. 20. Astion ML, Wener MH, Thomas RG, Hunder GG, Bloch DA. Application of neural networks to the classification of giant cell arteritis. Arthritis Rheum. 1994;37:760-70. 21. Farrugia S, Yee H, Nickolls P. Implantable cardloverter defibrillator electrogram recognition with a multilayer perceptron. Pace -Pacing & Clinical Electrophysiologv. 1993;16(1 Pt 2):228-34. 22. Suzuki Y, Ono K. Personal computer system for ECG STsegment recognition based on neural networks. Med Biol Eng Comput. 1992;30:2-8. 23. Zelicoff AP. Myocardial infarction prediction by artificial neural networks [letter; commentl. Ann Intern Med. 1992; 116:701; discussion 702. 24. Edenbrandt L, Devine B, Macfarlane PW. Classification of electrocardiographic ST-T segments-human expert vs artificial neural network. Eur Heart J. 1993;14:464-8. 25. Edenbrandt L, Devine B, Macfarlane PW. Neural networks for classification of ECG ST-T segments. J Electrocardlol. 1992;25:167-73. 26. Maclin PS, Dempsey J, Brooks J, Rand J. Using neural networks to diagnose cancer. J Med Syst 1991;15:11-9. 27. Cohen ME, Hudson DL, Banda PW, Blois MS. Neural network approach to detection of metastatic melanoma from chromatographic analysii of urine. Proceedings of the Annual
MEDICAL DECISION MAKING
Symposium on Computer Applications in Medical Care, 1991;295-9. 28. Mango LJ. Computer-assisted cervical cancer screening using neural networks. Cancer Lett. 1994;77:155-62. 29. Astion ML, Wilding P. Application of neural networks to the interpretation of laboratory data in cancer diagnosis [see comments]. Clin Chem. 1992;38:34-8. 30. Goldberg V, Manduca A, Ewert DL, Glsvold JJ, Greenleaf JF. Improvement in specificity of ultmsonography for diagnosis of breast tumors by means. of artificial intelligence. Med Physics. 1992;19:1475-81. 31. Maclln PS, Dempsey J. Using an artificial neural network to diagnose hepatic masses. J Med Syst. 1992;16:215-25. 32. Ostrem JS, Valdes AD, Edmonds PD. Application of neural nets to ultrasound tissue characterization, Ultrasonic Imaging. 1991;13:298-9. 33. Prater JS, Richard WD. Segmenting ultrasound images of the prostate using neural networks. Ultrasonic Imaging. 1992;14: 159-85. 34. Ravdin PM, Clark GM, Hilsenbeck SG, et al. A demonstration that breast cancer recurrence can be predicted by neural network analysis. Breast Cancer Res Treat. 1992;21:47-53. 35. Ravdin PM, Clark GM. A practical application of neural network analysis for predicting outcome of individual breast cancer patients. Breast Cancer Res Treat. 1992;22:285-93. 36. Tourassi GD, Floyd CE Jr. Artificial neural networks for single photon emission computed tomography. a study of cold lesion detection and localization. Invest Radiol. 1993;28:6717. 37. Wu Y, Giier ML, Doi K, Vyborny CJ, Schmidt BA, Metz CE. Artificial neural networks in mammography: application to decision making in the diagnosis of breast cancer. Radiology. 1993;187:81-7. 38. Gross G, Boone J, Greco-Hunt V, Greenberg B. Neural networks in radiologic diagnosis: II. Interpretation of neonatal chest radiographs. Invest Radiol. 1990;25:1017-23. 39. Astion ML, Wilding P. The application of backpropagatlon neural networks to problems in pathology and laboratory medicine. Arch Pathol Lab Med. 1992;116:995-1001. 40. Mylrea KC, Orr JA, Westenskow DR. Integration of monitoring for intelligent alarms in anesthesia: neural networkscan they help? J Clin Monlt. 1993;9:31-7. 41. Tu JV, Guerriere MR. Use of a neural network as a predictive instrument for length of stay in the intensive care unit following cardiac surgery. Comput Biomed Res. 1993;26:220-9. 42. Somoza E, Somoza JR A neural-network approach to predicting admission decisions in a psychiatric emergency room. Med Decis Making. 1993;13:273-80. 43. Rumelhart D, McClelland J. Parallel Distributed Processing. Cambridge, MA: MIT Press, 1986. 44. Kugelberg CF. Third molar surgery [review]. Current Opinion in Dentistry. 1992;2:9-16. 45. Guralnlck G, Laskin D. NIH Consensus Development Conference for the Removal of Third Molars. J Oral Surg. 1980;38: 235-6. 46. Brickley MR, Kay EJ, Shepherd JP. Validity of treatment decisions in lower third molar surgery. J Dent Res. 1993;73:109. 47. Toth B. The appropriateness of prophylactic extraction of impacted lower third molars. Bristol, U.K.: University of Brlsto1, 1993. 48. Brickley M, Shepherd J, Mancini G. Comparison of clinical treatment decisions with US National Institutes of Health consensus indications for lower third molar removal. Br Dent J. 1993;175:102-5.