Abstract. We propose a new type of unsupervised, growing, self-organizing neural network that expands it- self by following the taxonomic relationships that exist.
J Mol Evol (1997) 44:226–233
© Springer-Verlag New York Inc. 1997
Phylogenetic Reconstruction Using an Unsupervised Growing Neural Network That Adopts the Topology of a Phylogenetic Tree Joaquı´n Dopazo,1 Jose´ Marı´a Carazo2 1
Departmento de I+D, TDI, c/Condes de Torreanaz 5, 28028 Madrid, Spain Centro Nacional de Biotecnologı´a, CSIC, Universidad Auto´noma, 28049 Cantoblanco, Madrid, Spain
2
Received: 14 May 1996 / Accepted: 6 August 1996
Abstract. We propose a new type of unsupervised, growing, self-organizing neural network that expands itself by following the taxonomic relationships that exist among the sequences being classified. The binary tree topology of this neutral network, contrary to other more classical neural network topologies, permits an efficient classification of sequences. The growing nature of this procedure allows to stop it at the desired taxonomic level without the necessity of waiting until a complete phylogenetic tree is produced. This novel approach presents a number of other interesting properties, such as a time for convergence which is, approximately, a lineal function of the number of sequences. Computer simulation and a real example show that the algorithm accurately finds the phylogenetic tree that relates the data. All this makes the neural network presented here an excellent tool for phylogenetic analysis of a large number of sequences. Key words: Classification — Phylogeny — Neural network — Self-organization
Introduction Neural networks constitute a very promising tool for application to many areas of the biological sciences. They display several properties that have encouraged their use for the analysis of protein and nucleic acid sequences. Correspondence to: J. Dopazo
Neural networks do not need a previous model: They are able to determine the relevant features in the data set, usually by means of training processes. Moreover, they are able to detect second- and higher-order correlations in patterns. This is especially important in biological systems, which frequently display nonlinear behavior (Hirst and Stenberg 1992; Petersen et al. 1990). The continuously increasing number of known nucleotide sequences over the last few years has promoted the development of advanced computational tools to deal with this flow of information. Neural networks have been used for different purposes in the field of sequence analysis, such as prediction of distinct domains and binding sites (Bengio and Pouliot 1990; Wade et al. 1992), diverse motif identification (Arrigo et al. 1991; Snyder and Stormo 1995; O’Neill 1995), structure prediction (Bohr et al. 1988; Rost and Sander 1993a,b; Hirst and Stenberg 1992), recognition of distantly related proteins (Frishman and Argos 1992), etc. Several attempts to use neural networks to classify biological sequences have been made, most of them based on supervised learning (Werbos 1990). These approaches have been used for sequence organization in databases (Wu 1993), classification of ribosomal RNA sequences (Wu and Shivakumar 1994), etc. In all these cases, a previous training process is needed to obtain a classification. However, there are problems that a training process may have difficulty dealing with. Another family of algorithms, known as ‘‘unsupervised classificator,’’ can be used in these cases. Unsupervised learning has the advantage that no previous knowledge about the system
227
under study is required. In this study we will concentrate on a type of unsupervised neural network known as ‘‘Kohonen self-organizing maps’’ (Kohonen 1990). Previous works on sequence analysis have used this algorithm to classify protein sequences into groups (Ferran et al. 1994; Ferran and Pflugfelder 1993; Ferran and Ferrara 1991, 1992) based on their dipeptide compositions. Self-organizing neural networks such as those proposed by Kohonen (1990) generate a mapping from high-dimensional-input signal spaces to lower-dimensional-output topological structures (usually twodimensional). Under this approach, the output map represents an estimate of the probability density function of the input data (Kohonen 1990). In the classical Kohonen formulation, the topology of the output map is fixed a priori. However, it has been noted that the predetermined structure and size of Kohonen’s model imply severe limitations on the resulting mappings. To escape from this effect, some variations, such as the unsupervised growing cell structures algorithm (Fritzke 1994), have been proposed. Under this model, the number of elements in the output map increases in those regions where the input space is more dense and decreases in those regions where it is very low or null (Fritzke 1994). The effects of predetermined size and structure of the output topologies are especially extreme when the data to be classified are biological sequences. Present-day sequences are the result of a bifurcating pattern of successive events of speciation of ancestral sequences that can be represented as a binary tree, also called a phylogenetic tree (Holmes and Garnett 1994; Nei 1987). Here we propose a new type of unsupervised neural network that is designed to dynamically ‘‘adapt’’ the topology of the successive output maps in such a way as to capture the intrinsic relationships among the sequences. Following this idea, the output topology is a binary tree defined by the genetic relationships among the sequences and, consequently, corresponding to the phylogenetic tree that related them.
Methods Self-Organizing Tree Algorithm (SOTA). The new algorithm presented here is based both on the Kohonen self-organizing maps (Kohonen 1990) and on the growing cell structures algorithm of Fritzke (1994). The algorithm proposed by Kohonen generates a mapping from a complex input space to a simpler output space. The input space is defined by the experimental input data, whereas the output space consists of a set of nodes arranged according to certain topologies, usually twodimensional grids. The application of the algorithm produces a reduction in the complexity of the data due to the fact that the output space is, usually, smaller than the input space. One of the crucial innovations of SOTA is that the output space has been arranged following a binary tree topology. Additionally, we have incorporated the principles of growing cell structures algorithm of Fritzke (1994) to this binary tree topology. The result has been an algorithm that adapts the number of output nodes arranged in a binary tree to the intrinsic characteristics of the input data set. The growing of the output nodes can be stopped at
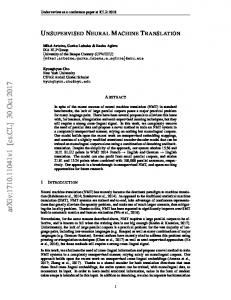
the desired taxonomic level or, alternatively, they can grow until a complete classification of every sequence in the input data set is reached. Encoding the Sequences. The proposed approach uses aligned sequences. The sequences are coded into vectors (sequence vectors). Each sequence position is coded using a vector having as many components as the number of characters of the alphabet used (20 components for amino acids and four components for nucleotides). The value stored at each component in a position is related to the probability of finding such a residue in this position, as described below. Since gaps in the alignment are taken into account as sequence positions, these are considered another residue under this approach. Consequently, an extra component of the vector is reserved for gaps. For example, the resulting sequence-vector which codes for a sequence L amino acids long is a (20 + 1) × L matrix (Fig. 1A). Thus, to code a given site of a well-defined, real sequence, a 1 is placed in the entry corresponding to the observed residue (amino acid or nucleotide) and the remainder entries are set to 0 (Casari et al. 1995). The Algorithm. The initial system is composed of two external elements, denoted as cells, connected by an internal cell (Fig. 1B). Each cell is a vector with the same size as the sequence vectors. Cell vectors , where a makes reference to their ancestor cell, r are denoted by C a,l,r i and l refer to their corresponding ‘‘left’’ and ‘‘right’’ descendants, and i corresponds to the order of creation of the cell. Obviously, in the root cell, a is 0, which means that no other ancestor node exists in the tree. Similarly, in terminal cells, r and l are zero. Under this nomenclature, the initial state of the system is represented by the cells: C10,2,3, C1,0,0 , 2 and C31,0,0. We will maintain the name ‘‘cell’’ for external cells, whereas internal cells will be denoted as nodes. In the beginning, the entries of the two cells and the node linking them are randomly initialized with numbers ranging from 0 to 1. Sequence vectors, which are the actual input (Kohonen 1990) vectors under this model, are denoted by S. As previously noted, the sites of the sequence vectors are well defined, having 1s in the entries corresponding to the residue in the sample and 0s in the remaining entries of the row. In addition to the topology, this type of network has another feature that makes it different from previous growing cell approaches (Fritzke 1994): Only cells, but no nodes, are compared to the sequence-vectors. In this way, a more reduced neighborhood is obtained. The algorithm proceeds by expanding the output topology starting from the cell having the most heterogeneous population of associated inputs. Two new descendants are generated from this heterogeneous cell that changes its state from cell to node. The series of operations performed until a cell generates two descendants is called a ‘‘cycle’’. This process of successive cycles of generation of descendant cells is continued until each cell has one single input sequence assigned, producing a complete classification of the sequences. Alternatively, the expansion can be stopped at the desired level of heterogeneity in the cells, producing in this way a classification of sequences at a higher taxonomic level. Adaptation Process. Adaptation in each cycle is carried out during a series of epochs. Each epoch consists of the presentation of all the sequence vectors of the training set. A presentation implies two steps: first, to find the best matching cell (winning cell) for each input sequence i and second, to update this cell and its neighborhood. The use of a distance function is necessary to decide which cell is the closest to a given sequence. Here, the distance between the cell i, Ci , and the sequence j, Sj , is defined as: L
dsjci =
( l=1
S
A
1−
(S ~r,l! · C ~r,l! j
r=1
L
i
D
(1)
where l accounts for the summation over all the L sites of the sequence
228
Fig. 1. Coding, growing, and neighborhood in the proposed neural network. A Coding for a protein sequence: top file corresponds to the sequence; the row under each residue codes the probability of observing a residue class (each of which is listed in the first row). This is the case of a real (completely defined) sequence and thus one of the residue classes is set to 1 and the remainder entries are set to 0. Ambiguities at higher nodes of the taxonomy are reflected in the relative probabilities of the different residue types. B Starting point of the network: a system composed of two cells, B and C, connected by means of an ancestral node. Inputs are presented to nodes B and C. Let’s assume B is the winning cell for a particular input (the thick black arrow marks this
fact); B is then updated with the value aw, the mother node A with am, and the sister node C with as. (see text for details on the updating process). C Topological neighborhood for different possible winning cells. In the event of cell D being the winning cell, the neighborhood extends to itself and their mother and sister cells B and E, respectively. Nevertheless, in the case of cell C, the neighborhood includes only itself. The reason for this is that if cell A were updated through C but not through B, it would receive an asymmetrical updating; and in this case cell A would not be a good representation of their descendants B and C.
and r accounts for the summation over all the A entries corresponding to all the possible residues of the alphabet. In general, any distance function that monotonically increases as the compared vectors are more and more different will render a successful growing of the network (Kohonen 1990; Fritzke 1994). The particular choice in this work of the above-defined distance is based on the principle stated by Kohonen (1990) that the output nodes tend to represent samples of the probability density function of the input data set. In this way, the information contained in the nodes can be seen from a probabilistic point of view. Following this idea, the above-defined distance between a sequence and a cell has been defined as the summation over all the positions of the probability of having a different residue at each position. These probabilities can be estimated as the product of the values corresponding to the residue in that position. Once the winning cell (cell i) has been found for a given sequence (j), its neighborhood (see above) is updated by means of the following formula (Kohonen 1990):
defined as a function of the cell size. Concretely, Mt is m times the size of the cells. Following the growing cell structures approach (Fritzke 1994), the topological neighborhood of the winning cell is very restrictive. Two different neighborhoods are used: If the sister cell has no descendants (both sister cells are at the only descendants of the node), the neighborhood includes the winning cell, the ancestor node, and the other sister cell; otherwise it includes only the winning cell itself (Fig. 1C). We used constant values aw, am, and as for the winning cell, the ancestor node, and the sister cell, respectively (see Fig. 1B). To have an idea about the variability under each cell, the concept of resource is introduced. Every cell has associated a local resource variable. This variable will be used to direct the growth of the network by means of the replication of the cell with the largest resource value. Since in the present application the main interest is in the degree of variability at a given taxonomic level, the mean value of the distances among a cell and the input sequences associated to it will be used as resource value for this cell:
Ci(t + 1) 4 Ci(t) + ht,t,i z [Sj − Ci(t)]
(2)
K
where ht,t,i is a factor that accounts for the magnitude of the updating of the ith cell depending on its proximity to the winning cell in the neighborhood, the total number of presentations (t), and the number of presentations within a cycle (t). It is defined as:
ht ,t,i = ai ·
1−t · ~1 − bt! Mt
(3)
where Mt is the maximum number of presentations allowed and b is the slope for the reduction of the interaction as the number of presentations, t, increases within a cycle. Mt is obtained as m × A × L, where A is the number of characters used in the alphabet (20 + 1 if amino acids and 4 + 1 if nucleotides) and L is the sequence length. In this way Mt is
Ri =
(d
SkCi
k=1
K
(4)
where the summation is done over the K sequences associated to the cell i. Convergence and Growing of the Network. The criteria used for monitoring the convergence of the network is the total error, «, defined as the summation of the distances of each sequence to the corresponding winning cell after an epoch. Thus, a cycle finishes when the relative increase of the error falls below a given threshold:
U
U
«t − «t−1 ,E «t−1
(5)
229
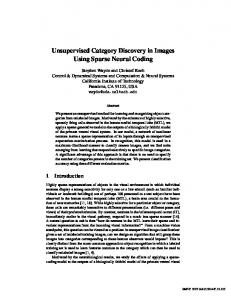
Fig. 2. Dynamics of the error reduction. The Y axis represents the Error function value and the X axis is t, the total number of presentations (see text). At the beginning of a cycle a rapid decrease of the error function can be observed. As soon as the cycle approaches the convergence, the slope reduces and approaches 0. The value at the end of a cycle is the minimum error for the topology of the network at this taxonomic level.
Once the network has converged, a cycle finishes. At the end of each cycle it is necessary to decide whether the network continues growing or the end has been reached. The growing of the network takes place in the cell having higher resources. This cell gives rise to two new descendant cells (Fig. 1C) and transforms itself into a node. At this moment, its upper node becomes a grandmother node, and thereafter, it does not receive any more updating. The two new cells are, in principle, identical to the node which generated them. The growing process ends when the highest resource value reaches a threshold. This is a very convenient way to stop the growing of the network because it allows the network to grow until the desired taxonomic level. Thus, if the threshold is zero, the network, will grow until every input sequence is associated to a unique cell. However, different threshold values will cause the network to stop at higher taxonomic levels, clustering in single cells those sets of sequences whose heterogeneity has associated a value for the cell resources that falls below the threshold.
Results Growing of the Tree The adaptation of the network to the dataset structure can be monitored using the reduction in the error function along the time. Figure 2 shows an example of the dynamics of the error reduction. Each cycle starts with a rapid decrease of the error function, which later reduces its slope until convergence for this cycle is achieved. The value at the end of a cycle is the minimum error for the topology of the network at this instant. Then, after the duplication of a cell, a new cycle starts that allows a general reduction of the error. Finally, if the convergence is carried out until the end, the error becomes 0. Optimizing the Parameters The most important factor for the efficient convergence of the network is the magnitude of the updating, ht,t,i. If
the change exerted by the input sequences over the winning cells and their neighborhood is too strong, the network could become unstable and convergence might not be reached. However, if the maximum number of presentations allowed is too few, ht,t,i becomes very small soon. As a consequence of this, the network cannot adapt itself to the structure of the data in due time, and stops without achieving the convergence. The parameters that have an influence in the ht,t,i value have been studied by computer simulation. Sets of sequences, 100 bp long, that followed a known pattern of evolution were generated as described in Adell and Dopazo (1994). These simulated data sets were used as starting point for the application of the procedure described, with different parameters. All the combinations of the following parameters were tested: m 4 2, 5, 10, 50, 100; aw 4 0.1, 0.05, 0.01, am 4 0.05, 0.025, 0.005; as 4 0.01, 0.005, 0.001; (the threshold) E 4 0.01, 0.005, 0.001, and b 4 0, 0.5, 0.9. In the application of the algorithm, aw > am > as was also satisfied (Kohonen 1990). The results show that the network has difficulties in converging when the interaction is too weak to allow it to successfully complete some of the cycles. Thus, for m 4 2, the network cannot converge for values of aw 4 0.05 and lower. If the number of iterations is increased, then the network converges for aw 4 0.05, but not for aw 4 0.01 (at least until m 4 100). Variations in the threshold, within the range studied here, do not seem to have a null influence on the convergence of the network. As a consequence of this, the factor responsible for the influence of the sequence vectors on the network can be simplified to: ht,i = ai ·
1−t Mt
(6)
discarding the influence of the number of presentations within a cycle, t.
230
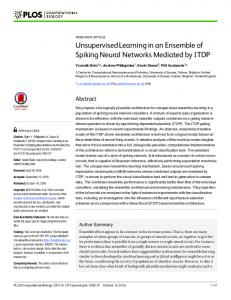
Fig. 3. Topologies used to check the performance of the SOTA under different conditions. One of the topologies (A) represents a balanced binary tree and the other one (B) an unbalanced tree. Values for branch lengths used in the simulation were a 4 0.1 and a 4 0.01.
Efficiency in the Inference of Phylogenies To study the efficiency in reconstructing phylogenetic trees shown by the method presented here, computer simulation was also used. Similarly to other phylogeny studies (Saitou and Imanishi 1989), two different topologies were studies. The topologies displayed in Fig. 3, were stimulated one hundred times each using values a 4 0.01 and a 4 0.1 and generating datasets 300 bp long. One of the trees represents a balanced binary tree and the other one represents an unbalanced tree. The resulting sets of sequences were used to infer the already-known topology by using the described algorithm. The topology corresponding to the balanced binary tree was always successfully recovered in all the tested cases, as well as the unbalanced one using a 4 0.1. However, the efficiency of SOTA in recovering the topology corresponding to the unbalanced tree using a 4 0.01 was 95%. This can be expected due to the fact that when branch length are very short, some of the simulated sequence data sets could have some branches with a length of 0. This will cause a rearrangement of the topology to find the tree that describes the evolution in the data set in the best way. These are cases in which the observed tree (the simulated tree) does not completely match with the theoretical tree due to lack of data. These cases are similar to the observed discrepancies between the species and gene trees (Nei 1987; Tateno et al. 1982). The balanced trees were correctly reconstructed even in the case of a 4 0.01. However, the neighbor-joining method was able to recover the correct tree in all the cases. This suggests that phylogenies involving clusters of sequence would, probably, be more efficiently reconstructed by the proposed algorithm than phylogenies of unbalanced trees. Reconstruction of the Family of Ribosomal L22 Proteins A multiple alignment including fragments of ribosomal L22 proteins from animals, plants, and bacteria was obtained from the BLOCK database (Henikoff and Henikoff 1991). A pairwise distance matrix was obtained using the two-parameter Kimura formula (Kumura 1983) and a phylogenetic tree was obtained from it using the
neighbor-joining (NJ) method (Saitou and Nei 1987) (Fig. 4A). The application of the bootstrap test for topologies (Felsenstein 1985) and for branch lengths (Dopazo 1994) supports the following clusters: [HALH, YEAST, HUMAN, HORVU], [BACST, ECOLI, MYCCA], [MAIZE, ORYSA, PEA, TOBAAC], and [ASTLO, EUGR]. GRATE does not significantly cluster to any group, although it appears clearly associated to the [ASTLO, EUGR] cluster. The phylogenetic order within and between groups could not be significantly defined for the set of sequences used. Upon the application of SOTA, a phylogenetic tree was obtained (Fig. 4B). Comparing the results of the NJ algorithm with SOTA, we have found that the two reconstructed topologies were not significantly different. Nevertheless, SOTA was able to clearly cluster [ASTLO, EUGR, GRATE] while NJ was not. Contrary to the case of the NJ tree, SOTA branch lengths at the highest taxomomic levels are larger. This is due to the way in which cells and nodes are updated by SOTA. At any taxonomic level, every sequence that falls in a cell updates this cell. After a convergence cycle, each iteratively updated cell has adopted a configuration that represents some sort of weighted average of the group of sequences associated to itself (Kohonen 1990; Fritzke 1994). Soon after the cells become nodes they do not receive any more updating. As a consequence of this, branch lengths in SOTA correspond to an intertaxon distance, more similar to the measure of between-population divergence described by Nei (1987) rather than to a classical branch length.
Discussion The network presented here is a special case of unsupervised growing cell structures (Fritzke 1994) in which the topology adopts the form of a tree. Since the way in which the network grows depends on the organization of sequences in families and subfamilies, the network converges concretely to the topology of the phylogenetic tree that describes the taxonomic relationships among the sequences under study. The success of this neutral network in classifying sequences (no matter whether they
231
Fig. 4. Phylogenetic trees obtained for the L22 ribosomal proteins. A Neighbor-joining (Saitou and Nei 1987) phylogenetic tree obtained from a distance matrix calculated using the two-parameter Kimura formula (Kimura 1983). Nodes labeled with a * were significantly
supported (99.9%) by the bootstrap test for topologies (Felsenstein 1985) and the branch lengths were found to be significantly positive (99.9%) using a bootstrap test (Dopazo 1994). B taxonomic classification obtained upon the application of SOTA.
are protein or nucleotide sequences) with high accuracy relies on the way in which the neurons of the network interact among themselves. The interaction along a network with the topology of a binary tree allows an appropriate description of the relationships among the sequences studied. Although self-organized neural networks have already been used for the classification of proteins (Ferran et al. 1994; Ferran and Pflugfelder 1993; Ferran and Ferrara 1991, 1992; Andrade et al. 1996) using sequence data, the approach presented here is completely different in the sense that a new type of self-organizing structure has been developed which grows according to the hypothetical pattern of speciation which would have given rise to the set of present-day sequences analyzed. Direct application of the Kohonen algorithm (Kohonen 1990) to data whose internal relationships are described by means of a binary tree may produce a correct segregation into the main groups but lacks a natural way to represent the taxonomic relationships among the individuals. Another advantage of the network proposed here is that, since sequences are coded residue by residue, all the information contained in the homologous positions of the alignment is used by the algorithm (contrary to the clas-
sical Kohonen approach, in which sequences were coded as frequencies of residues or dipeptides, etc.). As can easily be deduced from the description of the algorithm, SOTA convergence depends on the total size of the cells and nodes implied in the phylogeny. From this point of view, time for convergence can be considered to be approximately a linear function of the number of sequences and the number of residues of the data set. This property makes SOTA a very promising algorithm for the classification of large numbers of sequences, contrary to other approaches for which the execution time depends on the number of sequences in highly nonlinear ways (Felsenstein 1993). Thus, in parsimony (Fitch 1971), execution time is proportional to the cube of the number of sequences and to the number of characters, in least-squares methods (Fitch and Margoliash 1967), execution times are proportional to the fourth power of the number of sequences, and for algorithms like maximum likelihood, execution times grow exponentially with the number of sequences (Felsenstein 1993). However, a key to the SOTA algorithm finding the correct tree is the way in which the distance between the sequences is estimated. In the present form of the algorithm, the distance is computed as the observed distance
232
among all the possible amino acids (or nucleotides) at each position of the sequence, which is an extrapolation of the observed distance between pairs of sequences. Thus, the algorithm will tend to produce wrong trees when the sequences implied in the comparison are poorly related among them. The extrapolation of corrected distances, for example, that of Jukes and Cantor (1969), to the case of sequences encoded as cells is currently under study. In any case, an increase in the efficiency of SOTA in recovering right trees when the sequences are poorly related among them can be expected if corrected distances are used. Typical stepwise algorithms start with a tree composed of three sequences, which is not representative of how the samples are distributed in the sample space. In the presented algorithm every sample has an influence on the topology, from the very beginning at any time the split of a hierarchical level is decided. An additional advantage of SOTA is that the process of growing can be stopped at any level because the tree structure grows as a function of the hierarchical relationships among the samples. This is not possible for stepwise algorithms since the hierarchical relationships at all the levels are only known when the complete phylogeny reconstruction is finished. The procedure presented here is not intended to compete with other well-established phylogenetic procedures, but it offers alternative points of view for analysis as well as complementary advantages. This neural network can also be used to classify other molecular data than protein or nucleotide sequences. For example, binary-coded restriction-site-map data can easily be analyzed using SOTA. In this case a two-letter alphabet would be used. Moreover, if the appropriate distance function is used, other molecular fingerprinting data such as restriction enzyme fragment patterns (Nei and Li 1979), RAPD patterns (Clark and Lanigan 1993), etc., might also be analyzed using this approach. The algorithm presented here constitutes a promising technique for the analysis of protein and nucleotide sequences. For the first time, a growing self-organizing neural network has been developed that is able to directly handle sequence information in order to produce phylogenetic classifications. Computer simulation shows that the algorithm is accurate. Among the advantages over classical phylogenetic procedures we can highlight its time for convergence, which is proportional to the number of sequences and their lengths, and the possibility of producing ‘‘incomplete’’ phylogenies. Computer Program A computer program which implements the SOTA algorithm is available at our FTP server (ftp.tdi.es). It is also available through our Web page (http://www.tdi.es/). Acknowledgments.
The authors thank Dr. Roberto Marabini for
many fruitful discussions during the course of this study. Early comments from Prof. J. Mira on the use of growing cell structures and comments of A. Valencia and M.A. Andrade are also acknowledged. This work has been financed, in part, by grants PB91-0919 and BIO950768, from the Spanish DGICYT and CICYT Agencies, respectively (to J.M.C.).
References Adell JC, Dopazo J (1994) Monte Carlo simulation in phylogenies: an application to test the constancy of evolutionary rates. J Mol Evol 38:305–309 Andrade MA, Casari G, Sander C, Valencia A (1996) Classification of protein families and detection of the determinant residues with a self-organising neural network. (submitted). Arrigo P, Guiuliano F, Scalia F, Rapallo A, Damiani G (1991) Identification of a new motif on nucleic acid sequence data using Kohonen’s self-organizing map. Comput Appl Biosci 7:353–357 Bengio Y, Pouliot Y (1990) Efficient recognition of immunological domains from amino acid sequences using a neural network. Comput Appl Biosci 6:319–324 Bohr H, Bohr J, Brunak S, Cotterill R, Lautrup B, Norskov L, Olsen OH, Petersen SB (1988) Protein secondary structure and homology by neural networks. The a helices in rhodopsin. FEBS Lett 241: 223–228 Casari G, Sander C, Valencia A (1995) Functional residues predicted in protein sequence space. Nat Struct Biol 2:171–178 Clark AG, Lanigan CMS (1993) Prospects for estimating nucleotide divergence with RAPDs. Mol Biol Evol 10:1096–1111 Dopazo J (1994) Estimating errors and confidence intervals for branch lengths in phylogenetic trees by a bootstrap approach. J Mol Evol 38:300–304 Felsenstein J (1985) Confidence limits on phylogenies: an approach using the bootstrap. Evolution 39:783–791 Felsenstein J (1993) PHYLIP (phylogeny inference package) version 3.5. Department of Genetics, University of Washington, Seattle Ferran EA, Ferrara P (1991) Topological maps of protein sequences. Biol Cybern 65:451–458 Ferran EA, Ferrara P (1992) Clustering proteins into families using artificial neural networks. Comput Appl Biosci 8:39–44 Ferran EA, Pflugfelder B (1993) A hybrid method to cluster protein sequences based on statistic and artificial neural networks. Comput Appl Biosci 9:671–680 Ferran EA, Pflugfelder B, Ferrara P (1994) Self-organized neural maps of human protein sequences. Protein Sci 3:507–521 Fitch, WM (1971) Toward defining the course of evolution: minimum change for a specified tree topology. Syst Zool 20:406–416 Fitch WM, Margoliash E (1967) Construction of phylogenetic trees. Science 155:279–284 Frishman D, Argos P (1992) Recognition of distantly related protein sequences using conserved motifs and neural networks. J Mol Biol 228:951–962 Fritzke B (1994) Growing cell structures—a self-organizing network for unsupervised and supervised learning. Neural Networks 7: 1141–1160 Henikoff S, Henikoff JG (1991) Automated assembly of protein blocks for database searching. Nucleic Acids Res 19:6565–6572 Hirst JD, Stenberg MJE (1992) Prediction of structural and functional features of protein and nucleic acid sequences by artificial neural networks. Biochemistry 32:7211–7218 Holmes EC, Garnett GP (1994) Genes, trees and infections: molecular evidence in epidemiology. Trends Ecol Evol 9:256–260 Jukes TH, Cantor CR (1969) Evolution of protein molecules. In: Munro HN (ed) Mammalian protein metabolism. Academic Press, New York pp 21–132
233 Kimura M (1983) The neutral theory of molecular evolution. Cambridge University Press, Cambridge Kohonen T (1990) The self-organizing map. Proc IEEE 78:1464–1480 Nei M (1987) Molecular evolutionary genetics. Columbia University Press, New York Nei M, Li W-H (1979) Mathematical model for studying genetic variation in terms of restriction endonucleases. Proc Natl Acad Sci USA 76:5269–5273 O’Neill MC (1995) Escherichia coli promoters: neural networks develop distinct descriptors in learning to search for promoters of different spacing classes. Nucleic Acids Res 20:3471–3477 Petersen SB, Bohr H, Bohr J, Brunak S, Cotterill R, Fredholm H, Lautrup B (1990) Training neural networks to analyse biological sequences. Trends Biotechnol 8:304–308 Rost B, Sander C (1993a) Secondary structure prediction of all-helical proteins in two states. Protein Eng 6:831–836 Rost B, Sander C (1993b) Improved prediction of protein secondary structure by use of sequence profiles and neural networks. Proc Natl Acad Sci USA 90:7558–7562 Saitou N, Imanishi T (1989) Relative efficiencies of the FitchMargoliash, Maximum-Parsimony, Maximum-Likelihood, Mini-
mum-Evolution, and Neighbor-joining methods of phylogenetic tree construction in obtaining the correct tree. Mol Biol Evol 6: 514–525 Saitou N, Nei M (1987) The neighbor-joining method: a new method for reconstructing phylogenetic trees. Mol Biol Evol 4:406–425 Snyder EE, Stormo GD (1995) Identification of protein coding regions in genomic DNA. J Mol Biol 248:1–18 Tateno Y, Nei M, Tajima F (1982) Accuracy of estimated phylogenetic trees for molecular data. I. Distantly related species. J Mol Evol 18:387–404 Wade RC, Bohr H, Wolynes PG (1992) Prediction of water binding sites on proteins by neural networks. J Am Chem Soc 114:8284– 8285 Werbos PJ (1990) Backpropagation through time: what it does and how to do it. Proc IEEE 78:1550–1560 Wu C (1993) Classification neural networks for rapid sequence annotation and automated database organization. Comput Chem 17: 219–227 Wu C, Shivakumar S (1994) Back-propagation and counter-propagation neural networks for phylogenetic classification of ribosomal RNA sequences. Nucleic Acids Res 22:4291–4299