Position Sensorless Vector Control of. Induction Motor including Field. Weakening Mode of operation. A Project Report. Submitted in Partial Fulfilment of.
Position Sensorless Vector Control of Induction Motor including Field Weakening Mode of operation A Project Report Submitted in Partial Fulfilment of Requirements for the Degree of Master of Engineering in Electrical Engineering
By Awneesh Kumar Tripathi
Department of Electrical Engineering Indian Institute of Science Bangalore - 560 012 India June 2008
Acknowledgements I feel a great pleasure in expressing my sincere thanks to Prof. V. T. Ranganathan who gave me a chance to work under his able guidance. His constant help, supervision and inspiration led me to complete the project in time. Course work dealt by him on electric drive was very helpful for the project. I expess my heartfelt gratitude to Prof. V. Ramanarayanan for his constant supervision and motivation during course work and project work. Course work dealt by him on SMPC and Power electronics was very helpful in understanding the fundamentals of the switched mode power conversion. I sincerely thank Prof. G. Narayanan for his course work on digital controllers and PWM converters. I thank Prof. V. John for his encouragement and support during project. I thank Prof. P. S. Nagendra Rao who was my adviser during my stay at IISc for his help and support. I thank Prof. D. Thukaram, Prof. Indraneel Sen and staff members of the department for their help and support. I thank all senior PhD students of the PEG group Dinesh Gopinath, Kamalesh Hatua, Amit Jain, Debmalya Benerji for maintaining an excellent work culture in the lab and also taking me for two tours of Kerala and Karanataka. I thank Tanmay, Dipankar De, Anirban, Shivaprasad, C. Karupuswamy, A. Karupuswamy, Parikshith, Pavan Hari, Chaitanya, Suneel, Bharat, Bhukia, Shravan, Anand Babu for their help and support. I thank Shilvi madam for her kind help and support. I am grateful to MHRD for providing scholarship. I am grateful to IISc administration for providing it’s students a very good working environment overall.
i
Abstract DC motors were popularily used for variable speed applications until the advances in power electronics devices and digital electronics technology, as they require simple power processing unit and simple control algorithm and offer good dynamic performence. But conventional dc motor has problems related to mechanical commutation, while induction motor has low cost, less maintenance requirement, very rugged and reliable. So now induction motor drives run by voltage source inverters are replacing conventional dc motor drives in all variable speed applications. In this project, attention is towards implementation of an induction motor drive suitable for traction application. As traction is a very high power application, switching losses will amount to a high value which can be minimized by using low switching frequency for the PWM inverter. Secondly traction system has very large inertia, so torque required during acceleration is many times higher the torque required during steady state full speed operation, because in steady state motor has to work only against air resistance and friction. So rather than using a very high power rating motor that can develope peak accelerating torque up to top speed, a smaller power rating motor can be used, which accelerates at limited constant power level, employing field weakening scheme. Higher the voltage that can be applied to the motor, higher will be the flux in the core during field weakening operation and higher will be the torque capability. So inverter should be operated in over-modulation mode as well, extending to six step mode, to utilize dc bus voltage fully. Also for closed loop control, speed sensor is required which makes the motor costly, less reliable and less rugged, as it requires periodic maintenance. So position sensorless control is used, which uses the motor voltages and currents for speed and position synthesis.
ii
Contents Acknowledgements
i
Abstract
ii
List of Tables
vi
List of Figures
vii
Nomenclature
x
1 Introduction
1
1.1 Vector control . . . . . . . . . . . . . . . . . . . . . . . . . . . . . . . . . . .
1
1.2 Special requirements of induction motor traction drive . . . . . . . . . . . .
3
1.3 Problems associated with vector control of induction motor traction drive . .
4
2 Schemes proposed for induction motor traction drive 2.1 Harmonic current extraction . . . . . . . . . . . . . . . . . . . . . . . . . . .
5 5
2.1.1
Harmonic model of Induction motor . . . . . . . . . . . . . . . . . . .
5
2.1.2
Extraction of fundamental current . . . . . . . . . . . . . . . . . . . .
6
2.1.3
Conclusion . . . . . . . . . . . . . . . . . . . . . . . . . . . . . . . . .
8
2.2 Overmodulation scheme . . . . . . . . . . . . . . . . . . . . . . . . . . . . .
9
2.2.1
Pulse dropping and Loss of volt-seconds . . . . . . . . . . . . . . . .
9
2.2.2
Redistributing commanded volt-seconds
. . . . . . . . . . . . . . . .
9
2.2.3
Conclusion . . . . . . . . . . . . . . . . . . . . . . . . . . . . . . . . .
13
2.3 Position sensorless scheme . . . . . . . . . . . . . . . . . . . . . . . . . . . .
13
2.3.1
Sensorless Principle . . . . . . . . . . . . . . . . . . . . . . . . . . . . iii
13
iv
Contents
2.3.2
Stator Voltage Integration Problem . . . . . . . . . . . . . . . . . . .
16
2.3.3
Removal of integration problem . . . . . . . . . . . . . . . . . . . . .
17
2.3.4
Conclusion . . . . . . . . . . . . . . . . . . . . . . . . . . . . . . . . .
19
2.4 Field weakeneing scheme . . . . . . . . . . . . . . . . . . . . . . . . . . . . .
19
2.4.1
Voltage, current limits and optimum operating condition . . . . . . .
19
2.4.2
Brief theory of the algorithm . . . . . . . . . . . . . . . . . . . . . . .
21
2.4.3
Conclusion . . . . . . . . . . . . . . . . . . . . . . . . . . . . . . . . .
22
3 Implementation
23
3.1 Introduction . . . . . . . . . . . . . . . . . . . . . . . . . . . . . . . . . . . .
23
3.2 Experimental Setup . . . . . . . . . . . . . . . . . . . . . . . . . . . . . . . .
23
3.2.1
Induction Motor-DC Generator Setup . . . . . . . . . . . . . . . . . .
23
3.2.2
Inverter Setup . . . . . . . . . . . . . . . . . . . . . . . . . . . . . . .
26
3.2.3
FPGA Controller . . . . . . . . . . . . . . . . . . . . . . . . . . . . .
27
3.3 Implementation . . . . . . . . . . . . . . . . . . . . . . . . . . . . . . . . . .
31
3.4 Estimation and calculation of different quantities . . . . . . . . . . . . . . .
31
3.4.1
Base Values for Different Quantities . . . . . . . . . . . . . . . . . . .
32
3.4.2
DC Bus Voltage Calculation . . . . . . . . . . . . . . . . . . . . . . .
32
3.4.3
Sensed Voltage scaling . . . . . . . . . . . . . . . . . . . . . . . . . .
33
3.4.4
Sensed current scaling . . . . . . . . . . . . . . . . . . . . . . . . . .
33
3.4.5
Harmonic current extraction . . . . . . . . . . . . . . . . . . . . . . .
33
3.4.6
Estimation of speed and position . . . . . . . . . . . . . . . . . . . .
33
3.4.7
Selection of K in flux position estimator block . . . . . . . . . . . . .
36
3.4.8
Decoupling Circuit . . . . . . . . . . . . . . . . . . . . . . . . . . . .
36
3.5 Design and implementation of Controllers
. . . . . . . . . . . . . . . . . . .
37
3.5.1
General digital implementation of a controller . . . . . . . . . . . . .
37
3.5.2
Design of Current Controller . . . . . . . . . . . . . . . . . . . . . . .
38
3.5.3
Design of Speed Controller . . . . . . . . . . . . . . . . . . . . . . . .
39
3.5.4
Design of Flux Controller . . . . . . . . . . . . . . . . . . . . . . . .
39
3.5.5
Design of Voltage Controller . . . . . . . . . . . . . . . . . . . . . . .
40
3.6 Conclusion . . . . . . . . . . . . . . . . . . . . . . . . . . . . . . . . . . . . .
41
Contents 4 Experimental Results
v 42
4.1 Introduction . . . . . . . . . . . . . . . . . . . . . . . . . . . . . . . . . . . .
42
4.2 Current Extraction Waveforms . . . . . . . . . . . . . . . . . . . . . . . . . .
42
4.3 Overmodulation Waveforms . . . . . . . . . . . . . . . . . . . . . . . . . . .
42
4.4 Steady State Waveforms . . . . . . . . . . . . . . . . . . . . . . . . . . . . .
42
4.5 Transient Waveforms . . . . . . . . . . . . . . . . . . . . . . . . . . . . . . .
48
4.6 Machine-2 Loading Waveforms . . . . . . . . . . . . . . . . . . . . . . . . . .
62
4.7 Conclusion . . . . . . . . . . . . . . . . . . . . . . . . . . . . . . . . . . . . .
62
References
64
List of Tables 3.1 Details of the induction motor . . . . . . . . . . . . . . . . . . . . . . . . . .
25
3.2 Parameters of the induction motor . . . . . . . . . . . . . . . . . . . . . . .
26
3.3 Details of the DC generator . . . . . . . . . . . . . . . . . . . . . . . . . . .
26
3.4 ALTERA FPGA device data . . . . . . . . . . . . . . . . . . . . . . . . . . .
29
3.5 PU values . . . . . . . . . . . . . . . . . . . . . . . . . . . . . . . . . . . . .
31
3.6 Base values . . . . . . . . . . . . . . . . . . . . . . . . . . . . . . . . . . . .
32
3.7 Controller parameters . . . . . . . . . . . . . . . . . . . . . . . . . . . . . . .
41
4.1 Details of the induction motor-2 . . . . . . . . . . . . . . . . . . . . . . . . .
62
vi
List of Figures 1.1 Block diagram of sensorless vector controlled induction motor drive . . . . .
2
2.1 Block diagram for fundamental current extraction . . . . . . . . . . . . . . .
7
2.2 Simulation result(fundamental current extraction) . . . . . . . . . . . . . . .
8
2.3 Sine-Triangle PWM (Over-modulation) . . . . . . . . . . . . . . . . . . . . .
10
2.4 Space-Vector PWM (Over-modulation, mode-1) . . . . . . . . . . . . . . . .
11
2.5 Space-Vector PWM (Over-modulation, mode-2) . . . . . . . . . . . . . . . .
11
2.6 Clamping level as a function of reference voltage peak(Sine-Triangle PWM) .
12
2.7 Clamping level as a function of reference voltage peak(Space-Vector PWM) .
12
2.8 Phasor diagram for rotor flux estimation . . . . . . . . . . . . . . . . . . . .
15
2.9 Block diagram for derivation of unit vectors cosρ and sinρ . . . . . . . . . .
16
2.10 Modified unit-vector derieving algorithm block diagram . . . . . . . . . . . .
18
2.11 Voltage, current limits and optimum torque trajectory
. . . . . . . . . . . .
20
2.12 Block diagram for field weakening algorithm . . . . . . . . . . . . . . . . . .
21
3.1 Block diagram for overall drive scheme . . . . . . . . . . . . . . . . . . . . .
24
3.2 Experimental setup . . . . . . . . . . . . . . . . . . . . . . . . . . . . . . . .
25
3.3 Block diagram of FPGA board
. . . . . . . . . . . . . . . . . . . . . . . . .
28
3.4 Configuration of FPGA device . . . . . . . . . . . . . . . . . . . . . . . . . .
29
3.5 Block diagram of on-board clock network . . . . . . . . . . . . . . . . . . . .
30
3.6 Current loop . . . . . . . . . . . . . . . . . . . . . . . . . . . . . . . . . . . .
38
3.7 Speed loop . . . . . . . . . . . . . . . . . . . . . . . . . . . . . . . . . . . . .
39
3.8 Flux loop . . . . . . . . . . . . . . . . . . . . . . . . . . . . . . . . . . . . .
39
3.9 Voltage loop . . . . . . . . . . . . . . . . . . . . . . . . . . . . . . . . . . . .
40
vii
viii
List of Figures
4.1 Vrn and isr waveforms for speed command of 0.7pu (35Hz) . . . . . . . . . .
43
4.2 irh and isr (extracted) waveforms for speed command of 0.7pu (35Hz) . . . .
43
4.3 Vrn and isr waveforms for speed command of 0.92pu (46Hz) . . . . . . . . .
44
4.4 irh and isr (extracted) waveforms for speed command of 0.92pu (46Hz) . . .
44
4.5 Vrn and isr waveforms for speed command of 1.25pu (64Hz) . . . . . . . . .
45
4.6 irh and isr (extracted) waveforms for speed command of 1.25pu (64Hz) . . .
45
4.7 Vref and Vsvpwm (modif ied) waveforms for speed command of 0.75pu (36Hz)
46
4.8 Vref and Vsvpwm (modif ied) waveforms for speed command of 0.89pu (44.5Hz)
46
4.9 Vref and Vsvpwm (modif ied) waveforms for speed command of 0.94pu (47Hz)
47
4.10 Vref and Vsvpwm (modif ied) waveforms for speed command of 01.02pu (50.6Hz) 47 4.11 sinρ and cosρ waveforms for speed command of 0.0625pu (3.125Hz) . . . . .
48
4.12 is1 and is2 waveforms for speed command of 0.0625pu (3.125Hz) . . . . . . .
49
4.13 isq and isd waveforms for speed command of 0.0625pu (3.125Hz) . . . . . . .
49
4.14 sinρ and cosρ waveforms for speed command of 0.75pu (37.5Hz) . . . . . . .
50
4.15 is1 and is2 waveforms for speed command of 0.75pu (37.5Hz) . . . . . . . . .
50
4.16 isq and isd waveforms for speed command of 0.75pu (37.5Hz) . . . . . . . . .
51
4.17 sinρ and cosρ waveforms for speed command of 1.5pu (75Hz) . . . . . . . .
51
4.18 is1 and is2 waveforms for speed command of 1.5pu (75Hz) . . . . . . . . . .
52
4.19 isq and isd waveforms for speed command of 1.5pu (75Hz) . . . . . . . . . .
52
4.20 sinρ and cosρ waveforms for speed command of 2.25pu (112.5Hz) . . . . . .
53
4.21 is1 and is2 waveforms for speed command of 2.25pu (112.5Hz) . . . . . . . .
53
4.22 isq and isd waveforms for speed command of 2.25pu (112.5Hz) . . . . . . . .
54
4.23 Rotor reference and actual speed during transition from 0.75 pu (37.5Hz) to 1.5 pu (75Hz) . . . . . . . . . . . . . . . . . . . . . . . . . . . . . . . . . . .
55
4.24 sinρ and cosρ during speed transition from 0.75 pu (37.5Hz) to 1.5 pu (75Hz) 55 4.25 Vmax and Vdq during speed transition from 0.75 pu (37.5Hz) to 1.5 pu (75Hz) 56 4.26 imr (ref erence) and imr during speed transition from 0.75 pu (37.5Hz) to 1.5 pu (75Hz) . . . . . . . . . . . . . . . . . . . . . . . . . . . . . . . . . . . . .
56
4.27 isd (ref erence) and isd during speed transition from 0.75 pu (37.5Hz) to 1.5 pu (75Hz) . . . . . . . . . . . . . . . . . . . . . . . . . . . . . . . . . . . . .
57
4.28 isq (ref erence) and isq during speed transition from 0.75 pu (37.5Hz) to 1.5 pu (75Hz) . . . . . . . . . . . . . . . . . . . . . . . . . . . . . . . . . . . . .
57
4.29 is1 and is2 during speed transition from 0.75 pu (37.5Hz) to 1.5 pu (75Hz) .
58
List of Figures
ix
4.30 Rotor reference and actual speed waveform during the speed reversal from 1.25 pu to -1.25 pu . . . . . . . . . . . . . . . . . . . . . . . . . . . . . . . .
58
4.31 sinρ and cosρ waveform during the speed reversal from 1.25 pu to -1.25 pu .
59
4.32 is1 and is2 waveform during the speed reversal from 1.25 pu to -1.25 pu . . .
59
4.33 Vmax and Vdq waveform during the speed reversal from 1.25 pu to -1.25 pu . .
60
4.34 imr (ref erence) and imr waveform during the speed reversal from 1.25 pu to -1.25 pu . . . . . . . . . . . . . . . . . . . . . . . . . . . . . . . . . . . . . .
60
4.35 isd (ref erence) and isd waveform during the speed reversal from 1.25 pu to -1.25 pu . . . . . . . . . . . . . . . . . . . . . . . . . . . . . . . . . . . . . .
61
4.36 isq (ref erence) and isq waveform during the speed reversal from 1.25 pu to -1.25 pu . . . . . . . . . . . . . . . . . . . . . . . . . . . . . . . . . . . . . .
61
4.37 is1 and is2 for speed command 1.25 pu (62.5 Hz) and load 129.2W . . . . . .
62
4.38 isq (ref erence) and isq for speed command 1.25 pu (62.5 Hz) and load 129.2W 63
Nomenclature Symbols
: Definitions
Vdc
: DC bus voltage
vs1 , vs2 , vs3
: 3-phase voltages applied on the induction motor
V
: Voltage space phasor
vsa , vsb
: a-axis and b-axis components of V
vsd , vsq
: d-axis and q-axis voltage components of V
is1 , is2 , is3
: 3-phase line currents
is
: Stator current phasor
isa , isb
: a-axis and b-axis components of is
isd , isq
: d-axis and q-axis components of is
imr
: Rotor magnetizing current
ψs
: Stator flux vector
ψsa , ψsb
: a-axis and b-axis components of ψ s
ψ sr s s ψra , ψrb
: Rotor flux phasor referred to stator coordinates : a-axis and b-axis components of ψ sr
ρ
: Position of the rotor flux phasor
ωm
: Mechanical speed of the rotor in rad/sec
ω
: Electrical speed of the rotor in rad/sec
ω1
: Speed of the rotor flux vector ψ r or Stator frequency in rad/sec
ωslip
: Slip frequency in rad/sec
ω∗
: Speed reference in rad/sec
i∗mr
: Magnetizing current reference which corresponds to flux in the machine
i∗sd , i∗sq ∗ ∗ ∗ vs1 , vs2 , vs3
: d-axis current and q-axis current references : 3-phase reference modulating waves x
Nomenclature V∗
: Reference voltage phasor
∗ ∗ vsa , vsb ∗ ∗ vsd , vsq
: a-axis and b-axis components of V ∗
P
: number of poles
Lo
: mutual inductance between stator and rotor windings
Llr or σr Lo
: rotor leakage inductance
Lls or σs Lo
: stator leakage inductance
Lr
: rotor inductance
Ls
: stator inductance
Rr
: rotor resistance
Rs
: stator resistance
J
: moment of inertia of the motor
KN
: proportional gain of the speed controller
TN
: time constant of the speed controller
Kc
: proportional gain of the current controller
Tc
: time constant of the current controller
KF
: flux controller gain constant
TF
: flux controller time constant
Kv
: voltage controller gain constant
Tv
: voltage controller time constant
G
: gain of the converter
Td
: delay of the converter
Vmax
:voltage limit
Imax
: current limit
imode2
: field current’s mode-2 condition value
Iharm
: harmonic motor current
mL
: load torque(per unit)
Tr
: field time constant
Tw
: speed filter time constant
Tdq
: voltage filter time constant
: d-axis and q-axis voltage components of V ∗
xi
Chapter 1 Introduction The fact that the torque and speed in DC motor can be controlled independently by controlling armature current and field current respectively ensures that dc motor has good dynamic performance. The objective of vector control is to find two such components of currents from the available information of line currents of induction motor, by controlling which torque and speed can be controlled independently. This is the basic underlying principle of vector control which is most popular for induction motor drives.
1.1
Vector control
In case of induction motor, rotor flux rotates at the same speed as air gap flux separated by certain angle. By transforming the current space phasor in a synchronously rotating frame aligning rotor flux space phasor, we get two independent dc current components of the actual three phase current [4]. So vector control makes the control as simple and reliable as dc motor control. This is shown with equation 1.1, 1.2, 1.3, 1.4 and 1.5 here. Tr
dimr (t) + imr (t) = isd (t) dt isq (t) dρ = ω (t) + dt Tr imr (t)
(1.2)
2 P L0 imr (t) isq (t) 3 2 1 + σr
(1.3)
ω1 (t) = Md =
disd dimr = vsd + σLs ω1 isq (t) − (1 − σ)Ls dt dt
(1.4)
disq = vsq − σLs ω1 isd (t) − (1 − σ) Ls ω1 imr (t) dt
(1.5)
Rs isd (t) + σLs Rs isq (t) + σLs
(1.1)
1
2
+
KN (1+sTN)
−
isq*
s TN
+
ωm
* imr
+
* isd
−
s TF
imr
cosρ sin ρ ω
m
G
G
KC (1+sTC )
−
s TC
+ +
+ +
vsqref
isq
KF (1+sTF )
vsa*
(1−σ) Ls ω1 imr
vsq* vsd*
vsdref +
KC (1+sTC )
− isd
+
s TC
+
−
Tr
isa
Den
isb Slip Frequency
Slip Frequency
Num
i mr
vsb*
ab to 123
vs1* vs2* vs3*
PWM
IM
INVERTER
cosρ sin ρ (1−σ)Ls G
σ Ls ω1 isq G
vsb*
Estimation of Rotor Flux Position (ρ) and Speed
+
vsa*
dq to ab
i s1
d imr dt isd
1 1+ sTr
ab to dq isq cosρ sin ρ
isa
isb
is2
123 to ab
Chapter 1. Introduction
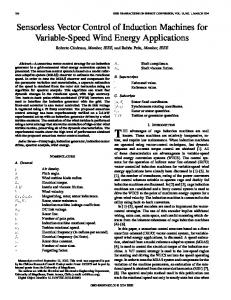
Figure 1.1: Block diagram of sensorless vector controlled induction motor drive
ω *m
σ Ls ω1 i sd
1.2. Special requirements of induction motor traction drive
3
For the purpose of the control, the d-axis and q-axis currents must be controlled independently. The presence of the terms containing isq in vsd equation 1.4 and isd in vsq equation 1.5 indicates cross coupling. Hence we need to add the following decoupling terms in the control circuit.
σLs ω1 isq (t) (1 − σ)Ls didtmr + G G σLs ω1 isd (t) (1 − σ) Ls ω1 imr(t) vsqx = + G G where G is the gain of the inverter. vsdx = −
(1.6) (1.7)
After adding the above mentioned components in the control circuit, the currents isd and isq , are completely decoupled and entirely depend upon the voltages vsd and vsq respectively as shown in equations 1.8 and 1.9. Rs isd (t) + σLs
disd = vsd dt
(1.8)
Rs isq (t) + σLs
disq = vsq dt
(1.9)
This is shown in the block diagram1.1.
1.2
Special requirements of induction motor traction drive
1. Switching losses are directly proportional to switching frequency. So in traction application(MW power level), low switching frequency(less than 1 KHz) inverter operation is required to reduce switching device heating. 2. Traction system has large inertia, so torque required during acceleration is very high compared to steady state operation. If field weakening mode of operation is followed, motor power rating can be saved. 3. Overmodulation operation leading to six step mode operation of the inverter, produces maximum possible stator voltage out of limited DC bus voltage which is required for maximum torque production. 4. Position sensor(optical or magnetic) makes induction motor expensive and less reliable, so a position sensorless vector control is preferable.
4
Chapter 1. Introduction
1.3
Problems associated with vector control of induction motor traction drive
1. Low switching frequency PWM operation and over modulation operation will result in high stator current ripple. So d-q frame currents required by vector control will be distorted and good control can not be possible. If one puts a heavy filter it will slow the current loop too much. So some suitable current extraction algorithm has to be followed. 2. DC bus voltage has to be utilized for maximum torque production, but as the reference goes above traingle carrier peak, pulse dropping occurs and linearity between input reference and output voltage is lost. So suitable compensation has to be applied. 3. Flux position is estimated by integration of applied stator excitation voltage. Pure integration leads to saturation so first order filter is used instead, but at low speed this creates problem because of relatively wrong position estimate. So this needs to be improved. 4. Field weakening has to be done in such a manner that accelerating torque follows maximum torque trajectory without violating either current limit or voltage limit. So suitable algorithm is needed here as well. In the next chapter, proposed solutions to the above discussed problems are presented.
Chapter 2 Schemes proposed for induction motor traction drive 2.1
Harmonic current extraction
As mentioned ealier we are operating the inverter at low switching frequency and in overmodulation mode as well as normal mode. This is adopted to make switching losses small and utilize the available DC bus voltage fully. PWM output voltage is pure sine wave if switching frequency is infinite and inverter operates in normal mode. As we are violating both constraints, actual PWM output voltage has considerable harmonics which will produce larger harmonic current, since for harmonics, the induction motor behaves as leakage inductance load only. This distorted current has to be used by speed estimation block and current controller. So system has a very high risk of instability. If we put a low pass filter to correct the problem, it becomes worse because of the delay introduced by the filter. In this chapter we present a different approach to extract fundamental current [2, 7].
2.1.1
Harmonic model of Induction motor
We have voltage and flux equations as follows v ss = Rs iss +
dψ ss dt
dψ sr = + dt s s ψ s = Ls is + L0 irr ejε vsr
Rs isr
ψ sr = Lr irr ejε + L0 iss 5
(2.1) (2.2) (2.3) (2.4)
6
Chapter 2. Schemes proposed for induction motor traction drive
Virtually no current flows through magnetizing inductance for harmonic frequency and leakage inductance being small, we can neglect rotor flux linkage term in equation 2.2. From equations 2.1, 2.2, 2.3 and 2.4, we derive vss = Rs iss + Ls
dir diss + L0 [ r ejε + jωirr ] dt dt
vsr = 0 = Rr isr +
dψ sr − jωψ sr dt
(2.5) (2.6)
And from equations 2.5 and 2.6, we get vss = Rs iss + Ls
diss L0 dis − [Rr irr ejε + L0 s ] dt Lr dt
(2.7)
Neglecting rotor flux in equation from 2.4, we get irr ejε = − LL0r iss . By substituting this
expression in equation 2.7, we get
v ss = [Rs + Rr (
L0 2 s dis ) ]is + σLs s Lr dt
(2.8)
or
dih (2.9) dt Here Lh = σLs and Rh = [Rs + Rr ( LL0r )2 ] . This equation 2.9 describes the harmonic model vh = Rh ih + Lh
of induction motor.
2.1.2
Extraction of fundamental current
First we calculate the harmonic voltage by subtracting weighted reference voltage(pure sine wave) from actual PWM output voltage. Now this harmonic voltage is applied as input to the induction motor harmonic model which produces harmonic current as output. This harmonic current has to be subtracted from actual induction motor current to get fundamental motor current. This is shown with block diagram 2.1. Also it is to be noted that at low switching frequency, fundamental inverter output voltage is lower than what it is expected to be. So after deduction of weighted reference from it, the assumed harmonic voltage, actually has some negative fundamental voltage also. This produces large negative fundamental current from the harmonic model which presents low impedance to fundamental voltage. After deduction of it from actual motor current, fundamental current estimated is actually higher than the real fundamental current. This causes the current limit to over-act and hence motor can not accelerate at the maximum possible rate. For compensation, estimated harmonic
7
2.1. Harmonic current extraction
Leakage model of IM
Vah
Vsa(PWM)
+ −
+−
Iah
1
−+
s(σ Ls)
Isa(extracted)
Vsa(REF) G
2 Rs + (Lo/Lr) Rr
Vsb(PWM)
Ibh
Vbh
+
−
+ −
1
s(σ Ls)
−+
Vsb(REF) G
2 Rs + (Lo/Lr) Rr
Isa(motor) Isb(motor) Figure 2.1: Block diagram for fundamental current extraction
Isb(extracted)
8
Chapter 2. Schemes proposed for induction motor traction drive
Vrh
Vref, Vrn
All values in per−unit 1 0
−1 0.95 0.5 0 −0.5 0.95
0.96
0.97
0.98
0.99
1
1.01
1.02
0.96
0.97
0.98
0.99
1
1.01
1.02
0.96
0.97
0.98
0.99
1
1.01
1.02
0.96
0.97
0.98
0.99
1
1.01
1.02
0.96
0.97
0.98 0.99 Time in seconds
1
1.01
1.02
Isr
0.5 0 −0.5
Isr(extracted)
Irh
0.95 0.2 0 −0.2 −0.4 0.95 0.5 0 −0.5 0.95
Figure 2.2: Simulation result(fundamental current extraction) current should be converted into d-q components, which should be passed through high pass filters to remove the dc component (fundamental current in a-b-c), then converted back to stator frame and subtracted from the motor current to get the fundamental current. A simulation output is shown in figure 2.2.
2.1.3
Conclusion
This algorithm has been tested on Simulink/Matlab and also verified on experimental set up. Here we avoid use of a heavy filter, so there is no danger to stability of the system. Extracted current is pure sinusoidal, however it depends on correctness of the machine parameters. So d − q components are pure DC quantities which are fed to current controller. Extracted
fundamental current and sinusoidal reference voltage are fed to flux position estimator which produces ρ and sinρ, cosρ as output.
2.2. Overmodulation scheme
2.2
9
Overmodulation scheme
DC bus voltage is limited to lower value in traction application due to economical constraints, for example cost of bus insulators and cost of switching devices and motor. The maximum fundamental three phase ac voltage that can be generated from it occurs when inverter operates in six step mode. But in any PWM technique, when reference voltage exceeds the triangular carrier amplitude (modulation index > 1.0 for sine-triangle PWM and modulation index >
√2 3
for Space-vector PWM and triplen harmonics injection PWM), the output gets
saturated and the linearity between output voltage and reference voltage is lost. This causes the actual gain of the inverter to be lower than that expected by closed loop controller, so overall drive performs poorly. To compensate for drop in gain in over-modulation region, some methods have been in practice. In one of the methods, reference is modified by clamping it at high or low depending on polarity and maintaining quarter wave symmetry, at certain angle which is decided by modulation index of the reference [1]. The angle is calculated such that the modified reference (fundamental magnitude) becomes equal to actual reference magnitude.
2.2.1
Pulse dropping and Loss of volt-seconds
In a PWM algorithm, input reference voltage is compared to triangular switching frequency wave; when the reference exceeds triangle wave value, output pulse is high, otherwise low. At the maximum, high can occur for full sampling duration when the input reference magnitude is equal or greater than the triangle peak magnitude. So the reference magnitude greater than the triangle peak magnitude, produces saturated average output. So there is a loss of volt-seconds in the pulse dropping region. Below it is shown with help of figures 2.3, 2.4 and 2.5
2.2.2
Redistributing commanded volt-seconds
In order to maintain linearity between reference voltage and inverter output voltage, voltseconds lost due to PWM saturation is compensated by adding extra volt-seconds in reference voltage itself [1]. This is done by clamping the original command to +1or−1 per unit for a portion of the cycle. The duration for which this clamping takes place is calculated such that per unit reference fundamental voltage becomes equal to per unit output fundamental
10
Chapter 2. Schemes proposed for induction motor traction drive
1 Reference voltage VmSin(ωt)=MiVpSin(ωt), pu
Mi=4/π
Reference and modified voltages (in per unit scale)
0.9 Volt−sec lost
Mi=1 0.8
0.7 Extra Volt−sec added 0.6
0.5
0.4
0.3
Triangle carrier amplitude Vp=π/4, pu
αs
0.2 Hs
0.1
0
0.173
0.174
0.175
0.176
0.177 0.178 Time(seconds)
0.179
0.18
0.181
0.182
Figure 2.3: Sine-Triangle PWM (Over-modulation) voltage. This is shown with figures 2.3, 2.4 and 2.5. For sine-triangle we have following relations: Hs = Vm sin(αs ) (2.10) Vm Vm = cos(αs ) + [2αs − sin(2αs )] (2.11) π Equations 2.10 and 2.11 are valid for full over-modulation range(1 =< Mi =< π4 ). For space vector PWM, there are two modes of operation in over-modulation region. In the first mode, clamping has to be done at two peaks per half cycle because of the wave shape and in second mode clamping is done once per half cycle as reference gets more saturated and clamping requirement is more. The equations for first mode are 2.12 and 2.13. √ Vm [3sin(αsv ) + 3cos(αsv )] Hsv = (2.12) 4 √ √ π 3 3 3π 1 3 Vm cos(2αsv ) + cos(αsv ) − 3 sin(αsv )] (2.13) Vm = [− Vm sin(2αsv ) + 3Vm αsv − π 4 4 2 2 And for second mode of operation, the equations are 2.14 and 2.15. 3 Hsv = Vm sin(αsv ) 2 Vm =
1 3 [− Vm sin(2αsv ) + 3Vm αsv + πcos(αsv )] π 2
(2.14) (2.15)
11
2.2. Overmodulation scheme
1 Reference voltage(per unit) V Sin(ωt)=M V Sin(ωt) m
Reference, SV and modified voltages (in per unit scale)
0.9
i p
0.8
0.7 Volt−sec lost
α
sv
0.6
0.5 H
sv
M =V /V i
Vp=π/4, per unit
0.4
m
p
0.3
0.2
0.1
0 0.072
0.073
0.074
0.075
0.076
0.077 Time(seconds)
0.078
0.079
0.08
0.081
Figure 2.4: Space-Vector PWM (Over-modulation, mode-1)
1 Reference voltage(per unit) V Sin(ωt)=M V Sin(ωt) m
Reference, SV and modified voltages (in per unit scale)
0.9
i p
0.8
0.7 Volt−sec lost
αsv 0.6
0.5 V =π/4, per unit
M =V /V
p
i
m
p
0.4
0.3
0.2 Hsv 0.1
0
0.153
0.154
0.155
0.156
0.157 Time(seconds)
0.158
0.159
0.16
0.161
Figure 2.5: Space-Vector PWM (Over-modulation, mode-2)
0.162
12
Chapter 2. Schemes proposed for induction motor traction drive
0.8
0.7
PWM
Overmodulation
0.6
Hs(pu)
0.5 Hs=Vp=π/4
Vm=1
0.4
Mi=4/π 0.3 Vm=π/4 0.2 Mi=1 0.1
0 0.7
0.75
0.8
0.85 Vm(pu)
0.9
0.95
1
Figure 2.6: Clamping level as a function of reference voltage peak(Sine-Triangle PWM)
0.8 Hsv=0.711 0.7 OVERMODULATION MODE−1
SVPWM 0.6
OVERMODULATION MODE−2
Hsv(pu)
0.5
0.4 H =V =π/4 sv
p
0.3
0.2
Mi=1.1548
M =1.207
M =4/π
V =0.907
Vm=0.948
Vm=1
m
i
i
0.1
0
0.86
0.88
0.9
0.92
0.94 Vm(pu)
0.96
0.98
1
1.02
Figure 2.7: Clamping level as a function of reference voltage peak(Space-Vector PWM)
13
2.3. Position sensorless scheme
Based on these equations lookup table can be constructed which takes modulation index Mi as input and gives Hs or Hsv value as output. It is shown with graphs 2.6 and 2.7. A comparator clamps input reference command to + 1 or − 1 per unit with input polarity, if its magnitude exceeds Hs or Hsv value. The algorithm is here VP W M ∗ = VP W M , [when
− HP W M =< VP W M =< HP W M ]
(2.16)
= sign(VP W M ), [otherwise]
2.2.3
Conclusion
Space vector is better than sine-triangle PWM as it remains linear upto modulation index of
√2 . 3
In fact in space vector PWM, triplen harmonics( third harmonics = 31 , maximum,
ninth harmonics =
1 , maximum 9
) are injected to increase output fundamental voltage,
which are inherently canceled by balanced three phase system. But to increase fundamental volatge further one has to inject 5, 7, 11, 13.. harmonics also, all the way upto six step or square wave mode. That’s what we are doing here indirectly [1].
2.3
Position sensorless scheme
In field oriented control, a rotational transducer such as tachometer, or an encoder or a resolver, is mounted on the induction motor shaft. However, a speed sensor can not be mounted on a shaft in some cases, such as motor drives in hostile environment or high speed motor drives. Further, these sensors suffer from low reliability, high cost and noise. Therefore, sensorless drives are increasingly employed in modern industrial applications. The advantages of speed sensorless induction motor drives are lower cost, elimination of sensor cable (which is prone to noise signals) and increased reliability. In this section, the principle of sensorless operation, the algorithm employed to estimate the rotor flux position and the speed, and the practical problems and constraints involved, and their solution are presented [5].
2.3.1
Sensorless Principle
The rotor speed in elec-rad/sec(ω) , rotor flux speed (ω1 ) and the slip frequency(ωslip ) can be related as follows, ω = ω1 − ωslip
14
Chapter 2. Schemes proposed for induction motor traction drive
In this section the equations required for the determination of the rotor flux speed(ω1 ) are developed and as explained in previous chapters, slip frequency (ωslip ) is given by ωslip = isq . Tr imr
Thus the rotor speed (ω) is estimated which is used as feed back quantity in the speed
loop. The stator and rotor flux linkages in terms of the stator and rotor currents can be expressed as follows, ψ ss = Ls iss + L0 irr ejε
(2.17)
ψ rr = Lr irr + L0 iss e−jε
(2.18)
Referring the rotor flux in stationary coordinate system, ψ sr = ψ rr ejε = Lr irr ejε + L0 iss
(2.19)
From equations (2.17), (2.19) the rotor current referred to the stator can be expressed as in equation (2.20)
ψ sr − L0 iss Lr Substituting this value from equation 2.20 in equation 2.17 we get irr ejε =
ψ ss = [Ls iss +
where σ = 1 −
L0 s (ψ r − L0 iss )] Lr
Lr s (ψ s − σLs iss ) L0
ψ sr =
(2.20)
(2.21)
L20 Ls Lr
Therefore rotor flux referred to the stator can be written as shown in Eqn. 2.21. The stator voltage equation in space phasor form can be written as follows which can be used for the calculation of the stator flux. v ss
=
Rs iss
dψ ss + dt
(2.22)
From the above equation (2.22) the stator flux linkages can be expressed as, ψ ss
=
Z
(v ss − Rs iss )dt
(2.23)
From equations (2.23), (2.21), the rotor flux is calculated ψ sr =
Lr [( (v ss − Rs iss )dt) − σLs iss ] L0 Z
(2.24)
15
2.3. Position sensorless scheme bs
q
d
vs ψ i sRs
s
σ Ls i s ψ
is
es
s r
L0 ψ s Lr r ρ as
Figure 2.8: Phasor diagram for rotor flux estimation The relationship between the stator flux and rotor flux can be shown in a phasor diagram as shown in Fig. 2.8. The rotor flux phasor is expressed in stationary coordinates as, s s + jψrb ψ sr = ψra
The rotor flux linkage phasor is normalized to get sine and cosine of the rotor flux angle, which is used for resolving stator reference frame phasors to rotor flux reference frame or vice versa. The following equations show the normalization to obtain the unit vectors cosρ and sinρ. This is shown in Fig. 2.9 in the form of a block diagram.
where |ψrs | =
cosρ =
s ψra |ψrs |
sinρ =
s ψrb |ψrs |
(2.25)
q
s 2 + ψ s 2 The rotor flux speed with respect to stationary reference frame ψra rb
is estimated using the relation, ω1 =
dρ dt
By simple mathematics, it can be seen that d d dθ = cosθ (sinθ) − sinθ (cosθ) dt dt dt Hence the speed of the rotor flux can be expressed as follows,
(2.26)
16
Chapter 2. Schemes proposed for induction motor traction drive
vsa
1 s
ψ sas
Lr
ψ
cos ρ
s ra
L0
ψ σ Ls
Rs
s r
a 2+ b 2 i sa
vsb
i sa 1 s
Rs
ψ
s sb
ψ rs Lr
ψ
s rb
sin ρ
L0
σ Ls
i sb
i sb
Figure 2.9: Block diagram for derivation of unit vectors cosρ and sinρ
ω1 =
dρ d d = cosρ (sinρ) − sinρ (cosρ) dt dt dt
(2.27)
Therefore, the rotor speed(ω) in elec-rad/sec is, ω = ω1 − ωslip where ωslip =
2.3.2
(2.28)
isq Tr imr
Stator Voltage Integration Problem
Flux estimation is an important task in implementing sensorless algorithm, because of the fact, that the unit vectors, used for transforming the quantities from stationary coordinate system to rotating frame of reference depend on the flux estimation. Integrating back emf in the machine leads to the flux estimation. The only parameter required is stator winding resistance, which can be easily obtained in most cases and in most of the cases can be considered constant. Hence this method is much preferred than estimation of stator flux from stator currents. However there are practical problems involved in the realization of a pure integrator. Hence motor flux estimation is no easy task. A pure integrator has a dc drift and initial
17
2.3. Position sensorless scheme
value problems. A dc component in measured motor back emf is inevitable in practice. This dc component, no matter how small it is, can finally drive the pure integrator into saturation. If initial value is not selected properly, a constant dc offset will appear at the output. This offset, representing a constant dc flux in a motor, does not exist during motor normal operation. A common solution to these problems is to replace the pure integrator with a first order low pass filter [6]. ψ ss =
1 es s + ω0 s
(2.29)
where ω0 is the filter cut off frequency. By choosing ω0 to be very small, the integrator well approximates to a pure integrator. Therefore it can be seen that small amount of negative feedback is required to maintain the stability of the integrator in the presence of noise or offset errors. This ω0 can’t be selected too small otherwise dc offset will decrease slowly during transients and drive might become unstable. So the drive performs satisfactorily at higher speed but it becomes unstable at lower speed because of inaccurate position and speed estimation.
2.3.3
Removal of integration problem
So we can’t approximate a pure integrater by a low pass filter because of the reasons discussed above. But some fast error decaying mechanizm must be employed to ensure that there is no dc offset. For this we need one more estimate of rotor flux. We know that imr represents rotor flux equivalent current, so L0 imr represents magnitude of rotor flux and ejρ is its position with respect to stator. So we can calculate rotor flux error and add it to the integrator input after multiplying with some gain K. It is shown with equation 2.30 and figure 2.10. ψ s∗ = L0 imr ejρ r ψ ss =
Z
[(v ss − Rs iss ) + K(ψ s∗ − ψ sr )]dt r
(2.30)
The value of K decides how fast error converges to zero. If we select a very high value of K, their exists a starting problem though once started drive behaves ideally, and smaller value of K gives poor steady state performance. So K is selected on trial basis here. This method promises accurate position and speed estimation, right from 1% to any higher speed.
18
Vsa
+ −
+ +
+−
1/s
− +
Lr/Lo
K
Num
ψ ra
Isa
cos ρ Den
Rs 2 2 sqrt(ψ ra + ψrb )
σ Ls ψsb Vsb
+
−
+ +
+ −
1/s
−+
Lr/Lo
Den
ψ rb
ψrb
K
Num
sinρ
Isb Rs
Imr
σ Ls ω 1
Lo ω
+ −
d/dt
− +
sin ρ cos ρ d/dt
isq imr Tr
cos ρ
sin ρ
Chapter 2. Schemes proposed for induction motor traction drive
Figure 2.10: Modified unit-vector derieving algorithm block diagram
ψra
ψ sa
19
2.4. Field weakeneing scheme
2.3.4
Conclusion
This algorithm has been tested on Simulink/Matlab and also verified on experimental set up. This gives very good performance compared to low pass filter integration method.
2.4
Field weakeneing scheme
As discussed earlier in the report that, a smaller power rating motor which accelerates at constant power level above rated speed to acheive full speed, can be used in traction application for better utilization of resources. This can be acheived by a proper field weakening algorithm which must also ensure optimum utilization of DC bus voltage. As DC bus voltage is the major limiting factor of maximum torque capability in field weakening mode of operation, in this section, a proper algorithm for field weakening operation is discussed [3, 5].
2.4.1
Voltage, current limits and optimum operating condition
The maximum fundamental phase voltage that can be acheived from the inverter with DC bus voltage Vdc is
2Vdc π
in six step mode. So we have Vmax =
3Vdc π
>=
q
Vsd2 + Vsq2 , as the
voltage limit. Here we can do some approximation as follows in equation 1.4 and 1.5. Vsd = −ω1 σLs isq
(2.31)
Vsq = ω1 Ls isd
(2.32)
and
So from above equations we get voltage limit ellipse equation as follows i2sd �
Vmax ω1 Ls
�2
+�
i2sq Vmax σω1 Ls
�2
=1
(2.33)
As maximum current is also limited, we have equation of a circle as follows i2sd + i2sq = i2max
(2.34)
Now the operating point must always be inside the region limited by both the boundaries. The equation for torque is given by Md =
2 P L0 [isd (t) isq (t)] 3 2 1 + σr
(2.35)
20
Chapter 2. Schemes proposed for induction motor traction drive
Isq
Isd=σ Isq Maximum torque trajectory
B A
Current limit circle
Torque(parabola) O σ Imax
Isd Imro
σ2+1
Voltage limit ellipse
ω1 Increasing
Figure 2.11: Voltage, current limits and optimum torque trajectory
21
2.4. Field weakeneing scheme
Imro
Kv(1+sTv)
Vmax
+
σ σ2 + 1
sTv
−
Imr
0
Imr ref
+ +
−Imax
2 2 sqrt(Vsd +Vsq ) Vsq Vsd
Imax a Comparator a>b b
Imr/σ
1
sqrt(Imax2 −Imr2 )
Isq limit max *1
MUX
0
*−1
Imax
Isqmin limit
Imr Figure 2.12: Block diagram for field weakening algorithm When both current and voltage limit are applied and torque(parabola) is to be maximized, it can be proved that maximum torque will occur at the common point. From equation 2.33, 2.35, we get maximum torque when isd = σ isq , which is a line. This can be allowed only when the operating point is inside the current limit circle. Now putting the expression isd = σ isq in current limit equation, we get isd = √
σ imax 1 + σ2
When we are inside the current limit, then isd
> Ti
�
as shown in figure. Now we select a value of (TN = 4(2Ti + Tw ))
on the basis of symmetric optimum method [4]. Hence the gain and time constant for the speed controller are obtained as follows, TN = 4(2Ti + Tw ) KN = Here Kt =
3.5.4
P (1 3
2J Kt TN
(3.22) (3.23)
− σ)Ls imr (0). And in per unit Kt(pu) = Kt mIbb .
Design of Flux Controller
The flux loop can be drawn as shown in Fig. 3.8. Choosing the controller time constant as
40
Chapter 3. Implementation
Imr
Kf(1+sTf) ref
+
Isd ref
Kc(1+sTc)
+ −
sTf
−
1/Rs
Vsd
Isd
(1+ sTa’)
sTc Isd
Imr
1 (1+ sTr)
Vmax
Kv(1+sTv)
+
0
+
sTv
−
−Imax
+ Imro
1
2 2 sqrt(Vsd +Vsq )
(1+ sTdq)
Vsq
Figure 3.9: Voltage loop the largest time constant in the loop (Tr ), the flux controller time constant is, TF = Tr = Lr /Rr
(3.24)
The transfer function for the flux loop can be written as, �
KF
��
1
�
KF imr (s) sTF 1+s(T ) � � = �� i = ∗ KF 1 imr (s) TF Ti 1 + sT 1+s(Ti ) F �
�
1 s2 + + s Ti
KF TF Ti
√ Choosing the damping coefficient of the loop as 1/ 2, the gain of the flux controller can be obtained as, KF =
3.5.5
TF 2Ti
(3.25)
Design of Voltage Controller
The voltage loop can be drawn as shown in Fig. 3.9. Here assuming Vmax as input and Vsd as output and then simplifying the model, we get open loop transfer function as, GH = (Kv Rs ) Choosing Tdq = TF and Tv =
TF KF
(1 + sTv ) (1 + sTF ) �
TF sTv 1 + s K F
�
(1 + sT2 )
and selecting the smallest bandwidth, as this loop must be
the slowest, we get this expression,(based on trial and run) Kv = 15Tv
(3.26)
41
3.6. Conclusion The controller parameters are tabularized and presented in the Table. 3.7.
Current Controller
Speed Controller
Flux Controller
Voltage Controller
Kc
Tc
KN
TN
KF
TF
Kv
Tv
0.596
61.2 msec
9.83
193 msec
1.09
43.6 msec
1.5
100 msec
Table 3.7: Controller parameters
3.6
Conclusion
The chapter presented the details of the experimental setup and the development of equations in perunit system. The design of the controllers and their realization are also discussed. The experimental results in different conditions are presented in the next chapter.
Chapter 4 Experimental Results 4.1
Introduction
The experimental setup is explained in detail in previous chapter. In this chapter, the experimental results are presented under different conditions. The results under steady state operation and transient operation are presented. First DC bus is charged to 192.4 V as calculated in the previous chapter. Then, the program developed for sensorless vector control in Quartus II tool is burnt into FPGA.
4.2
Current Extraction Waveforms
These results show fundamental current extraction. Refer Figs. 4.1, 4.2, 4.3, 4.4, 4.5, 4.6
4.3
Overmodulation Waveforms
These results show overmodulation waveforms. Refer Figs. 4.7, 4.8, 4.9, 4.10
4.4
Steady State Waveforms
Under steady state operation with a load of 400W, the different cases are discussed and the corresponding results for these cases are shown. For each of the cases the following waveforms are recorded: Unit vectors cosρ and sinρ, 42
4.4. Steady State Waveforms
Figure 4.1: Vrn and isr waveforms for speed command of 0.7pu (35Hz)
Figure 4.2: irh and isr (extracted) waveforms for speed command of 0.7pu (35Hz)
43
44
Chapter 4. Experimental Results
Figure 4.3: Vrn and isr waveforms for speed command of 0.92pu (46Hz)
Figure 4.4: irh and isr (extracted) waveforms for speed command of 0.92pu (46Hz)
4.4. Steady State Waveforms
Figure 4.5: Vrn and isr waveforms for speed command of 1.25pu (64Hz)
Figure 4.6: irh and isr (extracted) waveforms for speed command of 1.25pu (64Hz)
45
46
Chapter 4. Experimental Results
Figure 4.7: Vref and Vsvpwm(modif ied) waveforms for speed command of 0.75pu (36Hz)
Figure 4.8: Vref and Vsvpwm(modif ied) waveforms for speed command of 0.89pu (44.5Hz)
4.4. Steady State Waveforms
47
Figure 4.9: Vref and Vsvpwm(modif ied) waveforms for speed command of 0.94pu (47Hz)
Figure 4.10: Vref and Vsvpwm (modif ied) waveforms for speed command of 01.02pu (50.6Hz)
48
Chapter 4. Experimental Results
Figure 4.11: sinρ and cosρ waveforms for speed command of 0.0625pu (3.125Hz) Line currents is1 , is2 , Currents in (d,q) coordinate system isd , isq . Case 1: Speed command of 0.0625 pu i.e., 3.125 Hz Refer Figs. 4.11, 4.12, 4.13 Case 2: Speed command of 0.75 pu i.e., 37.5 Hz Refer Figs. 4.14, 4.15, 4.16 Case 3: Speed command of 1.5 pu i.e., 75 Hz Refer Figs. 4.17, 4.18, 4.19. Case 4: Speed command of 2.25 pu i.e., 112.5 Hz Refer Figs. 4.20, 4.21, 4.22
4.5
Transient Waveforms
Under transients section, the different cases are discussed and the corresponding results for these cases are shown. For each of the cases the following waveforms are recorded: Rotor speed ω,
4.5. Transient Waveforms
Figure 4.12: is1 and is2 waveforms for speed command of 0.0625pu (3.125Hz)
Figure 4.13: isq and isd waveforms for speed command of 0.0625pu (3.125Hz)
49
50
Chapter 4. Experimental Results
Figure 4.14: sinρ and cosρ waveforms for speed command of 0.75pu (37.5Hz)
Figure 4.15: is1 and is2 waveforms for speed command of 0.75pu (37.5Hz)
4.5. Transient Waveforms
Figure 4.16: isq and isd waveforms for speed command of 0.75pu (37.5Hz)
Figure 4.17: sinρ and cosρ waveforms for speed command of 1.5pu (75Hz)
51
52
Chapter 4. Experimental Results
Figure 4.18: is1 and is2 waveforms for speed command of 1.5pu (75Hz)
Figure 4.19: isq and isd waveforms for speed command of 1.5pu (75Hz)
4.5. Transient Waveforms
Figure 4.20: sinρ and cosρ waveforms for speed command of 2.25pu (112.5Hz)
Figure 4.21: is1 and is2 waveforms for speed command of 2.25pu (112.5Hz)
53
54
Chapter 4. Experimental Results
Figure 4.22: isq and isd waveforms for speed command of 2.25pu (112.5Hz) Unit vectors cosρ and sinρ, Line currents is1 , is2 , Currents in (d,q) coordinate system isd , isq . Case 1: Speed command changed from 0.75 pu (i.e., 37.5 Hz) to 1.5 pu (i.e., 75 Hz) Refer Figs. 4.23, 4.24, 4.25, 4.26, 4.27, 4.28, 4.29 Case 2: Speed reversal from 1.25 pu (i.e., 62.5 Hz) to -1.25pu (i.e., 62.5 Hz in reverse direction) Refer Figs. 4.30, 4.31, 4.32, 4.33, 4.34, 4.35, 4.36.
4.5. Transient Waveforms
55
Figure 4.23: Rotor reference and actual speed during transition from 0.75 pu (37.5Hz) to 1.5 pu (75Hz)
Figure 4.24: sinρ and cosρ during speed transition from 0.75 pu (37.5Hz) to 1.5 pu (75Hz)
56
Chapter 4. Experimental Results
Figure 4.25: Vmax and Vdq during speed transition from 0.75 pu (37.5Hz) to 1.5 pu (75Hz)
Figure 4.26: imr (ref erence) and imr during speed transition from 0.75 pu (37.5Hz) to 1.5 pu (75Hz)
4.5. Transient Waveforms
57
Figure 4.27: isd (ref erence) and isd during speed transition from 0.75 pu (37.5Hz) to 1.5 pu (75Hz)
Figure 4.28: isq (ref erence) and isq during speed transition from 0.75 pu (37.5Hz) to 1.5 pu (75Hz)
58
Chapter 4. Experimental Results
Figure 4.29: is1 and is2 during speed transition from 0.75 pu (37.5Hz) to 1.5 pu (75Hz)
Figure 4.30: Rotor reference and actual speed waveform during the speed reversal from 1.25 pu to -1.25 pu
4.5. Transient Waveforms
59
Figure 4.31: sinρ and cosρ waveform during the speed reversal from 1.25 pu to -1.25 pu
Figure 4.32: is1 and is2 waveform during the speed reversal from 1.25 pu to -1.25 pu
60
Chapter 4. Experimental Results
Figure 4.33: Vmax and Vdq waveform during the speed reversal from 1.25 pu to -1.25 pu
Figure 4.34: imr (ref erence) and imr waveform during the speed reversal from 1.25 pu to -1.25 pu
4.5. Transient Waveforms
61
Figure 4.35: isd (ref erence) and isd waveform during the speed reversal from 1.25 pu to -1.25 pu
Figure 4.36: isq (ref erence) and isq waveform during the speed reversal from 1.25 pu to -1.25 pu
62
Chapter 4. Experimental Results
VOLTAGE
220 V
CURRENT
2.5 A
POWER
0.55 KW
POLES
4
SPEED
1500 rpm
Table 4.1: Details of the induction motor-2
Figure 4.37: isq (ref erence) and isq for speed command 1.25 pu (62.5 Hz) and load 129.2W
4.6
Machine-2 Loading Waveforms
For loading purpose one IM-DG set has been used. Parameters are given in this table 4.1. Two transients of unloading and loading are captured in the waveforms 4.37 and 4.38.
4.7
Conclusion
The performance of the proposed scheme under steady state as well as during the transients are presented. A good dynamic performance of the drive is observed under both load changes and changes in reference speed. Performance in six-step mode is also very good. In an actual
4.7. Conclusion
63
Figure 4.38: imr (ref erence) and imr for speed command 1.25 pu (62.5 Hz) and load 129.2W traction system, most of the time, motor will be operating in field weakening mode. So sixstep steady state performance is required to be good enough. Some important points are mentioned here. 1. Controller parameters calculated are found to be faster so they have been slowed by tuning. 2. K value in sensorless algorithm which is found by tuning, is nearly same in simulation and experimental program. 3. Vdc is uncontrolled here and during transients starts fluctuating. This hampers the transient performance. 4. If algorithms are implemented on 20-bit representation and ADC is of higher bits, performance will certainly improve. 5. In overmodulation mode prior to six-step, subharmonics get generated as switching frequency is 770Hz(low) so carrier frequency can be increased for that region but this requires a hysteresis band for stability and for certain speed range inverter will be switching at high rate.
References [1] Vikram Kaura,“ A New Method To Linearize Any Triangle Comparison Based PWM By Reshaping The Modulation Command ”,IEEE transactions on Industry Applications, Volume 33, NO.5, September/October 1997, Pages 1254-1259. [2] Ashwin M. Khambadkone,“ Compensated Synchronous PI current controller in Overmodulation range and Six-step Operation of Space-Vector-Modulation Based Vector Controlled Drives ”,IEEE transactions on Industrial Electronics, Volume 49, NO.3, June 2002, Pages 574-580. [3] Sang-Hoon Kim,“ Maximum Torque Control of an Induction Machine in the FieldWeakening Region ”,IEEE transactions on Industrial Electronics, Volume 31, NO.4, July/August 1995, Pages 787-794. [4] Werner Leonhard, “Control of Electric Drives”, Springer-Verlag Berlin, Heidelberg, 1985. [5] V.T. Ranganathan ,“Field Oriented Control of AC drives”, Lecture notes of Electric Drives, IISc Bangalore. [6] B. Srinivas Rao, “DSP based sensorless vector control of induction motor”, M.E. thesis, EE Dept, IISc, Bangalore, January 2003. [7] S. Venugopal, “Study on Overmodulation Methods for PWM INVERTER Fed AC DRIVES”, M.Sc. thesis, EE Dept, IISc, Bangalore, May 2006. [8] N. Praveen Kumar, “FPGA based sensorless vector control of induction motor”, M.E. thesis, EE Dept, IISc, Bangalore, July 2006.
64