1
The vertical profile of snow and rain observed in Tokyo by Micro Rain Radar Tomoki Koshida1, Shin Miyazaki2, Taikan Oki2, Shinjiro Kanae2, Kei Yoshimura2 and Masahiro Koike2 2
1 Metocean Environment Inc., Yokohama, Japan Institute of Industrial Science, University of Tokyo, Tokyo, Japan
Abstract We observed snow cover on December 31st 2004 by passing cyclone through south coast of Japan. In this situation snow had fallen at the beginning and then had changed to rain that was more than 6mm/hour. This precipitation was observed by Micro Rain Radar (MRR) that have installed on the roof of Institute of Industrial Science, University of Tokyo. MRR is the low cost K-band Doppler radar, but able to observe the spectra of radar reflectivity by Doppler velocity vertically. MRR have been usually used to observe rainfall. There is no report of MRR about snow and rain cloud especially at urban area. In the paper, we report the property of precipitation cloud observed by using MRR, which brought snow cover in Tokyo on the end of 2004. Vertical observation of spectrum was useful to classification of snow and rain.
1. Introduction The classification of surface precipitation (snow/rain/mixture) is important for management for urban transportation. We had experienced snow cover in Tokyo on Dec 31st 2004 after 24years had passed from the last time. In this case, it was snow at the beginning then changed to rain. It is said that snow falls in Tokyo when the center of cyclones passes through the south of Hachijyo Island but we observed snow accumulating in Tokyo by passing cyclone just through the south of Japan coast. And we observed rain after snow in the low temperature condition, almost 0 degree on the ground level. This precipitation cloud was difficult to be classified by precipitation type. As far as precipitation classification concerned, for example vertical looking Doppler radar is useful. Ralph et al. (1995) used UHF band vertical pointing radar (wind profiler). But wind profiler is too large to operate urban area. Another instrument is POSS (Sheppard and Joe, 2000) which is low cost simple Doppler radar. The object of POSS is the precipitation at surface and POSS does not observe vertical profile. So classifying area is limited near installed point. If we can infer the vertical position of melting layer, then it is easy to draw the boundaries between snow, rain, and mixture on the ground. We have observed precipitation cloud by using MRR (Micro Rain Radar, METEK GmbH) on the roof of Institute of Industrial Science, University of Tokyo at Meguro ward Tokyo Japan since Aug. 2003. MRR is a low-cost and small instrument which can observe radar reflectivity by each Doppler spectrum (Loffer-Mang et al., 1999), and calculated rain drop size distribution at the each level vertically by using equation of Gunn and Kinzer (1949). We had a chance to observe the precipitation cloud described above by MRR. Corresponding author: Tomoki Koshida, Metocean Environment Inc. Hayabuchi 2-2-2, Tsuzuki ward, Yokohama-city, Kanagawa prefecture, Japan Email:
[email protected] Ⓒ2005, the Meteorological Society of Japan.
MRR is mainly used for rain observation in Europe and the results were reported. Peters et al. (2002) compared MRR with rain gauge data to characterize high frequency observation period and reported some observation sample including bright band. Wagner et al. (2004) reported vertical profile of rain drop size distribution deduced by MRR and availability of calibration to C-band weather radar. But there is no report that MRR is used for observation of rain and snow at once. This paper reports the vertical structure of precipitation cloud which brought snow, rain or mixture under the condition of low temperature, by using MRR observation. And such an investigation is useful to detect melting layer and improve the algorithm to classify between snow and rain.
2. Synoptic situation and Data MRR (Micro Rain Radar) is vertical looking FMCW Doppler radar whose wave length is 1.2cm, K-band. It can observe the radar reflectivity and Doppler spectrum from falling precipitation particle by the step of 29 range bin up to 6000m. We observed precipitation at the 29 level by 100m interval up to 2900m height level corresponding to low cloud top winter time. Data sampling interval was one minute. Double cyclone systems were located over the Honshu Island on Dec.31st 2004. Southern cyclone was located near the Sikoku Island at 9:00, and moved faster than the northern and moved over at 12:00. Then the southern one located just above Tokyo by the bulletin of weather map. Heavy rainfall is expected in this relation of double cyclone system so that the southern move faster than the northern. The record of precipitation at Ootemachi, Tokyo Japan was 6.5mm at the 15JST MRR well observed radar reflectivity from snow and rain in this situation. But when snow accumulated on the antenna much, signal from snow were attenuated. So, in this study we picked up the two precipitation period as follows when strong characteristic reflectivity was recorded by showing time-height cross section. 1) Snow Period: from 12:30 to 13:30 2) Rain Period: from 15:15 to 16:00
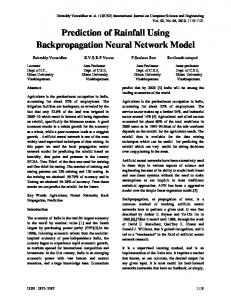
3. Observation of snow cloud 3.1 Spectra of radar reflectivity of Snow cloud Figure 1 shows the Doppler spectrum of radar reflectivity index at each height averaged over Snow Period. The vertical axis of Fig.1 is the amplitude of density of radar reflectivity index, usually referred as Z, corresponding to Doppler velocity. We summarize the structure of snow falling cloud in this time as following three layers. These layers were defined by characteristic change of Doppler spectrum. The boundary of each layers are shown by broad solid lines in Fig. 1. Among those layers, layerS2 had the largest
2 Koshida et. al , The vertical profile of snow and rain observed in Tokyo by Micoro Rain Radar increase of radar reflectivity downward and generating and growing particles were suggested. LayerS1. From 2900m to 2000m height: The peak of Doppler spectrum increased downward gradually and distribution of Doppler velocity did not change much. The Doppler velocity corresponding to the peak remained about 1m/s. LayerS2. From 2000m to 1200m height: The peak of Doppler spectrum increased downward, and the distribution of Doppler velocity got broader. Doppler velocity corresponding to the peak gradually shifted 1m/s at the height of 2000m to 2m/s at the height of 1200m. LayerS3. From 1200m height to the surface: The peak of Doppler spectrum decreased quickly and the distribution of Doppler velocity remained as broad as that of 1200m.
So the speculation that deposition dominated in LayerS1 and aggregation dominated in layerS2 might be consist with previous studies
100 100m 200m
Doppler Spectrum of Radar reflectivity index(mm6/m3/(m/s))
300m 400m
0%
500m 600m
10
50%
100%
700m 800m 900m 1000m 1100m 1200m 1300m 1400m
1
1500m 1600m
0
5
10
1700m 1800m
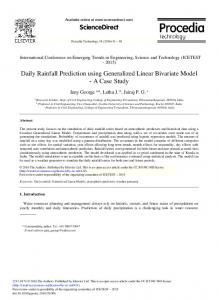
Fig. 2. Vertical profile of temperature and relative humidity by MSM prognosis to 12JST Dec. 31st 2004 (09JST initial) at the grid of 35.66N and 139.7E. Black line denotes temperature and red line denotes relative humidity.
1900m 2000m 2100m
dbz
2200m
0.1
2300m
velocity
2400m 2500m 2600m 2700m
0
2800m 2900m
velocity(m/s) 1 2 3
4
3000
0.01 Doppler Velocity(m/s)
3.2 Comparison of snow cloud to Meteorological elements The vertical profile of temperature and relative humidity are shown in Figure 2 by MSM (Meso Scale Model by Japan Meteorological Agency) prognosis values at 12JST on 31st Dec 2004 whose initial time was 9JST at the nearest grid (35.66N 139.7E) of MRR observation site. Black line denotes air temperature and red line denotes relative humidity. We thought the prognosis was reliable to discuss because the location of the southern cyclone was match between prognosis and Bulletin Weather map at that time. Fig.2. suggested that there was frontal zone from 850hPa to 900hPa and water was almost saturated from 700hPa to 850hPa. Murakami et al (1992) reported rapid depositional growth layer existed just above the frontal zone, where was water-saturated. So in LayerS1 and LayerS2 snow particles were thought to grow by ice deposition. In LayerS2, precipitation grew more than those in LayerS1. The temperature range in LayerS2 was from -4 to -1 degree centigrade. Hobbs et al. (1974) reported that temperature near 0 degree centigrade was favorable for ice particles to aggregate.
2500 height(m)
Fig. 1. Doppler spectrum of Radar reflectivity index at each observation level, averaged over Snow Period (12:30-13:30 Dec. 31st 2004).
deposition
2000
aggregation
1500 1000
sublimation
500 0 0
10
20 dBZ
30
40
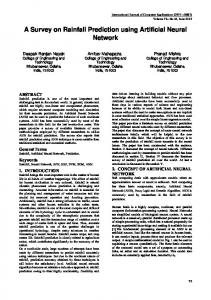
Fig. 3. Doppler spectrum of Radar reflectivity index at each observation level, averaged over Snow Period(12:30-13:30 Dec. 31st 2004). As mentioned before, below the 1200m height the peak of spectrum decreased downward. Fig.2 suggests the layer from 900hPa to the surface was quite dry. A lot of snow particles were suggested to be sublimated in dry area, LayerS3. Figure 3 summarized the vertical profiles of radar reflectivity index and Doppler speed averaged over
3
4. Observation of Rain cloud 4.1 Spectra of radar reflectivity of Rain cloud Figure 4 shows the same property as Fig.1 but Rain Period. And we averaged each value shifting 100m (minimum of range bin) by each 7minutes to the end of period, that is 16:00, because the height of strong echo level ascended by 700m during 45miniutes in the time height cross section of radar reflectivity (Supplement 2). As a result, echo top was arranged at almost the same level during averaged period. The heights shown in Fig.4 are referred those of 16:00. We couldn’t define clearly bright band structure during period. So the cloud type of this period was said to be convective. We could define the four typical layers as follows by the Doppler spectra profiles on Fig.4. LayerR2 shows the great increase of radar reflectivity and the generating of large number of precipitation drop was speculated. LayerR1. From 2900m to 1900m height: The peak of Doppler spectrum increased downward gradually. And the distribution of Doppler velocity got slightly broader. LayerR2. From 1900m to 1500m height: The peak of Doppler spectrum increased and those distributions got broader than LayerR1. LayerR3. From 1500m to 1000m height: The peak of Doppler spectrum remained large value and corresponding Doppler velocity shifted 4ms/ to 8m/s. LayerR4. From 1000m height to the surface: The peak of Doppler spectrum remained large value. Those distributions did not changed much. 4.2 Comparison of Rain cloud to Meteorological elements The vertical profile of temperature and relative humidity are shown in Figure 5 at the time of 15JST that was the initial condition of MSM on Dec 31st 2004. The figure shows the 0 degree level was at the height of 850hPa and below 0 degree level the layer was stable above the surface. The boundary of this stable layer, 850hPa, was corresponding to the upper boundary of the layerR3 which was presumed melting layer by MRR. In LayerR1, the small peak of spectrum of reflectivity appeared at around 1-2m/s. This character resembled composite of LayerS1 and LayerS2. So precipitation particles were snow in this layer. Increase of radar reflectivity seemed corresponding to not only birth and also growth of snow particles. In layerR2, significant spectrum appeared around the larger value area than 2m/s (typical velocity of snow) of Doppler velocity below the level of 1900m.
10000 100m 200m 300m
Doppler Spectrum of Radar reflectivity index(mm6/m3/(m/s))
Snow Period with inferred precipitation process. Those values were calculated from the spectra of radar reflectivity in Fig.1. There was large Doppler velocity area from 2700m to 2900m around MRR observation limit. These large values might include noise at large Doppler velocity. In snow period radar reflectivity was not so strong that maximum value was at most 20 dBZ at 1200m height, where snow particles grew rapidly. From 1200m to the surface, Doppler velocity was almost the same as about 2m/s, but radar reflectivity index decreased gradually to the surface. The Doppler velocity of less than 2m/s consists of a typical value of snow falling velocity observed by Ralph et al. (1995) using wind profiler of UHF band. So we might well infer that precipitation be snow above the ground.
400m
1000
500m 600m 700m 800m 900m 1000m 1100m
100
1200m 1300m 1400m 1500m 1600m 1700m
10
1800m 1900m 2000m 2100m 2200m 2300m 2400m
1
2500m
0
5
10
2600m 2700m 2800m 2900m
0.1 Doppler Velocity(m/s) Fig.4. Same as Fig.1. But for Rain Period (15:15-16:00 2004/12/31). The height was referred to 16:00.
0%
50%
100%
Fig. 5. Same as Fig. 2, but for MSM initial of 15JST 2004/12/31. And the peak of Doppler spectrum increased downward from 1900m height. There was characteristic change that the distribution of spectrum got broad. Ralph et al. (1995) set the threshold about hydrometers by observation of UHF band wind profiler and 3m/s was the lower boundary of rain. Therefore most of precipitation seemed snow in LayerR2. The speculation of snow was consistent with temperature profile. But, there were particles falling faster than 3 m/s, so it was thought that melting started partially at this height. The increase of radar reflectivity and Doppler velocity seemed to consist of such situation that snow flakes aggregated at preferable 0degree level and partial melting snow particles got faster and larger with accretion of surrounding snow flakes or cloud drops.
4 Koshida et. al , The vertical profile of snow and rain observed in Tokyo by Micoro Rain Radar
dbz 0
5. Summary
velocity velocity(m/s) 2 4 6
8
3000
height(m)
2500
deposition
2000
aggregation (partial melting)
1500
melting
1000
Rain
500
Acknowledgements
0 0
20
40
The precipitation cloud was analyzed by MRR, which is observing Doppler spectrum. The analyzed precipitation was snow at the beginning and rain at the end of event at Tokyo. Japan Meteorological Agency had forecasted the type of precipitation by using air temperature and relative humidity at the surface adding the upper condition. Matsuo and Sasyo (1981) reported the error has occurred at the case of inversion existence at the surface. MRR could detect melting layer in such inversion case. Therefore vertical observation by using low cost MRR could be useful to classify precipitation. And more, we will be able to detect the spatial distribution of snow/rain area when several sets of MRR are installed at different points.
60
80
dBZ Fig.6. Same as Fig.3. But for Rain Period (15:15-16:00 Dec. 31st 2004). Vertical axis is relative height corresponding to the 3000m height at the time of 16:00. In the layerR3, we can see increase of Doppler velocity and little change of radar reflectivity index. The peak value of spectrum shifted 4m/s of Doppler velocity at 1500m height to 8m/s at 1000m height in Fig.4. But the magnitude of spectrum did not change much. Drummond et al. (1996) pointed that the reflectivity was same between above and below the melting layer if there was no breakup, aggregation, or growth of the precipitation particles as they melt. So increase of Doppler velocity suggested precipitation particles were melting in this layer. And this layer was thought to be a melting layer. In the layerR4, the spectra didn’t change much. The property of rain drops seemed to remain the character at the end of layerR3. Figure 6 shows the same property as Fig.3 but for Rain Period. There was large Doppler velocity in the high layer from 2200m to 2900m. In calculating algorithm of vertical velocity, observed wind range has been set from 0 to 12.1m/s. We might overestimate Doppler velocity in this period which might include large Doppler velocity as some Nyqist velocity of negative value (upward velocity). MRR could investigate the change from snow to rain by using spectra of radar reflectivity. That is the potential ability of detection of a melting layer. In this case LayerR3 and partial LayerR2 was the melting layer. But it is difficult to detect the clear boundary between liquid water content and ice water content. For example Ralph et al. (1995) set 3m/s as the lower boundary of rain, but it was probable that there were raindrops whose falling velocity were 3m/s. The rain drops whose diameter were about 0.7mm, were falling with the same velocity by equation of Gunn and K intzer (1949). And Graupel often has more than 0.3m/s falling speed. So it is next task that algorithm will be made to detect clear boundary by melting particle model using drop size distributions observed by MRR. In that algorithm the ratio will be calculated about rain (liquid water) to snow (ice water).
MSM data were downloaded from Kitsuregawa laboratory of Tokyo University and deduced program were made by Dr. Wakatsuki of Nagoya University. Dr. Murakami of Meteorological Research Institute provided comments and suggestions for analysis.
Comments and supplements 1. MRR observation on the roof of IIS is shown in the Supplement 1. 2. Bulletin Weather map on 15JST. Dec 31st 2004 is shown in the Supplement 2. 3. The time height cross section on Dec. 31st 2004 is shown in the Supplement 3.
References Drummond, Fiona J., R.R. Rogers, S.A. Cohn, W.L. Ecklund, D.A. Carter and J.S. Wilson, 1996: A New Look at the Melting Layer. J. Atmos. Sci.: 53, 759–769. Gunn, Ross and Gilbert D. Kinzer, 1949: THE TERMINAL VELOCITY OF FALL FOR WATER DROPLETS IN STAGNANT AIR. The Journal of Meteorology: 6, 243–248. Hobbs, P. V., S. Chan and D. Locatelli, 1974: The dimensions and aggregation of ice crystals in natural clouds. J. Geophys. Res., 79, 2199-2206 Löffler-Mang, Martin, Michael Kunz and Willi Schmid, 1999: On the Performance of a Low-Cost K-Band Doppler Radar for Quantitative Rain Measurements. J. Atmos. Oceanic Technol.16, 379–387. Matsuo, T., Y. Sasyo and Y. Sato, 1981: Relationship between types of precipitation on the ground and surface meteorological elements. J. Meteor. Soc. Japan, 59, 462-476. Murakami, M., Y. Yamada, T. Matsuo, H. Mizuno and K. Morikawa, 1992: Microphysical Structure of Warm-Frontal Clouds -The 20 June 1987 Case Study- J. Meteor. Soc. Japan, 70, 877-895. Peters, G., Fischer, B. and Andersson, T, 2002. Rain observations with a vertically looking Micro Rain Radar (MRR). Boreal Env. Res. 7, 353–362. Ralph, F.M., P.J. Neiman, D.W. van de Kamp and D.C. Law, 1995: Using Spectral Moment Data from NOAA's 404-MHz Radar Wind Profilers to Observe Precipitation. Bulletin of the American Meteorological Society: 76, 1717–1739. Sheppard, B. E. and P. I. Joe, 2000: Automated precipitation detection and typing in winter: A two-year study. J. Atmos. Oceanic Technol., 17, 1493-1507. Wagner, A., M. Clemens and J. Seltmann, 2004: Vertical profile of drop size spectra. Proceedings of ERAD (2004): 402–406 (Manuscript on 27 august 2005)