Abstract. The wavelet lransform is inuoduccd as a powerful tool for monitoring power quality problems generated due to dynamic performance of induslrial plants ...
IEEE Transactions on Power Delivery, Vol. 14, No. 4, October 1999
1469
Power Quality Detection and Classification Using Wavelet-MultiresolutionSignal Decomposition Electrical & Computer Englneerliig
A.M. Gaouda and M.M.A. Salaina
M.K. Sultan Advaaced S y s t e m Groiip
University of Waterloo Waterloo, Ontario, Canada
Hatch Associatea Oiitariu, Canada
The wavelet lransform is inuoduccd as a powerful tool for monitoring power quality problems generated due to dynamic performance of induslrial plants. The paper presents a inultiresolution signal decomposition technique as an efficient m c t h ~ lin analyzing tmnsicnt events. The multiresolution signal decomposition has the ability to detect and lociilize transient events and tiirthcrmore classify tlcfercnt power quality disturbances. It can also bc used to distinguish among similar disturhanccs.
A . Y . Cliildiaoi I':lectrical & Cornpiiter ICiigiiiecriiig ltoysl Military College
Kingston, Ontario, Caoada
Reccntly wavelet arialysis is proposctl in thc literature as a new tool for moniloring power quality problems. Most 0 1 tile work donc in powcr quality xea deals with this problem either from lhc detection aiitl localization point of vicw or fioin data coinprcssioii frame. , 111 121 multiresolution signal tlecomposilion was applied to detcct aiitl localize dilferciit power quality problems. The squarctl wiivclet cocflicicnts are iisctl to lint1 ii uiiiquc feaiure cor difltrcnt power quality problems of noisy signals. 11 was proposed (bat a proper classification t w i might tlicii k Keywords: power quality, wavelet analysis, and used to classify dilkrenl power quality problems. In 141, niultircsolution signal decomposition. the wavelci analysis technique was used to reconsiruct Iransient signals with only sinall number of wavelet I Introduction cmfficicnts. Howcvcr future work is required to categorize different types of faults. Io [71 wavelet transform was used Orie o l the main problems m;inolacturing intlostrics is now to :iiialyze power system transients. Multiresolulioii facing is the dislortion io the electrical supply, This power analysis was proposed as a new tool that may he used to quality problem interrupts tlic sensitive manufacturing clclcct different disturbmccs and identify tlicir sources. In devices and resulls iii very expensive consequences. It IIAS comprcssioii area, wavele~analysis was also used as ii data hceii documeiitcd in [l] that an intcrruption i n tlic clcctric compression tool 15 I. This tcchniquc was applied Io actuiil power or 30% voltage sag for very short diiralion can rcsct power quality &ita and llic comprcssioii nitio achieved WRY io Llic range of 1-6 witb noriniilizctl mcan square crrcirs of programmable conlrollcrs for the entire assembly liilc. the order of 1 0 . ' to ~ 10.~. To improve the electric power quality, sonrccs of disturbances must bc know end conuollcd. This ciin k Howcvcr all the ehovc-mcntioiicrl approaches dealt with done by first dctect, localizc, and classify tliffcrent power quality problems, none of them prcseut 21 real disturbances. To iichievc this ii sensor-based on line, real cl;issilic;itiori nielliotlology that ciiii he used io classify lime evaluation dcvicc is necessary. A feasible ;ipproech to tliffercnt power quelity probleins. adiicve this goal is to iise ii powerful tool that iias Ute ability to analysis different power quality problems siinullancously 111 lhis paper we used 11ic multiresolution analysis in both time and frequency domnins. Wavelet transform caii technique to detcct aud localize tliffcrcnt power quality satisfy this type of analysis. Furlhcrmore, multircsoliitioii problcms. Furthermore, we introtluce Ilic s~;md;irtl signal decompfi$itioIi allows valuable infornulion lo Ix' deviation wrve at different rcsolutioii levels a s a iicw gained in order to detcct and classify dilferent powcr quality feature to clnssify deferent power qu;ility problems. prohlems. The paper is organized as follows. In scctioii II wc present pE.207.pWRD.0.01-1999 A paper recommended and approved by a general introductioii of tlic wavelet transform and ~EEETransmission and Distribution committee of the lEEE Power multiresolution analysis. Seclioii 111 prcserirs tlic ~ ~Society for publication ~ ini the IEEE Transactions ~ ~on Power ~ ~ i ~ ~ Delivery. Manuscript submitted April 7, 1998; made available for application of multiresolution analysis in power quality tlctectioii and classiticalion. Results of 11ie proposed printing January 28, 1999. inclhod arc presented iii ,scctioii IV. Finally a conclusioii ;uid rcfcrciiccs ;we presented in scctioii V ;ind VI.
Abstract
~
~
0885-8977/99/$10.00 0 1999 IEEE
~
1470
-
I1 The wavelet Transform and Multiresolution analvsis
Tlic translated
The wavelet transforin represents Ilie sigtlal as a Sum of wavelets at dilfereiit locations (positious) and scales (duration). Tlie wavelet cmlticiciits work as weights ol llic wavelets to rcpreseilt the sigilal at these locations a ~scales. l The wavelet traiisCorin caii be accomplished in tlircc different ways. The Continuous Wavelet Transform (CWT) where one obtains the surfacc oC the wavelet ccefficiciits, for different values of scaling and traiislatioii factors. It maps ii functioii of a continuous variable iitto a Curictioii OC two coiitiiiuous variables. Tlie second traiisforin is know] as llic Wavelet Series (WS) which maps a fuiictioii of continuous variahlc into B sequeticc of coefticienls. The third type of Wavelet traiisforin is the 1Xscretc Wavelet 15.numsfowr (DWT), which is used to tlecoinposc a tliscritiacd signal itilo dilfcreiil resolution Icvcls. It maps a seyueiicc of niiinkrs into a different seqiiencc ol‘ numbers.
and scaled version
of tlic wavelet,
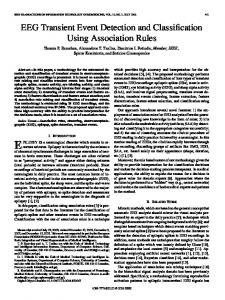
W ( 2 ’ t - k ) , used iii MRA will build ii time-frequency picture of tlie decomposed signal. Multiresolution signal decomposition is used to achieve two iinportaiit properties. Tlic first is the lixaliz:iti~~iiproperty iii time fbr airy transieiit plieiioineiizi. This will appeal by tlie presence oT I;lrge cl~llieiell,s rile tirllc of distllrbilllcc, secolld property is the partitioning of tlic signal ciiergy at tliffercnt frequency bands. This gives an idea ol‘ the frequency coiiteiit of tlie distorted signal. The two mentioned properties are illustratctl iii Fig.l. This Figure shows four level MRA oT a sigiial distorted with disturhaiice. Using scalcd and traiislatcd version of (lie wavclct and scaling functions, Uie distorted signal is decoiiiposctl to [our dctailctl vcrsiais and one iipproxitn:itcd. The lsaiisicii t pliciioincna is ilctcctctl aiid localizctl at the fiiicr level (dclail I). Tlic eiiergy of the ilistorlcd signal is partitiotied at (IilTcreiit licquciicy baiitls, (4.096-8.196Icvell, 2.048-4.096 Icvcl?, _..kHr).
Coinpared with conliiiuons wavelct transform (CWT), the discrete wavelet transform (DWT) is su[ficieiit to tlecoinposc
-
111 Wavelet Awulications in Power Quality
and rccoiistruct most power quality problem. It provides An iinportaiit industrial application enough information, aiid offers liigli reduction in tlie
coinputatioiial time. Wavelet transforms have been proven to bc very efficieiit in sigiial aiialysis. This efficiciicy comes hoin the rcductioii io Lhc nuinkr of coefficients as the scaling factor increases. The wavelet cxpailsioll scpwates sigllal colnpoiielits Ilia overlap in b0U1 time arid frequency. Wavelets can be desigiied to fit clifferait applications. The calciilatioii of tlie discrete wavelet traiisform is well matched to digital computer [12].
In Multircsolutioii aiialysis (MRA), wavelet fuiictioiis aiid scaliw fu1icriolls are used as building blocks to dccoinposc and coiistruct the signal at different resolution levels. The wavelet fuiictioii will gcnerate tlic detail versioii oI tlic dccoinposed sigiial atid tlic scaling fuiictioii will gciicrate the approximated version of llic dccoinposed signal. This iiiathcinatically caii bz prescutcd by this equation:
,f(t)
~
zco k
I-I
(k)# (t - k )
+
C z d, ( k ) 2 j / 2 W ( 2 J-1k ) k j=o
where, c , is the ‘0’level scaling cmfiicient aiid w;ivelct ccefficicnt
iit
scale .j.
scaling sullc~ioll illid WavClet tlie trailslation cwfficicnt.
b, ( f. )
fllllctioll
oi tlic Multircsolution analysis ( M U ) is for inoiiitoriiig power quality prol,lcins due to dpiamic perforniaiice of tlic induslrial plaiits. MRA c ~detect i and diagiiose ilelkcts, aiid provide early warning of iinpeiitliiig power quality problems. Using tlic properties tile features ill Lhedecolnl)osed c)l the uallsforln waveforin, one will have tlie ability to extract importxi1 illforlnatioll signal, ili~o,.~nation eilll be used to detect any distortiai in the electric powcr end to ckissily the type of this powcr quality problem. Iletection and Localization
In the proposed method, disturbance detection and localizatioil is perforlncd tllall tile wavclct dl)lnaill tlie time or frequency donxiin. Using Uic Multiresolutioi~ signal tlecoinpositioii Lecliniqiic iiiie ciiii tlecoinposc the distorted signal iiim tlil‘fereiit resolution Ievcls. Any cliaiigcs iii llie stnoothiiess of the sigiial cati bc dctectetl aiid localized zit the liticr resolutiou Ievcls. As fa;is dctcctioii and localization is concerned, tlie lirst liner deconipositioii Icvcls of die distorted signal,
......(I )
f’(r)
d, is the
w,
-
.
=
Cd,(k)2J’2W(2Jfrkk)
......( 2 )
iu’c norinally ;idequate to dctect iiiitl 1oc;iliZc this and w ( t ) are the tlisturbancu. However, thc other coarser resolution lcvels . . LUC uset1 to extract Inore features that c m liclp ill llic aIld k is cl, , .’ . daailicatioii process. Fig. 2 shows the detcctioii a i d localizatioil of voltage sag at the finer resoliitioii level, I+&.
~
1471 cletail 1
-0.2 0.116
0.48
0.5
0.54 [SI
0.52
detail 2
0.52
11.54
Is] detail 3
0.46
0.5
"..U
-
0.46
0.48
u.5
0.52
0.id
Approx. 4
0.46
0.48 0.5 0.s2 Tlic input distorted signal
0.54 LS]
Fig. 1: Four level iiiultiresolutioii signal clecoinposition ol a signal tlistortcd willi lraiisient tlistortioii
Classification:
1.5 I
Classification of tliflercnt powcr quality prohlcins proposed inctlicd is related to:
0.5 0 -0.5 -1 -1.5 1
0.05 0 -0.05 -
iii
ilic
l'arseval's theorem
-
If 11ic used scaling lunction ant1 11ie wavclets lorin iui orllioiiorinal basis, then Parseval's throrciii rclates tlic energy o l thc distorted signal to llie cncrgy in each of ihc cxpansiou components and their wavclcl ctxlficienls. This ineatis that (tic norm or'tlic energy 01'tlic signal can k partitioncd in terms of tiic expansion coellicieiits 1121.
1412
The eiicrgy of the distorted signal will be partitioned at different resolutioii levcls in diffcrwt ways depending on the powcr quality problem at hand. Tlic standard deviation can bc considered as a measure of the eiicrgy for a signal with zcro ~iicaii.Therefore, the standard dcviatioii at different rcsolutioii levcls of the decomposed sigiial, stti-MRA, is proposed in this tcchniquc as feature to classify different powcr quality problems. Vreqiiency content
Pure sine wave: Fig. 3 shows the pure sine wave (Fig. 3a) and the thrcc finer tlccoinpositioii lcvcls (Figs. 3b, 3c, and 3tl). The horizontal axis presents 111ctime in sccontl and the vertical axis presents the magnitude. The std-MRA c~irvcis shown io Fig. 3c. The horizoutal axis prcscnts tlic differcot rcsolution levels and the vertical axis presciits tlie inagnitudc of the stantlard deviation iit diflerent resolution levels.
Multiresolution aiialysis decomposes and represents the cncrgy of the distortcd signal at different frequcncy ranges. This will give us a11 idea about llie frequency content of lhe sigual and inay help io classifying different phcnoinena. In case of sag, swcll, or harmonic clistortioii cvctit, the energy distribution o l Ihe dislortetl signal (std-MRA) will he changed at the resolution lcvcls related to Ihe frequency bauds of {liedistortion io I ~ L sigiial. !
In this casc, all the finer rcsolution levcls (Figs. 3b, 3c, a i d 3d) do not detect any changes. The pure siue wiivc std-MRA curve will hc used as R rcfcrcnce in coinparisoil with other cases. It will appear as a dotted line in each of
IV- Applications and Results:
The sag is detcctctl and 1oc;ilizcd io all llic liner three decomposition lcvcls Figs. 4b, 4c, atid 4d. It is clear from tlie Figure that the duration o l Uic sag CHII bc easily measured, and hcncc determiticti if tlie sag plicnoineiiii is iostantaneous, moineiilary, or tcinporary. Tlie inaxiinuin value of the std-MRA curve is tleacascd with an iiinount related to the sag inagiiitude and duration as shown in Fig.
Using the localhation property gained lrom tlic liner resolution lcvcls and the sttlLMRA curvc, a tiinc-liequency picture of the distorted signal is couslructed. Tlie valuc of Uic std-MRA curve is changd to represent the cncrgy distribution of the distortion at different frequency bands aud zit certain lirnc. Using this information, one call classify differcnt power quality problems. This fcature vector, std-MRA, is constructed as follows: i. Using MRA, decompose the distorted signal into different resolution levcls (detail versions). The nuinbcr of levcls is selected to cover the highest frequency band of in terest. ii. Find the smdard deviation for each detail version at differcot rcsolulion levels of tlie distorted signal. iil. Construct the std-MRA curve by plotting the stmdard deviation for cach resolution level. Thc first dctail versioii of the decoinposcd signal will present the time information of any transient event.
The proposed monitoring Lechniqiic is applied oii many power quality problems such a s sag, swcll, outage, 1i;irinonic distortion, and oscillatory transient All the data a x gciierntctl using Matlab code. The proposcd inonitoriiig technique detectcd and localized all tlic transient disturbaims in the distortcd signal using D;iubcchies 4 wavelct.
To illustrate the efliciency of the proposed tcchniqcic, it is applied oii Ihe following power quality problems. It is used to cletrct, localize and classify diffcrcnt phenoinena based on the following rulcs:
Ihc coining cases.
Sag in a piire sine wave:
4e.
-
.O.Ol 011
04
0.45
0,s
lbl
I V0 F = = l
0.5;
06
0f6lyl
0.4
I
1473
Oil
0.4
0.4
0.S
0,SI
0.6
inaxirnuin value of llie sttl-MRA curve is decreased with an iunonnt relaled io Uic sag magnitude and duration its showi~io Fig. 7e. The lowcr left ol the std-MRA curve is also changed according IO the Iiigli frequency coiitcni ol Uie signal.
0.6Sk
ill
0.6
001
4.01 035
0.4
0.41
0.5
0,SJ
0.6
Swell in Larmonic distorted signal: The swcll is detected and localized iii Lhc lirst liner level, Fig. 8b. The amplitude o l the tlccolnposcd sigital is incrensctl during tlie swell intcrval cornpared wiUi its magnitude kl'ore llic swell, Fig. 8c. The maximum valuc ol thc std-MRA curve is increased with iiii aiiiouiit related tn the swcll megllitude and duration as sliowii io Fig. 8c. The Iowcr left of the SK-MRA curvc is also changed accordiiig to tllc Ilarmonic conlcnl o l t k signal.
0.6rixi0,q
II
".m 0,3S 0.4
0.45
0.1
0.55
0.6
0.651rl
0
0.11
04
0.4s
OS Id)
0.X
0.6
3
6
9
'Transient distortion in piire sine wave: 12k,1,
0.65lSl
(4
Fig. 4: detection, localization, and classilicatioii o l a sag in a pure sine wave.
This plieuornenoii is detcclctl and localiml at ;ill (lie lliree liner tlccoinposition levels, Figs. 9b, 9c, and 9d. Thc magnitude ol the cmlficient outside the lraiisient eveiil interval is alinosl equal lo zero Cor all llic filler Icvcls. The lowcr part 01' Ihc curve will bc changed accordiiig to rhe h;irmoiiic cotilciit or ilic Iransienl.
Swell in a pure sine wave:
Thc swell is detected ;uid localizctl in all the hier Llircc decoinposilioii levels, Figs. Sb, 5c, mid Stl. Siinilu to llie sag case, llic duriition 01 Ihe swell can k.easily nicasured. The maximum valuc of tlic std-MRA curve is iiicrcascd with an amount reliitul IO Llie swell riiagiiitiide m d durntiori as shown in Fig. Se. Harmonic distortion: Since Llie harmonic distortiou is stationary Il~creforc,Llicre is no lwalization property can bc dctccted at any of [lie finer levels, Figs. 6b, 6c, and 6d. The lower lelt and right pxls of Ihe std-MRA curve is clianged according to the 1i;irinotiic content of the signal. As sliowti in Fig. be, tlic lower Iclt part is changed accordiiig to the Iiigh frequciicy conkm of the distorted signal aiid the lowcr left par1 is changed according to [lie low frequency conleiit of the distorted signal coinpared with tlie power frequency (60 Hz). Sag in a liarmonic distorted signal:
on-
I
I
1
IVI ti,
I
I -
a.01
11.2-
0.35
0,4
0.41
0,s
0,SI
ti,6
0,651~1
0.31
0,4
0.41
0,s
0,SS
0,6
0,6S[sl
U (d)
The sag is detected aiid localized iit Uie first liner level, Fig. 7b. The number of dccoinpositioti levels can bc iiicrcascs OI detect these phenomena at otlier finer levels. The amplitude of tlie dccoinposed signal is reduccd during tlic sag interval coinpxcd with its magnitude bciore Uie sag, Fig. 7c. Tlic
,
3
6
9
12I*al,
(e)
Fig. 5: dctectioii, localization, and classilicalioii ola swell iii a pure sine wave.
1474
Id ; 0.5
$d.
0.8
0
4.5 I
0.15
0,4
0.45
0.5
0.55
0.6
0,651.1
Y.'
0,35 04
045
0.S
055
06
(Cl
0.651al
(4
(4
Fig. 6: detection, localization, aiid classiticatioii of harmonic distorted sigiial
!VI
1.5 I
0.5
0 4.5 -1;:
-
dd.
m
0.8
0.35
0.4
0.45
0.5
0.55
0.6
-
r
(Cl
Fig. 8: dctcctioii, Itxalizatioo, ant1 classilication o l a swell i n a liarinoiiic tlistortctl signal
-
0.65gl
0.15
IVI
0
0
0
-0.15
0.35
0.4 0,lS
0,s
0.55
06
0,61[r]
J
6
9
121.~d~
1
(4)
Fig. I: delcckion, localizalinii, aiid classificaiion ol'a sag in a harmonic distorted signal
Fig. 9: tlcicclioii, localizahm, aiid classi1ic;itioii llic prescnct: ol m i 1 l i i i e x loads lor shorI iiiti-rvals
1475
-
Using the proposed rules extracted from MRA tcchniquc :it V Cunclieiun liner levels and ~ h std-MRA c curve one can detect, localize, and classify different power quality problans. This is clear In conclusioii, the paper iiitrnduces the use of the wavelet from Fig. 10, whcrc tlic solid std-MRA curve is for a pure transform and inultiresolution signal decoinposition as a sine wave and the other curves ill'c for: powerful analysis tool. The property of multiresolution signal decomposition shows llic ability of the lechnique IO a- Voltage swell in Iiannonic distorted sigiial, dashed e x t ~ a c timportant information from the analyzed distorted curve iibovc the pure sine wave curve. signal. The main advantage of llie proposcd method comes from its ability to separate power quality probleins that b- Voltage sag in pure sine wave, dashed curve klow overlep in both tiine and frequency. Using ~ l i clocalizakioii the pure sine wave curve. property gained from the finer resolution lcvcls and tlic sttl-MRA curve, a time-Srcqucncy picture of the disturtcd c- Harmonic distorted signal, (lotted curve on Uic lowcr sigiiiil is constructed. Tlic valnc of l l i c std-MRA ciirvc is left and right parts of the pore sine wave curve. chaogcd with tiiuc to represeiit lhe cucrgy distribution of Ihc distortion at different frequency bands and at certaiii These classification roles a c so simple for llic opcrator to tiine. The proposcd std-MRA feature vector prcsciits a detecl, localize, and classily dilferear power quality simple classification roles for Ihc operator to detect, problems. The top part oi the std-MRA curve is it g o d localize, and classily dil'fcrcnl power quality problems. This feature to classify Uic sag, swell, and intcrruplioti lcaturc vector is partitioned into tlill'crciit Z O I I ~ Swhere cach phcnoinena. Tlic lower left part and llic lowcr riglit part oT zone c m k used Io inonitor and classify power qualily the std_MRA curve :we gmxl indicators lor a n y high or low pllcllonIena. Furthermore. Using thc sld-MRA wc ciiii tlistinguish among similar power quality problcins. 11 ciui frequency component ernbedded in tlic distorted signal. also help io liiitliiig the snurce of disturbancc
0.8
-
VI Kefere11ces
I
Sag and Swe I
0.6
I I1 I.l)ouglas, "Solving problems of
power qunlity", i n HPlll journal, vol. I X , nu. X, p p 6 - 1 5 Dec. 1993. 121 S. Sautoso, E.J Powers, W.M Grady, P. Hoftntinn '' Powcr qualily usscsaincol vi:i wavelet trnusform t~nalyais", IEEE tiou oil power ilclivcry Vol. I I, No2, Apr.1996. 131 W. Hdwurd Reid, '' Powcr Qu;ilily Issucs Stsuilerils iiiitl Guidelines", IHHH LraiisilcLiom 01, industry upplicalions. vol. 32, No.3, MaylSunc 1996, pp. 625632. 141 Kl'ilhy, A. Bhatlach;i+c "Appliwlioo oI' wavclets IO ~ n ~ x l c l shot1 Lerm puwcr systuii d i ~ t u r l i n i i ~ ~ItMt! s ' ~ . tr;msacLioii 01, powcr syslcma, Vol. I I , No.4, Nov. 1996. IS] S. Sanloso, E.J. Pnwcra, W.M. Grtidy "Powcr qut~lity dislurhance data coiiiprcssiuii using wavclet rrsnaiorin tncthods", lREh traiisiiclion 011 power ilcliveKy Vol. 12, No3, Sulv 1997, ~1%1250-1257. (61 G.T.Heydt, A.W.Galli "Transient Powcr Quality Problems Aualyzed Using Wavclcls", LEHE transactio11 oii power Delivcry, Vol. 12, No.2, April 1997. 171 Ilavid C, Robertson. Octaviii 1. Ciitnps, Jeffrey S. Maycr, atid William B. Oish. "Wavelets nnd Elcclroinngnclic Pvwcr System Tmnsients", IEEE Lmiisection oil poww Dclivery Vol. 11, No.2, April 1996, pp1050-1098. [ X I A. Gaoude, M. Salatna, A. Chikhani, ancl M. Sullan, "Applicariou of wavclcl analysis h r mnoitoring dytiainic performance in industrial planls" North American power symposium. Oct. 1997, Lxamie, Wyomitig. 191 John I