Precision Constant Current Source for Electrical Impedance Tomography. Jeong Whan Lee, Tong In Oh, Sang Min Paek, Jae Sang Lee, and Eung Je Woo.
Proceedings of the 25" Annual International Conference of the IEEE EMBS Cancun, Mexico * September 17-21,2003
Precision Constant Current Source for Electrical Impedance Tomography Jeong Whan Lee, Tong In Oh, Sang Min Paek, Jae Sang Lee, and Eung Je Woo College of Electronics and Information, Kyuny Hee University, Korea
Abstract- I n Electrical Impedance Tomography (EIT), we inject currents through electrodes placed on the surface of a subject and try to reconstruct cross-sectional resistivity images. This requires a precision constant current source. I n this paper, we present a design and performance analysis of a constant current sonrce using an FPGA-based waveform generator and improved Howland current pump circuit. The designed current source was implemented and tested to verify the total harmonic distortion of 0.0907% and amplitude stability of 0.2361%. The output impedance of the current source was bigger than 64 Mfl at de and smaller than 500 KR at 50 KHz. We need to further improve the output impedance at the frequency of 50 KHz or higher employing a better method of stray capacitance cancellation.
Keywords-
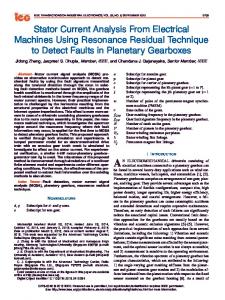
1 shows the block diagram of the proposed current source design.
TABLEI . conrtant Current
Bourcc
Feature
Specification -2.5 -+2.5 m b P
Amplitude ofcurrent
Frequency of Current
1 KHz - 1 MHz
Output impedance Calibration procedure
t 64 MC2 Automatic
Digital wavefom data
16-bit
EIT, current source, waveform generator
1. INTRODUCIION
In Electrical Impedance Tomography (EIT), we use one or multiple constant current sources to inject currents through electrodes placed on the surface of a subject, Measured boundary voltage data are used to reconstruct cross-sectional resistivity or conductivity images. In most EIT systems, the performance of the current source is one of the major limiting factors determining its accuracy. When multiple current sources are used, it is most important to accurately calibrate all of them so that the sum of all currents is always zero. This requires a very accurate control over amplitudes and phases of multiple current sources [ l , 21. In this paper, we propose using one current source with a switching circuit to minimize errors caused by multiple current sources. In order to reduce the data acquisition time, we suggest fast multi-channel voltmeters. The current source usually consists of a waveform generator and voltage-to-current converter. In this paper, we describe the design and implementation of the current source using a digital waveform generator and improved Howland current pump circuit with stray capacitance cancellation capability [3].
E+ L Fig.1. Block diagram ofthe current source
A. Digitd Waveform G,?nerntor
In order to obtain a very low total harmonic distortion (THD) and high stability, we designed a digital waveform generator using an FPCiA and DAC shown in Fig. 1. This also enables us to change the waveform and its frequency. In the design, we used the hardware description language (HDL) PI. waveform Address
Generator
11. METHODOLOGY
Decoder
Table 1 shows the desired specifications of the current source to be used in our EIT system. We determined the specifications to achieve the 16-bit accuracy at least within the current source. The output impedance of 64 Mi2 is needed assuming the maximal load impedance of 1 KR. Fig.
0-7803-7789-3/03/$17.00 a2003 IEEE
Waveform Data
e
1066
process
JDistance
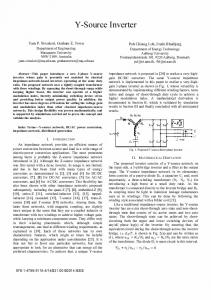
Fig. 2. Block diagram of HDL code in the FPGA
Fig. 2 shows the block diagram of the HDL code in the FPGA. Digitized samples of a waveform are stored in a ROM implemented within the FPGA. When it is enabled, the stored binary value of the waveform data is sequentially read and sent to a 16-bit DAC at 30 Msps. The current output of the DAC is then transformed to a voltage signal using an op amp circuit. In order to smooth the signal, we used a passive band-pass filter with zero degree phase shift at the frequency of the signal. We could change the frequency of the signal by an appropriate division of the 40 MHz main clock of the FPGA. For the synchronization with voltmeters using the phase-sensitive demodulation technique, the FPGA provides a timing pulse indicating the beginning of a new period of the signal. B. AmpIitude Control The amplitude of the signal needs to be changed so that we can adjust the amount of injection current. This can be done in two methods. First, the FPGA can scale the waveform data with a shifter. Second, we added a multiplying DAC (MDAC) to control the amplitude. When we use a MDAC, we should be careful about additional phase shift. Since we use one current source, this MDAC does not have to provide four-quadrant multiplications.
where V, is the voltage signal from the digital waveform generator, VL is the voltage across the load,
When R. is finite, the load current IL varies depending on the load since the voltage V, changes with the load. Since this could severely deteriorate the performance of the constant current source, we implemented a calibration circuit. D. Calibration Circuit
In order to maximize output impedance, we must first match the resistors in the improved Howland current pump circuit. Then, we should compensate the non-zero stray capacitance at the output of the current source. Therefore, we designed a calibration circuit using digitally programmable potentiometers (digi-pot). The output resistance is tuned to be a maximum using a digi-pot at the place of R3 in Fig. 3. The stray capacitance is eliminated with a negative capacitance circuit whose value is controlled by another digi-pot as shown in Fig. 4.
FPGA for Calibration
C. Voltage-to-Current Converter We used the improved Howland current pump circuit shown in Fig. 3 to convert the voltage signal into a current signal [2, 31. Assuming the perfect resistance matching condition among the resistors used in the circuit, the ideal output impedance is infinite. However, in practical implementation, the output impedance becomes finite due to errors in resistances. R3
Neg. cap.
R4
Fig. 4. Block diagram ofcalibration circuit
R26
111. RESULTS
A. Digital Waveform Generator R2A
m
* F i g 3 lmpmved Howland cumnt pump circuit
From the circuit shown in Fig. 3, the load current IL is given by (1).
Table 2 summarizes the performance of two waveform generators. The analog waveform generator was constructed based on the Wien-bridge oscillator circuit with an automatic gain control [3]. From Table 2, we can see that the digital waveform generator is about 5.2-13.7 times more stabile. In terms of THD, the digital waveform generator is also significantly better (about 54.5-87 times smaller).
1 1 I -4--\
L-R
4
1067
TABLE 2. Comparison of two waveform generators Waveform generator
-
.
FPlhlW
"
Digital (%j
, Analog(%)
Stabilhy THD'
0.84-2.2 1.5-2.4
. 0.1607 .
'
0:0275
.'
'
',Told Harmonic Distortion
I
"
"
"
L
'
.!I/ 0
, 10
,
,
I
,
,
m . . a
. .. .
.
,
,
,
, 40
Cmby,
54
. .
,
,
,
Ea
.
,'
.
.
.
B. Voltage-to-Current Converter ' . . , . . . , . : In.order.to ohtain'an output resistance of 64 MQ, we must match the resistors. in- Fig. 3 within 0.039%. Using a 10 KR digi-pot with 128 steps and a' 3 KR resistor in. parallel, we could actjust the resistance value with a resolution of 17.3 Q. Fig. 7(a) shows the change of the output resistance R, as a function of digi-pot steps. In theory;' we may get R, as high as 35 GQ. The measured value at dc . . , . was 3.3 GO. Fig. 7(b) shows 'the change, of the capacitance in the negative, capacitance ciicuit as a functiodof digi-pot steps. In'the current:design,'il,viyies in the range of 18.7 to 10 pF. Combining th!: effect of both Rq.and negative capacitance circuit, we found that the implemented. current source has an output impedance of 3.3 GQ at dc. However, it was less than 500 KR at 5 0 ' k z .
(4 ,
3.5
As described before, we can easily change the frequency and amplitude of the voltage. signal fiom the digital waveform generator. Throughout the frequency range of 1 KHz to 1 MHz, we found the similar performance as shown in Table 2. Fig. 5 shows typical voltage signals from the digital waveform generator. Fig. 6 shows the linearity of the amplitude as we controlled the amplitude.using the MDAC.
, 10
.
I
10
(b).
Fig. 5. (a) Sinusaldal and (b) rectangular waveform . ..
Fig. 6 Amplihlde linemiry ofthe variable mplihtde waveform generator Fig. 7. (a) Output mistance ofthe voltage-tomrent converter and @) negative capacitanci: of the negative capacitance circuit
1068
IV. DISCUSSION AND CONCLUSION
The performance of the constant current source is one of the major limiting factors determining the accuracy of an EIT system. Based on our speculation that using one current source may outperform a system using multiple current sources, we designed and implemented the constant current source including the FPGA-based waveform generator, voltage-to-current converter, and automatic calibration circuit. We found that the digital waveform generator must be used instead of the analog oscillator since it provides much better stability and low total harmonic distortion. It allows us to easily change the operating frequency and, therefore, is also a more effective solution for an EIT system using multiple frequencies. In order to maximize the output impedance of the current source, it is essential to use digi-pots or any similar means for fine tunings. We found that it is little more difficult to compensate the stray capacitance using a negative capacitance circuit rather than finding the matching condition of resistors. Without any proper compensation of the stray capacitance, we found that it is not possible to achieve an output impedance greater than 500 Kn at 50 KHz or higher. Considering the needs for multiple frequency operation up to around 1 MHz at least, an improved technique for the stray capacitance cancellation should be studies in our future works.
ACKNOWLEDGMENT
This work was supported by the grant Rll-2002-103 from Korea Science and Engineering Foundation. REFERENCES [I]R. D. Cook, G. 1. Saulnicr, D. G. Gisser, 1. C. Goble, 1. C.
Newell, and D.Isaacsan, "ACT3: a high-speed, high-precision electrical impedance tomography", IEEE Tmns. Biomed Eng., vol.41,no:8,pp.713-722, 1994. [21 A. S. Ross, G . J. Saulnier, I. C. Newell, and D. Isaacson, "Current source design for electrical impedance toimography," Physiol. Meas, vol. 24, pp. 509-516,2003. (31 S. Franco, Design wifh Operafional AmpIWiers and Analog IntegrafedCireuirs, 2"'ed., New York, McGmw-Hill, 1998. (41 D.I. Smith,HDL Chip Design, Doone Publications, 1996.
1069