Hindawi Publishing Corporation Mathematical Problems in Engineering Volume 2015, Article ID 974542, 7 pages http://dx.doi.org/10.1155/2015/974542
Research Article Priori Information Based Support Vector Regression and Its Applications Litao Ma and Jiqiang Chen School of Science, Hebei University of Engineering, Handan 056038, China Correspondence should be addressed to Jiqiang Chen;
[email protected] Received 20 April 2015; Accepted 25 August 2015 Academic Editor: George S. Dulikravich Copyright © 2015 L. Ma and J. Chen. This is an open access article distributed under the Creative Commons Attribution License, which permits unrestricted use, distribution, and reproduction in any medium, provided the original work is properly cited. In order to extract the priori information (PI) provided by real monitored values of peak particle velocity (PPV) and increase the prediction accuracy of PPV, PI based support vector regression (SVR) is established. Firstly, to extract the PI provided by monitored data from the aspect of mathematics, the probability density of PPV is estimated with 𝜀-SVR. Secondly, in order to make full use of the PI about fluctuation of PPV between the maximal value and the minimal value in a certain period of time, probability density estimated with 𝜀-SVR is incorporated into training data, and then the dimensionality of training data is increased. Thirdly, using the training data with a higher dimension, a method of predicting PPV called PI-𝜀-SVR is proposed. Finally, with the collected values of PPV induced by underwater blasting at Dajin Island in Taishan nuclear power station in China, contrastive experiments are made to show the effectiveness of the proposed method.
1. Introduction Underwater blasting is a kind of construction method often used in engineering, such as hydraulic engineering, port engineering, bridge-building, and dam excavation. In engineering practice, vibration velocity of peak particle is the main basis to measure the influence of seismic wave caused by blasting on nearby buildings. However, vibration velocity of peak particle is influenced by many factors, which leads to a relatively low prediction accuracy. Recently, Xie et al. [1] analyzed the characteristic parameters for blasting vibration with Sadovsky formula, and predicted PPV of blasting vibration. Yang et al. [2] predicted the PPV induced by underwater blasting at Dajin Island in the first phase of Taishan nuclear power station based on Sadovsky formula. However, Sadovsky formula [1, 2] relies on a large amount of monitored data and only considers two parameters in regression analysis, and then it cannot reflect the influence caused by many complex factors in underwater blasting. Thus, T. N. Singh and V. Singh [3] made an attempt to predict the ground vibration using an artificial neural network (ANN) incorporating large number of parameters. Khandelwal and Singh [4] proposed a method
to evaluate and predict the blast-induced ground vibration and frequency by incorporating rock properties, blast design, and explosive parameters using the ANN technique, and it was found that ANN was more accurate and able to predict the value of blast vibration without increasing error with the increasing number of inputs and nonlinearity among these. Furthermore, Liu et al. [5] introduced grey relational analysis to the prediction of PPV and proposed a genetic neural network model based on grey relational analysis. However, there are many complex factors influencing PPV and the data are high-dimensional data; ANNs [6– 8] have to face the problem of dimension disaster. And when the data are limited, ANNs are easy to fall into local minimum state. Thus, ANNs also cannot predict PPV accurately. Therefore, how to improve the prediction accuracy of PPV caused by underwater blasting vibration with the limited monitored data is still a problem worthy of study. Support vector machines (SVMs), including support vector classifications (SVCs) and support vector regressions (SVRs), were proposed by Vapnik et al. [9, 10] in the 1990s. SVMs focus on the statistical learning problems for small size samples by solving a convex quadratic optimization problem and can solve the local minimization problem which cannot
2 be avoided by ANNs. SVMs use a kernel function to map the data in original space to a high-dimensional feature space and then solve the nonlinear decision problem in high-dimensional space. Thus, SVMs can successfully solve the problem of dimension disaster that an ANN cannot solve and have good generalization ability. However, standard SVMs focus on monitored data and cannot incorporate prior information into learning process, which may cause the generalization ability of standard SVMs to decrease. Therefore, Guan et al. [11] proposed a modified method that incorporated prior information into cancer classification based on gene expression data to improve accuracy. Zhang et al. [12] proposed a fully Bayesian methodology for generalized kernel mixed models, which are extensions of generalized linear mixed models in the feature space induced by a reproducing kernel. Liu and Xue [13] focused on designing a new class of kernels to incorporate fuzzy prior information into the training process of SVRs. Currently, SVMs have received extensive attention and are attracting more and more scholars to study from different views [14– 29]. However, for the problem of PPV prediction in practice, the unknown probability density of PPV provides much PI about PPV. If we can propose a method to estimate the probability density with monitored data and incorporate it into PPV prediction, the prediction accuracy may be greatly improved. In practice, the measured PPV V at a fixed time 𝑡 is the mean value V = (1/𝑙) ∑𝑙𝑘=0 V𝑘 of many monitored values V𝑘 (𝑘 = 0, 1, . . . , 𝑙) during certain period of time Δ𝑡. Assume that Vmax = max𝑘 {V𝑘 } and Vmin = min𝑘 {V𝑘 }, and then the larger Vmax − Vmin is the larger fluctuation of PPV during the period of time Δ𝑡. Conversely, the smaller Vmax − Vmin is the smaller fluctuation of PPV. Nevertheless, the mean value V cannot provide the fluctuation information of PPV at all. Therefore, in order to increase the accuracy of PPV prediction, it is necessary to find a way to incorporate this PI about fluctuation into PPV prediction. Therefore, in order to increase the prediction accuracy of PPV, this paper focuses on proposing a new method of PPV prediction incorporating with PI. This paper is structured as follows. Section 2 aims to estimate probability density of PPV with monitored data and 𝜀-SVR, incorporate PI about the fluctuation of PPV into training data, and then establish prediction method for PPV based on priori information and 𝜀-support vector regression (PI-𝜀-SVR). Section 3 includes the contrastive experiments with real monitored data of PPV coming from Dajin Island in Taishan nuclear power station. Section 4 draws the conclusions and future directions.
2. Prediction Method of PPV Based on PI and SVR In order to dredge much information from monitored data of PPV, here, based on the 𝜀-SVR, we estimate the probability ̂ of PPV with monitored data firstly. Then, we aim density 𝑓(𝑥) to establish a prediction method of PPV based on PI and 𝜀SVR.
Mathematical Problems in Engineering 2.1. Increasing the Dimensionality of Training Data with PI ̂ is the probabilabout Fluctuation of PPV. Suppose that 𝑓(𝑥) ity density estimated with the 𝜀-SVR and 𝑡0 is the initial time and V0 is the PPV at 𝑡0 (also denoted by (𝑡0 , V0 )). In practice, PPV is often monitored many times 𝑡0𝑘 (𝑘 = 1, 2, . . . , 𝑙) for every certain period of time Δ𝑡 (where 𝑡0 < 𝑡01 < ⋅ ⋅ ⋅ < 𝑡0𝑙 ≤ 𝑡0 + Δ𝑡), and mean value V = (1/𝑙) ∑𝑙𝑘=1 V0𝑘 is output as the predicted PPV. In other words, PPV V1 at 𝑡1 = 𝑡0 + Δ𝑡 is the mean value V of monitored values V0𝑘 from 𝑡0 to 𝑡1 (also denoted by (𝑡1 , V1 )), and V1 = V. Of course, mean value V can be the approximation of PPV V1 at 𝑡1 in a sense, but in some cases mean value V is quite different from V1 . For example, if monitored PPVs V0𝑘 (𝑘 = 1, 2, . . . , 𝑙) are with the same value during a certain period of time Δ𝑡, then the fact that “the mean value V is the PPV V1 ” holds with probability 1. Conversely, if the monitored PPVs V0𝑘 (𝑘 = 1, 2, . . . , 𝑙) fluctuate wildly during a certain period of time Δ𝑡, then the fact that “the mean value V is the PPV V1 ” holds with a very low probability. Hence, in order to incorporate this PI into the prediction of PPV, the training datum (𝑡1 , V1 ) is converted into (𝑡1 , 1 − 𝑃1 , V1 ), where 𝑃1 = 𝑃 {Vmin ≤ V1 ≤ Vmax } = ∫
Vmax
Vmin
𝑓̂ (𝑥) d𝑥,
(1)
Vmin = min {V0𝑘 } , 𝑘
Vmax = max {V0𝑘 } .
(2)
𝑘
Remark 1. In fact, from (1) and (2) we can find that the larger Vmax − Vmin is, the smaller 1 − 𝑃1 becomes. That is to say, the possibility that “PPV at 𝑡1 is V1 ” is very small. On the other hand, the large Vmax − Vmin illustrates that PPVs from 𝑡0 to 𝑡1 fluctuate wildly and that “mean value V is PPV V1 ” holds with a low probability (namely, the possibility that “PPV at 𝑡1 is V1 ” is very low), which is in accordance with the information provided by 1 − 𝑃1 . Thus, 1 − 𝑃1 provides PI about the fluctuation of PPV during a certain period of time Δ𝑡. Therefore, training datum (𝑡1 , V1 ) is converted into (𝑡1 , 1 − 𝑃1 , V1 ) which contains PI provided by monitored data. Then, the problem of predicting PPV is as follows. 2.1.1. Problem of PPV Prediction. Let 𝑡𝑖 (𝑖 = 1, 2, . . . , 𝑙) be the 𝑙 times 𝑇 = {(𝑡1 , 1 − 𝑃1 , V1 ) , (𝑡2 , 1 − 𝑃2 , V2 ) , . . . , (𝑡𝑙 , 1 − 𝑃𝑙 , V𝑙 )} (3)
and let it be a training set. Denote x𝑖 = (𝑡𝑖 , 1 − 𝑃𝑖 ). Then, training set (3) can be rewritten by 𝑇 = {(x1 , V1 ) , (x2 , V2 ) , . . . , (x𝑙 , V𝑙 )} ,
(4)
where x𝑖 ∈ 𝑅 × [0, 1], V𝑖 ∈ [0, +∞), 𝑖 = 1, 2, . . . , 𝑙. The problem of PPV prediction is to find a real valued function V = 𝑔(x) on 𝑅 × [0, 1] according to training set (4) to predict the PPV V for any given input x. In the next subsection, a method of predicting the PPVs from the aspect of mathematics is established.
Mathematical Problems in Engineering
3
2.2. Method of Predicting PPV Based on PI and Epsilon-SVR. In order to solve the above problem of predicting PPV, based on the standard SVR, PI-𝜀-SVR is constructed as follows.
𝑇 = {(x1 , V1 ) , (x2 , V2 ) , . . . , (x𝑙 , V𝑙 )} ,
(5)
Step 2. Select a proper kernel function 𝐾(x, x ), 𝜀 > 0, and punishment parameter 𝐶 > 0. Step 3. Construct and solve the convex quadratic programming problem: 𝑙
1 ∑ (𝛼∗ − 𝛼𝑖 ) (𝛼𝑗∗ − 𝛼𝑗 ) 𝐾 (x𝑖 , x𝑗 ) 2 𝑖,𝑗=1 𝑖 𝑙
𝑙
𝑖=1
𝑖=1
+ 𝜀∑ (𝛼𝑖∗ + 𝛼𝑖 ) − ∑V𝑖 (𝛼𝑖∗ − 𝛼𝑖 ) ,
(6)
𝑙
𝑖=1
𝑖 = 1, . . . , 𝑙.
We can obtain an optimal solution 𝑇
a(∗) = (𝛼1 , 𝛼∗1 , . . . , 𝛼𝑙 , 𝛼∗𝑙 ) .
(7)
Step 4. Choose component 𝛼𝑗 or 𝛼∗𝑘 of vector a(∗) in interval (0, 𝐶). If 𝛼𝑗 is chosen, then 𝑙
𝑏 = V𝑖 − ∑ (𝛼∗𝑖 − 𝛼𝑖 ) 𝐾 (x𝑖 , x𝑗 ) + 𝜀.
(8)
𝑖=1
If 𝛼∗𝑘 is chosen, then 𝑙
𝑏 = V𝑘 − ∑ (𝛼∗𝑖 − 𝛼𝑖 ) 𝐾 (x𝑖 , x𝑘 ) − 𝜀.
(9)
𝑖=1
Step 5. Construct the decision function with 𝑏
0.1 0.05 0
0
2
4
6
8
10
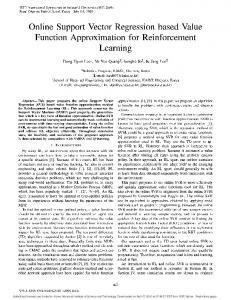
contains much information about PPV and probability (1) provides the PI about fluctuation of PPV during a certain period of time, then they are incorporated into training data in Section 3.2. Section 3.3 is the experiments predicting the PPVs for a given point with standard 𝜀-SVR and the proposed PI-𝜀-SVR, respectively, and the result analyses are shown in Section 3.4. 3.1. Estimating Probability Density of PPV with Monitored Data. Suppose that (𝑡𝑖 , V𝑖 ) (𝑖 = 1, 2, . . . , 80) indicate PPV V𝑖 at time 𝑡𝑖 . PPV was monitored ten times V(𝑡𝑖𝑘 ) (𝑘 = 1, 2, . . . , 10) during every ten minutes, and mean value V𝑖 = (1/10) ∑10 𝑘=1 V(𝑡𝑖𝑘 ) was output as the PPV V𝑖+1 at time 𝑡𝑖 + 1/6. ̂ According to 𝜀-SVR, estimated probability density 𝑓(𝑥) of PPV can be obtained and shown in Figure 1. As the probability density 𝑓(𝑥) provides much PI about PPV, we incorporate it in the training data in the next subsection. 3.2. Increasing the Dimensionality of Training Data with PI about Fluctuation of PPV. Set V𝑖max = max𝑘 {V(𝑡𝑖𝑘 )} and V𝑖min = ̂ and min𝑘 {V(𝑡𝑖𝑘 )}. By the estimated probability density 𝑓(𝑥) (1), probability 𝑃𝑖 = 𝑃{V𝑖min ≤ V𝑖 ≤ V𝑖max } can be calculated. Then, according to training set (4), monitored data (𝑡1 , V1 ) , (𝑡2 , V2 ) , . . . , (𝑡80 , V80 )
𝑙
V = 𝑔 (x) = ∑ (𝛼∗𝑖 − 𝛼𝑖 ) 𝐾 (x𝑖 , x) + 𝑏.
0.15
Figure 1: Estimated probability density of PPV with monitored data.
s. t. ∑ (𝛼𝑖 − 𝛼𝑖∗ ) = 0, 0 ≤ 𝛼𝑖(∗) ≤ 𝐶,
0.25 0.2
where x𝑖 ∈ 𝑅 × [0, 1], V𝑖 ∈ [0, +∞), 𝑖 = 1, 2, . . . , 𝑙.
min
0.35 0.3
Step 1. Obtain the training set
a(∗) ∈𝑅2𝑙
0.4
(10)
𝑖=1
3. Contrastive Experiments In order to predict the PPV V(𝑡) (cm/s) at 𝑡 (minutes), we recorded the values of PPV induced by underwater blasting for 100 times with IDTS-3850 blast vibration recorder at Dajin Island in Taishan nuclear power station in China and collected 100 monitored datasets (or samples). Then, by the 𝜀-SVR, the probability density 𝑓(𝑥) of PPV is estimated with the former 80 samples (the latter 20 samples are used for prediction) in Section 3.1. As the probability density 𝑓(𝑥)
(11)
are converted into (x1 , V1 ) , (x2 , V2 ) , . . . , (x80 , V80 ) ,
(12)
where x𝑖 = (𝑡𝑖 , 1 − 𝑃𝑖 ) (𝑖 = 1, . . . , 80). And data (12) are used to establish a model to predict PPV V81 for the given x81 . Similarly, if we want to predict PPV V82 for the given x82 , we can estimate the probability density of PPV with monitored data (𝑡𝑖 , V𝑖 ) (𝑖 = 2, 3, . . . , 81) and use data (x𝑖 , V𝑖 ) (𝑖 = 2, 3, . . . , 81) as training data. 3.3. Method of Predicting PPV Based on PI and Epsilon-SVR. In order to predict PPV V81 for the given x81 with training data
4
Mathematical Problems in Engineering Table 1: Experiment results with PI-𝜀-SVR and standard 𝜀-SVR. Numbers Training data Testing data 80 1 80 1
Methods PI-𝜀-SVR Standard 𝜀-SVR
𝜀 0.01 0.01
Parameters 𝜎 2 2
9
9
8
8
7
Mean squared errors Training data Testing data 0.0064 0.0438 0.0241 0.0648
𝐶 4 1
7
6 6
5 4
5
3
4
2 1
3 0
10
20
30
40
50
60
70
80
The monitored PPV The predicted PPV
Figure 2: The blue curve — is obtained with the 80 monitored PPVs of training data; the red curve --- is obtained with the predicted PPVs of training data with PI-𝜀-SVR.
(12), we make experiments with PI-𝜀-SVR and standard 𝜀SVR, respectively. Here, a grid search method based on 5-fold cross-validation is chosen to determine model parameters, 𝜎 ∈ {2−10 , 2−9 , . . . , 21 }, 𝐶 ∈ {2−6 , 2−5 , . . . , 26 }, and kernel function is a radial basis function (RBF). The experiment results are shown in Table 1. Predicted PPVs of training data with PI-𝜀-SVR and standard 𝜀-SVR are shown in Figures 2 and 3, respectively. Predicted PPVs of testing data with the two methods are shown in Figures 4 and 5, respectively. Similar to the steps of predicting PPV V81 for the given x81 , we make the experiment 20 times to predict the PPV V𝑗 for the given x𝑗 (𝑗 = 81, 82, . . . , 100) (namely, the latter 20 monitored datasets); the monitored values and predicted values are shown in Table 2, and the average mean squared errors are shown in Table 3 (the numbers after ± are the standard deviations). 3.4. Results Analysis. In the experiments, the optimal parameters are chosen via a grid search method based on 5fold cross-validation. From Table 1, we find that when the numbers of training datasets with PI-𝜀-SVR and standard 𝜀SVR are the same, mean squared error of training data with PI-𝜀-SVR is 0.0064, which is smaller than the corresponding one (0.0241) with standard 𝜀-SVR. It illustrates that PI-𝜀-SVR is more accurate than standard 𝜀-SVR in predicting PPV V81 . Figures 2 and 3 show the predicted PPVs of the 80 training datasets (x𝑖 , V𝑖 ) (𝑖 = 1, 2, . . . , 80) with PI-𝜀-SVR and standard 𝜀-SVR, respectively, and comparing the two figures we can find that the predicted PPVs with PI-𝜀-SVR are closer to
2 1
0
10
20
30
40
50
60
70
80
The monitored PPV The predicted PPV
Figure 3: The blue curve — is obtained with the 80 monitored PPVs of training datasets; the red curve --- is obtained with the predicted PPVs of training data with standard 𝜀-SVR. 5.5 5.4 5.3 5.2 5.1 5 4.9 4.8 4.7
0
0.5
1
1.5
2
The monitored PPV The predicted PPV
Figure 4: The blue star ∗ is the monitored PPV V81 ; the red five-point star f is the predicted PPV ̂V81 with PI-𝜀-SVR.
the monitored PPVs than those with standard 𝜀-SVR, which shows that the proposed PI-𝜀-SVR method is more accurate than standard 𝜀-SVR in predicting PPVs of the training data. In Figures 4 and 5, we can find that the monitored PPV V81 is 5.49 (cm/s), and the predicted PPVs ̂V81 with PI-𝜀-SVR and
Mathematical Problems in Engineering
5
Table 2: Results comparisons between PI-𝜀-SVR and standard 𝜀-SVR. Sequence number 81 82 83 84 85 86 87 88 89 90 91 92 93 94 95 96 97 98 99 100
Monitored values (cm s−1 ) 5.492 5.703 5.497 5.497 5.503 5.346 6.012 5.796 5.604 5.696 5.505 5.795 6.108 6.09 6.475 6.001 5.709 5.603 5.697 5.681
Predicted values (cm s−1 ) PI-𝜀-SVR Standard 𝜀-SVR 4.727992 4.561995 4.999514 4.828406 5.173634 5.067231 5.533654 5.459629 5.587041 4.993618 5.469962 5.398322 5.117022 5.30163 5.527526 5.825701 5.79634 5.796495 5.629545 5.264269 5.722185 5.738134 5.579158 5.751096 5.706398 5.73016 5.766335 5.565613 5.766205 5.705777 5.888971 6.151848 5.966036 6.079666 5.821612 5.661883 5.659645 5.377922 5.609744 5.550937
Table 3: Average mean squared errors.
5.5
Methods Experiment times Average mean squared error PI-𝜀-SVR 20 0.0117 ± 0.0177 Standard 𝜀-SVR 20 0.0156 ± 0.0199
5.4
Mean squared errors PI-𝜀-SVR Standard 𝜀-SVR 0.043754 0.064832 0.037096 0.057337 0.007838 0.013845 0.000101 0.000105 0.000529 0.019449 0.001152 0.000205 0.060040 0.037826 0.005403 0.000066 0.002773 0.002778 0.000331 0.013972 0.003536 0.004074 0.003492 0.000144 0.012090 0.010701 0.007853 0.020612 0.037658 0.044353 0.000941 0.001706 0.004952 0.010299 0.003582 0.000260 0.000105 0.007632 0.000381 0.001268
5.3 5.2 5.1
standard 𝜀-SVR are 4.73 (cm/s) and 4.56 (cm/s), respectively. That is to say, the predicted PPV ̂V81 with PI-𝜀-SVR is closer to the monitored PPV V81 than that with standard 𝜀-SVR. Table 1 (the last column) shows that the mean squared errors of testing data with the two methods are 0.0438 and 0.0648, respectively. These illustrate that the proposed PI-𝜀SVR method is more accurate and effective than the standard 𝜀-SVR in predicting PPV V81 for the given x81 . In order to reduce the influence caused by randomness, we made the experiment 20 times to predict the PPV V𝑗 for the given x𝑗 (𝑗 = 81, 82, . . . , 100) (namely, the latter 20 monitored datasets); the real monitored values and predicted values are shown in Table 2 and the average mean squared errors and standard deviations are shown in Table 3. From Table 2, we can see that most of the 20 predicted PPVs (numbers in the third column) ̂V𝑗 (𝑗 = 81, 82, . . . , 100) with PI-𝜀-SVR are closer to the monitored PPVs (numbers in the second column) than those (numbers in the fourth column) obtained with standard 𝜀-SVR, showing that the proposed PI-𝜀-SVR method is more accurate than the standard 𝜀-SVR in predicting the latter 20 PPVs. And also, we find that most of the 20 mean squared values (numbers in the fifth column) obtained with PI-𝜀-SVR are smaller than the corresponding ones (numbers in the last column) with
5 4.9 4.8 4.7 4.6 4.5
0
0.5
1
1.5
2
The monitored PPV The predicted PPV
Figure 5: Blue star ∗ is the real monitored PPV V81 ; red five-point star f is the predicted PPV ̂V81 with standard 𝜀-SVR.
standard 𝜀-SVR, showing that the PI-𝜀-SVR method is more stable than the standard 𝜀-SVR. From Table 3, we find that the average mean squared error obtained with PI-𝜀-SVR is 0.0117 which is smaller than that (0.0156) obtained with standard 𝜀-SVR. This illustrates that PI-𝜀-SVR method is more stable than standard 𝜀SVR method in predicting the latter 20 PPVs V𝑗 (𝑗 = 81, 82, . . . , 100). And also, the running time of PI-𝜀-SVR is
6 less than one minute, which shows that the model’s running time can meet the needs of PPV prediction in application. Through the experiments, we can find that the PPV prediction method incorporating priori information can achieve both high prediction accuracy and good stability compared to the prediction method without priori information. That is to say, incorporating PI into the prediction of PPV may be a good way of increasing the prediction accuracy.
4. Conclusions and Future Directions In this paper, a method of estimating probability density of PPV with real monitored data is proposed, and we find the estimated probability density providing the PI about fluctuation of PPV between the maximal value and the minimal value in a certain period of time. Then, the PI provided by estimated probability density is incorporated into training data. After that, PI-𝜀-SVR method for predicting PPV is proposed. In Table 2, experiment results, including 20 predicted values and 20 mean squared errors, show that the proposed PI-𝜀-SVR is more accurate in the prediction of PPV than the standard 𝜀-SVR. In Table 3, the average mean squared errors of PI-𝜀-SVR and standard 𝜀-SVR are 0.0117 and 0.0156, respectively, and average variances are 0.0177 and 0.0199, respectively, which show that the PI-𝜀-SVR is more stable than the standard 𝜀-SVR. Therefore, incorporating PI into the prediction of PPV may be a good way of increasing the prediction accuracy. And also some other factors, such as water pressure, blast design, geotechnical properties, and explosive parameters, are also impacting the prediction of PPVs. If the PI about these factors can be incorporated into the prediction of PPVs, the prediction accuracy may be further improved. Therefore, establishing a method including PI from the aspects of both monitored data and engineering practice is one of our research directions in the future.
Conflict of Interests
Mathematical Problems in Engineering
[2]
[3]
[4]
[5]
[6]
[7]
[8]
[9]
[10]
[11]
The authors declare that there is no conflict of interests regarding the publication of this paper.
Acknowledgments This work is supported by National Natural Science Foundation of China (61073121), Application Basic Research Plan Key Basic Research Project of Hebei Province (15967663D), Natural Science Foundation of Hebei Province of China (F2015402033), Natural Science Foundation of Hebei Education Department (QN2015116). Jiqiang Chen is also supported by the Youth Academic Backbone Project of Hebei University of Engineering. The authors also thank the anonymous reviewers for their constructive comments and suggestions.
[12]
[13]
[14]
[15]
References [1] B. Xie, H. Li, Y. Liu, X. Xia, and C. Yu, “Study of safety control of foundation pit excavation by blasting in Ningde nuclear power
[16]
plant,” Chinese Journal of Rock Mechanics and Engineering, vol. 28, no. 8, pp. 1571–1578, 2009. F.-W. Yang, H.-B. Li, Y.-Q. Liu, F. Zou, X. Xia, and Y.-F. Hao, “Comparative study on vibration characteristics of rock mass induced by bench blasting and pre-splitting blasting,” Journal of the China Coal Society, vol. 37, no. 8, pp. 1285–1291, 2012. T. N. Singh and V. Singh, “An intelligent approach to prediction and control ground vibration in mines,” Geotechnical & Geological Engineering, vol. 23, no. 3, pp. 249–262, 2005. M. Khandelwal and T. N. Singh, “Prediction of blast-induced ground vibration using artificial neural network,” International Journal of Rock Mechanics and Mining Sciences, vol. 46, no. 7, pp. 1214–1222, 2009. Y.-Q. Liu, H.-B. Li, Q.-T. Pei, and W. Zhang, “Prediction of peak particle velocity induced by underwater blasting based on the combination of grey relational analysis and genetic neural network,” Rock and Soil Mechanics, vol. 34, no. 1, pp. 259–264, 2013. T. N. Singh, R. Kanchan, A. K. Verma, and K. Saigal, “A comparative study of ANN and Neuro-fuzzy for the prediction of dynamic constant of rockmass,” Journal of Earth System Science, vol. 114, no. 1, pp. 75–86, 2005. R. Singh, V. Vishal, and T. N. Singh, “Soft computing method for assessment of compressional wave velocity,” Scientia Iranica, vol. 19, no. 4, pp. 1018–1024, 2012. R. Singh, V. Vishal, T. N. Singh, and P. G. Ranjith, “A comparative study of generalized regression neural network approach and adaptive neuro-fuzzy inference systems for prediction of unconfined compressive strength of rocks,” Neural Computing and Applications, vol. 23, no. 2, pp. 499–506, 2013. H. Drucker, C. J. C. Burges, A. S. L. Kaufman, A. Smola, and V. Vapnik, “Support vector regression machines,” in Proceedings of the Advances in Neural Information Processing Systems (NIPS ’97), vol. 9, pp. 155–161, May 1997. V. Vapnik, S. E. Golowich, and A. Smola, “Support vector method for function approximation, regression estimation, and signal processing,” in Proceedings of the 10th Annual Conference on Neural Information Processing Systems (NIPS ’96), vol. 9, pp. 281–287, December 1997. P. Guan, D. Huang, M. He, and B. Zhou, “Lung cancer gene expression database analysis incorporating prior knowledge with support vector machine-based classification method,” Journal of Experimental and Clinical Cancer Research, vol. 28, article 103, 2009. Z. Zhang, G. Dai, and M. I. Jordan, “Bayesian generalized kernel mixed models,” Journal of Machine Learning Research, vol. 12, pp. 111–139, 2011. F. Q. Liu and X. P. Xue, “Design of natural classification kernels using prior knowledge,” IEEE Transactions on Fuzzy Systems, vol. 20, no. 1, pp. 135–152, 2012. W. Astuti, R. Akmeliawati, W. Sediono, and M. J. E. Salami, “Hybrid technique using singular value decomposition (SVD) and support vector machine (SVM) approach for earthquake prediction,” IEEE Journal of Selected Topics in Applied Earth Observations and Remote Sensing, vol. 7, no. 5, pp. 1719–1728, 2014. O. Chapelle, V. Sindhwani, and S. S. Keerthi, “Optimization techniques for semi-supervised support vector machines,” Journal of Machine Learning Research, vol. 9, pp. 203–233, 2008. J. Q. Chen, W. Pedrycz, M. H. Ha, and L. T. Ma, “Set-valued samples based support vector regression and its applications,”
Mathematical Problems in Engineering
[17]
[18]
[19]
[20]
[21]
[22]
[23]
[24]
[25]
[26]
[27]
[28]
[29]
Expert Systems with Applications, vol. 42, no. 5, pp. 2502–2509, 2015. M. G. De Giorgi, S. Campilongo, A. Ficarella, and P. M. Congedo, “Comparison between wind power prediction models based on wavelet decomposition with least-squares support vector machine (LS-SVM) and artificial neural network (ANN),” Energies, vol. 7, no. 8, pp. 5251–5272, 2014. M. H. Ha, C. Wang, Z. M. Zhang, and D. Z. Tian, Uncertainty Statistical Learning Theory, Science Press, Beijing, China, 1st edition, 2010. M. Hajian, A. A. Foroud, and A. A. Abdoos, “Power transformer protection scheme based on MRA-SSVM,” Journal of Intelligent & Fuzzy Systems, vol. 27, no. 4, pp. 1659–1669, 2014. M. Karasuyama and I. Takeuchi, “Multiple incremental decremental learning of support vector machines,” IEEE Transactions on Neural Networks, vol. 21, no. 7, pp. 1048–1059, 2010. A. Kavousi-Fard, H. Samet, and F. Marzbani, “A new hybrid modified firefly algorithm and support vector regression model for accurate short term load forecasting,” Expert Systems with Applications, vol. 41, no. 13, pp. 6047–6056, 2014. R. V. Maheswari, P. Subburaj, B. Vigneshwaran, and L. Kalaivani, “Non linear support vector machine based partial discharge patterns recognition using fractal features,” Journal of Intelligent and Fuzzy Systems, vol. 27, no. 5, pp. 2649–2664, 2014. M. Narwaria and W. Lin, “Objective image quality assessment based on support vector regression,” IEEE Transactions on Neural Networks, vol. 21, no. 3, pp. 515–519, 2010. C. Orsenigo and C. Vercellis, “Regularization through fuzzy discrete SVM with applications to customer ranking,” Journal of Intelligent and Fuzzy Systems, vol. 23, no. 4, pp. 101–110, 2012. ˜ M. P´erez-Bellido, J. E. G. Ortiz-Garc´ıa, S. Salcedo-Sanz, A. Gasc˜on-Moreno, J. A. Portilla-Figueras, and L. Prieto, “Shortterm wind speed prediction in wind farms based on banks of support vector machines,” Wind Energy, vol. 14, no. 2, pp. 193– 207, 2011. R. Sałat and S. Osowski, “Support vector machine for soft fault location in electrical circuits,” Journal of Intelligent and Fuzzy Systems, vol. 22, no. 1, pp. 21–31, 2011. V. Srinivasan, G. Rajenderan, J. V. Kuzhali, and M. Aruna, “Fuzzy fast classification algorithm with hybrid of ID3 and SVM,” Journal of Intelligent & Fuzzy Systems, vol. 24, no. 3, pp. 555–561, 2013. C. Suryanarayana, C. Sudheer, V. Mahammood, and B. K. Panigrahi, “An integrated wavelet-support vector machine for groundwater level prediction in Visakhapatnam, India,” Neurocomputing, vol. 145, pp. 324–335, 2014. J. Y. Zhou, J. Shi, and G. Li, “Fine tuning support vector machines for short-term wind speed forecasting,” Energy Conversion and Management, vol. 52, no. 4, pp. 1990–1998, 2011.
7
Advances in
Operations Research Hindawi Publishing Corporation http://www.hindawi.com
Volume 2014
Advances in
Decision Sciences Hindawi Publishing Corporation http://www.hindawi.com
Volume 2014
Journal of
Applied Mathematics
Algebra
Hindawi Publishing Corporation http://www.hindawi.com
Hindawi Publishing Corporation http://www.hindawi.com
Volume 2014
Journal of
Probability and Statistics Volume 2014
The Scientific World Journal Hindawi Publishing Corporation http://www.hindawi.com
Hindawi Publishing Corporation http://www.hindawi.com
Volume 2014
International Journal of
Differential Equations Hindawi Publishing Corporation http://www.hindawi.com
Volume 2014
Volume 2014
Submit your manuscripts at http://www.hindawi.com International Journal of
Advances in
Combinatorics Hindawi Publishing Corporation http://www.hindawi.com
Mathematical Physics Hindawi Publishing Corporation http://www.hindawi.com
Volume 2014
Journal of
Complex Analysis Hindawi Publishing Corporation http://www.hindawi.com
Volume 2014
International Journal of Mathematics and Mathematical Sciences
Mathematical Problems in Engineering
Journal of
Mathematics Hindawi Publishing Corporation http://www.hindawi.com
Volume 2014
Hindawi Publishing Corporation http://www.hindawi.com
Volume 2014
Volume 2014
Hindawi Publishing Corporation http://www.hindawi.com
Volume 2014
Discrete Mathematics
Journal of
Volume 2014
Hindawi Publishing Corporation http://www.hindawi.com
Discrete Dynamics in Nature and Society
Journal of
Function Spaces Hindawi Publishing Corporation http://www.hindawi.com
Abstract and Applied Analysis
Volume 2014
Hindawi Publishing Corporation http://www.hindawi.com
Volume 2014
Hindawi Publishing Corporation http://www.hindawi.com
Volume 2014
International Journal of
Journal of
Stochastic Analysis
Optimization
Hindawi Publishing Corporation http://www.hindawi.com
Hindawi Publishing Corporation http://www.hindawi.com
Volume 2014
Volume 2014