â«This can be done with empirical risk minimization or structural risk minimization. â«Neural networks are based on empirical risk minimization. â«SVM are based ...
TORNADO DETECTION WITH SUPPORT VECTOR MACHINES Theodore B. Trafalis*, Huseyin Ince*, and Michael B. Richman** School of Industrial Engineering*, School of Meteorology** University of Oklahoma www.lois.ou.edu ICCS, June 2-4, Melbourne, Victoria, Australia
1
Outline
Introduction Mesocyclone Detection Algorithm (MDA) Support Vector Machines (SVM) Experiments Conclusion
2
Introduction
National Weather Service (NWS) Severe Weather Detection Algorithms Empirical rule based algorithms MDA algorithm Data mining techniques applied to MDA algorithms Support vector machines Neural networks
3
How do we begin?
Data! Radar data provide the best observational tool for gathering weather information Weather Surveillance Radar – 1988 Doppler (WSR-88D) NWS, Sterling VA
4
Radar scans the atmosphere
5
Formation of a tornado
6
Supercell (courtesy of the National Weather Service )
7
MDA Algorithm
The current Mesocyclone Detection Algorithm (MDA) was created at the National Severe Storms Laboratory (NSSL) to work with variables derived from the WSR-88D. In order to detect circulations associated with vortices that eventually spin up into tornadoes, the radar velocity data are exploited. The data are measured for circulation depth, height above the ground and strength of the circulation. By relaxing previous threshold values, the MDA is capable of detecting weaker circulations that may eventually spin up into tornadoes. 8
MDA continued
The downside is that a number of these weak circulations do not progress into rotating thunderstorms that yielded tornadoes.
Information we get from radar data
Reflectivity (Z): ratio of the radiant energy reflected by a given surface to the total incident energy Velocity (V): velocity of target Spectrum Width (W): measure of dispersion of velocities within the radar sample
9
MDA Attributes
1. base (m) [0-12000] 2. depth (m) [0-13000] 3. strength rank [0-25] 4. low-level diameter (m) [0-15000] 5. maximum diameter (m) [0-15000] 6. height of maximum diameter (m) [012000] 7. low-level rotational velocity (m/s) [0-65] 8. maximum rotational velocity (m/s) [0-65] 9. height of maximum rotational velocity (m) [0-12000] 10. low-level shear (m/s/km) [0-175] 11. maximum shear (m/s/km) [0-175] 12. height of maximum shear (m) [012000]
13. low-level gate-to-gate velocity difference (m/s) [0-130] 14. maximum gate-to-gate velocity difference (m/s) [0-130] 15. height of maximum gate-to-gate velocity difference (m) [0-12000] 16. core base (m) [0-12000] 17. core depth (m) [0-9000] 18. age (min) [0-200] 19. strength index (MSI) wghtd by avg density of integrated layer [0-13000] 20. strength index (MSIr) "rank" [0-25] 21. relative depth (%) [0-100] 22. low-level convergence (m/s) [0-70] 23. mid-level convergence (m/s) [0-70]
10
Support Vector Machines(SVM)
SVM is based on statistical learning theory
Find an optimal hyperplane that separates two classes (classification problem)
This can be done with empirical risk minimization or structural risk minimization
Neural networks are based on empirical risk minimization
SVM are based on structural risk minimization (Vapnik 1995,98) 11
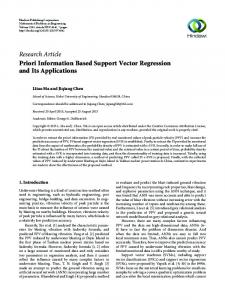
SVM Formulation Given {xi,yi} with yi∈{-1,1}, find a hyperplane that separates the two classes with a maximum margin. Margin is the distance between the two classes shown in the following figure.
Distance can be computed by using different norms. Each norm provides a different optimization problem.
The SVM learning problem is equivalent to the following optimization problem
12
l
min φ ( w, ξ ) =|| w || +C ∑ ξ i i =1
Subject to y i ( wxi + b) ≥ 1 − ξ i
(1)
ξ ≥0
13
w Class1 Class -1
Margin
2 jjwjj
Figure 1: Maximum Margin 14
Optimal point w∗ =
l
∑
λ∗i yi xi
i =1
Support vector: a training vector for which λ ∗i > 0 .
15
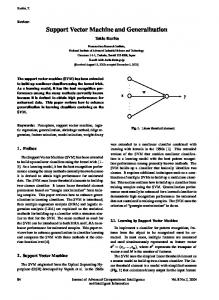
ϕ(x)
Non-Linear Separation
Linear Separation
Figure 2. The Kernel Method for Classification
16
Kernelization To handle non-linear discriminant functions . Linear classification methods can be applied in feature space to solve problems that are non-linear in the input space. This can be done by making the necessary transformation ϕ from the input space to a higher dimensional space known as the feature space. 17
This mapping creates the corresponding classification problem in feature space, allowing linear separation of the problem data in feature space. Dot product in feature space is defined as K(x1, x2) = ϕ(x1). ϕ(x2) Most commonly used kernel functions are: Polynomials:K (x1, x2) = ((x1.x2) +1)d ,where d is the degree of the polynomial. Radial Basis:K(x1, x2) = exp (– ||x1-x2||2 /2σ2). 18
l
1 l F ( Λ ) = ∑ λi − ∑ 2 i =1 i =1
max Subject
l
∑ λ λ y y K (x , x j =1
i
j
i
j
i
j
)
to l
∑λ y i =1
i
i
=0
λi ≤ C λi ≥ 0
i = 1,2 ,....l i = 1,2 ,....l l
f ( x ) = sign (
∑ i =1
λ* i yi K ( x, xi ) + b* ) 19
Experiments
Datasets are taken from WSR-88D MDA output Input variables to SVM/ANN are the outputs of the MDA algorithm The number of input variables (attributes) is 23. Definition of the variables can be found in Marzban and Stumpf (1996) and the Table (just presented). The number of observations is more than 60,000. 10 different datasets are used with 2,500 observations which are chosen randomly from the whole dataset. 20
Confusion matrix and forecast indices
Confusion matrix Observed Yes Predicted
Total
No
Total
Yes
Hits (a)
False alarm (b)
Forecast Yes
No
Misses (c)
Correct negative (d)
Forecast No
Observed yes
Observed No
21
(Continued)
The performance of the techniques used is assessed by using the following forecast evaluation indices
a
Probability of Detection (POD)= a + c b False Alarm Rate(FAR)= a + b a Critical Success Index(CSI) = a + b + c a+b Bias = a + c b Probability of false Detection (POFD) = b + d a b True skill statistic (H-K Skill ) = a + c − b + d (a)(d ) Odds Ratio(OR) = (b)(c) 22
continued
POD measures the fraction of observed “yes” events that were correctly forecast. Its range is 0 to 1 and a perfect score is 1 (or 100%). Note that POD is sensitive to hits, therefore, good for rare events. FAR measures the fraction of "yes" forecasts in which the event did not occur. Its range is 0 to 1, and 0 is a perfect rate. FAR is sensitive to false alarms and it ignores misses. CSI measures the fraction of observed and/or forecast events that were correctly forecast. Its range is 0 to 1, with a perfect score being 1. CSI is sensitive to hits, penalizing both misses and false alarms.
23
continued
Accuracy measures the fraction of all forecasts that were correct, which makes it a seemingly intuitive measure. The range is 0 to 1, with 1 being best. Bias measures the ratio of the frequency of forecast events to the frequency of observed events. The range is from 0 to infinity. A perfect score is 1. Bias indicates whether the forecast system has a tendency to underforecast (bias< 1) or overforecast (bias >1) events. POFD measures the ratio of false alarms to the total number of no observations. The probability of false detection is a measure of inaccuracy with respect to the observations and provides a measure of the extent to which the forecasts provide a false warning for the occurrence of an event. POFD varies from 0 to 1. A perfect score is zero. 24
continued
The concept of skill is one where a forecast is superior to some known reference forecast (e.g., random chance). Skill ranges from –1 (anti-skill) to 0 (no skill over the reference) to +1 (perfect skill). Heidke’s skill formulation is commonly used in meteorology since it uses all elements in the confusion matrix and works well for rare event forecasting (e.g. tornadoes) (Doswell et al., 1990).
25
SVM specific parameters(Continued)
For the SVM algorithm, the radial basis kernel function is used with different sigma values.
First, we compared the SVM with different sigma values.
Second, we compared SVM with Neural Networks.
The following two tables show the results of the comparison.
26
Table 1. The Accuracy, CSI, POD, Bias, ODDS, FAR, POFD and H-K Skill for different kernel parameters.
σ 1.25 2.5 7.25 15
ACCURACY CSI POD Bias ODDS FAR POFD H-K Skill (%) (%) (%) (%) (Ratio) (%) (%) (%) 83.6 44.65 60.13 94.76 14.08 36.43 9.77 50.36 85.54 48.7 62.38 90.48 19.54 30.99 7.93 54.45 88.27 53.46 61.24 75.8 37.44 19.19 4.11 57.13 87.98 51.75 58.71 72.15 36.53 18.61 3.79 54.92
27
Table 2. The validation CSI for SVM, neural networks, MDA and discriminant analysis for ten different training and validation sets. The values for MDA, discriminant analysis and neural networks are taken from [5]. Seed 1 2 3 4 5 6 7 8 9 10 Average
CSIM DA 26.9 24 24.7 28.7 27.4 28 29.9 21.3 27.7 21.5 26.01
CSIDA 31 29.2 28.1 27.7 30 28.8 26.1 28.7 30.6 26.5 28.67
CSIN N 36.9 35.7 38.3 33.6 34.2 32.5 33.1 29.1 37.8 31.7 34.29
CSIS V M 47.78 47.49 50.2 49.38 47.5 44.93 51.62 48.19 50.5 49.41 48.7
28
Remarks
Selection of the kernel related parameters is important and has to be chosen carefully Comparison of SVM with other techniques such as neural networks, discriminant analysis, mesocyclone detection algorithm shows that SVM is superior than other methods
29
Results based on new sampling strategies
Randomized sampling has been altered (tornado and nontornado observations selected from different dates) Added a new kernel based learning machine (MPM) Vary the ratio of tornado to nontornado observations 30
1 0.9 0.8 Accuracy
0.7 LDA
0.6
MPM
0.5
NN
0.4
SVM
0.3 0.2 0.1 0 5
10
15
20
25
30
35
40
45
50
Pe rce ntage of Tornado
31
1 0.9 0.8 0.7
NN
FAR
0.6
SVM
0.5
LDA
0.4
MPM
0.3 0.2 0.1 0 5
10
15
20
25
30
35
40
45
50
Percentage of Tornado
32
6 5
NN
BIAS
4
SVM
3
LDA
MPM
2 1 0 5
10
15
20
25
30
35
40
45
50
Percentage of Tornado
33
1
POD
0.9 0.8 0.7 0.6
NN SVM
0.5 0.4
LDA MPM
0.3 0.2 0.1 0 5
10
15
20
25
30
35
40
45
50
Percentage of Tornado
34
POFD
1 0.9 0.8 0.7 0.6 0.5 0.4 0.3 0.2 0.1 0
NN LDA SVM MPM
5
10
15
20
25
30
35
40
45
50
Percentage of Tornado
35
CSI
1 0.9 0.8 0.7 0.6 0.5 0.4 0.3 0.2 0.1 0
NN SVM LDA MPM
5
10
15
20
25
30
35
40
45
50
Percentage of Tornado
36
1 0.9 0.8
Heidke Skill
0.7
MPM
0.6
SVM
0.5
NN
0.4
LDA
0.3 0.2 0.1 0 5
10
15
20
25
30
35
40
45
50
Percentage
37
Conclusion
A new method has been used for forecasting tornadoes Accuracy of the SVM method depends on the free parameters of the kernel. SVM is compared with other datadriven techniques Several forecasting indices are used for comparison Next step is to incorporate the above algorithms in the tornado detection algorithms of NSSL
Funded through NSF EIA-0205628
38