Swappable views. ⢠Best fit slope display support ... Java API support for regression engine. ⢠Java API support for
FORTEAIGLE
June 2015
FORTEAIGLE
What is FORTEAIGLE ρ (rho)? Forteaigle ρ (rho) is a statistical tool for computing the Pearson product moment coefficient of correlation and doing linear regression analysis. In simple words, it is a tool to determine the relationship between two sets of variables and additionally, predict the values of the dependent variable from a given independent variable
FORTEAIGLE
Uses
University teaching tool/supplement Academic research Commercial research Social / government research Manufacturing Six sigma supplement tool Developer integration using APIs Quality improvement
FORTEAIGLE
Features • • • • • • • • • • • • • • • • • •
Import data from CSV Import data from XLS files Load files from local file or from live URL Swappable views Best fit slope display support Smart rendering - scale plot automatically Multiple views : scatter plot, table and summary views Correlation summary data view Select precision display Plot point size selection Min/Max line display support Descriptive statistics data view Color options for plot lines Select HTML template options Statistics symbols in view Linear regression Export image in different formats Create and import templates
• • • • • • • • • • • • • • • • •
Scalable - supports n records Export plot as image Dynamic highlighting of plot from table record selection Expand point on highlight support Average line display support Flexible - add, edit, delete, exclude records Data simulation support using exclude record Java API support for datasource inputs Java API support for regression engine Java API support for report generation Best fit Y display Toggle/maximize view support Dynamic computation and rendering Formula display Residual display Multiple output - Export into HTML, CSV Runs on Windows, Mac and Linux FORTEAIGLE
Features Table Feature Input Files Supported
DAT, CSV, XLS, XLSX
Input sources
local files, URLs, databases
Datasources
yes
Linear Regression Engine API Support
yes
Interface APIs for Report Generation
yes
Interface APIs for Input Sources
yes
Linear regression
yes
Residual display
yes
Simulation feature via exclude records
yes
Precision selection support
yes
Best fit slope
yes
Swappable Views
yes
Toggle Views
yes
Plot color selection via palette
yes
Dynamic rendering
yes
Easiness of Reuse of Components
yes
FORTEAIGLE
Features Table Cont. Feature GUI support
yes
Interactive
yes
Learning curve
no
OS supported
Windows, Linux, Mac
Programming required Render mechanism
no dynamic
Reusable components
yes
Same Program/Different OS
yes
Export plot image support
yes
Image types supported
GIF, BMP, PNG, JPEG
Template based output
yes
Template files type Import support for output templates
HTML yes
FORTEAIGLE
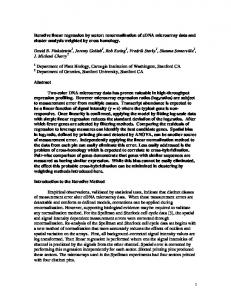
Design Engine
Model
View A
View B
View C
View D FORTEAIGLE
Design Engine
Model
View A
View B
View C
View D FORTEAIGLE
Input Sources Supported input sources by default: • MS excel files (.xls, .xlsx) • CSV files • TAB (tab separated files)
Upcoming supported input sources: • datasource based input source • XML • RSS files
Supports extensions: 1. Developers can create and configure their own implementation classes of input sources including: • database input sources (Oracle, SQL Server, MySQL, etc) • XML files • excel files 2. End-users can download and import additional/specialized input source implementation libraries Files Locations Supported: • Local Files • Live URL Files FORTEAIGLE
Input Sources • •
• • • •
Web files Local files
.dat .csv .xls .xlsx
FORTEAIGLE
Input Options • •
Dynamic header detection Adds the headers as options to be used as the X or Y variables
FORTEAIGLE
Model and Views • • • •
• • • • •
Tabular data Scatter plot Correlation data Descriptive data
Dynamic calculation Dynamic rendering No manual selection required to render No scripting No programming FORTEAIGLE
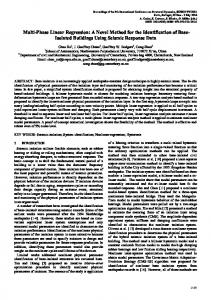
Dynamic Highlighting
• • • •
Select table record and see the point in the plot gets dynamically highlighted by color. Toggle the expand point to see the it expanded on record selection Choose the point size according to your preference Choose the point color according to your preference
FORTEAIGLE
Dynamic Plot/Calculation See how plot and data change as you add, edit, delete or exclude records.
FORTEAIGLE
Dynamic Plot/Calculation Data Updated
Plot Added Point Added
FORTEAIGLE
Dynamic Plot/Calculation Data Updated
Plot Added Point Added
FORTEAIGLE
Toggle Views
Toggle view allows you to:
- see table view only
- see plot view only
- see plot and data views only
- see plot and correlation data only
- see plot and descriptive data only
FORTEAIGLE
Regression Data Coefficient of correlation (ρ) is then matched against the interpretation table
Regression data are computed and displayed. Symbols are with the following description
Symbol Description n population size ∑x summation of X x̄ mean of X ȳ mean of Y ∑y summation of Y
ρ
Regression model formula is given from the data
Interpretation
∑xy summation of XY
1.0 >= ρ > 0.5
Highly significant correlation
∑x² summation of X squares
0.5 > ρ > 0.3
Medium correlation
∑y² summation of Y squares
0.3 > ρ > 0
Low correlation
ρ coefficient of correlation
ρ=0
No correlation
r² coefficient of determination
0 < ρ < - 0.3
Low negative correlation
m slope
-0.3 < ρ < -0.5
Medium negative correlation
b constant
-0.5 < ρ