globular proteins with sizes ranging from 89 to 140 amino acid ... 4.2 and 6.0 Å for the C atoms, for HDEA and MarA, .... the all-atom chain are lost when converting it into the simpli- ... Monte Carlo (EDMC) method (40–42); (iii) adding the side.
Proc. Natl. Acad. Sci. USA Vol. 96, pp. 5482–5485, May 1999 Biophysics
Protein structure prediction by global optimization of a potential energy function ADAM LIWO*†, JOOYOUNG LEE*, DANIEL R. RIPOLL‡, JAROSLAW PILLARDY*,
AND
HAROLD A. SCHERAGA*§
*Baker Laboratory of Chemistry and Chemical Biology, Cornell University, Ithaca, NY 14853-1301; ‡Faculty of Chemistry, University of Gdans' k, Sobieskiego 18, 80-952 Gdans' k, Poland; and ‡Cornell Theory Center, Ithaca, NY 14853-3801
Contributed by H. A. Scheraga, March 9, 1999
The reason for this is both the inaccuracy of the potential energy functions devised to represent the protein energy landscape and the lack of powerful methods for global optimization. Thus, some researchers have introduced variants of ab initio methods that include, as a major part of the procedure, secondary-structure predictions and multiple-sequence alignments that are used as constraints in subsequent conformational searches. These methods (14–17)¶ have achieved an important degree of success in predicting the structures of a number of proteins. Here, we describe a method for protein structure prediction that is based solely on global optimization of a potential energy function. Methodology. Reduced representations of proteins (in which each amino acid residue is represented by one or a few interaction sites) have recently been used with great success in theoretical studies of the physics of protein folding (18 –23), as well as in designing methods for proteinstructure prediction (14 –17). Recently, we devised a hierarchical approach to protein-structure prediction (24, 25), whose key stage is global optimization of off-lattice simplified polypeptide chains. In subsequent stages, the low-energy conformations of a protein obtained at the coarse-grain level are gradually transformed to all-atom chains. As in related approaches (3, 14 –17, 26 –28), the use of a reduced representation of polypeptide chains allows one to explore the conformational space in reasonable time, provided that adequately good global-search techniques are used. An off-lattice approach provides the possibility of using efficient optimization methods that require a continuous representation of the conformational space. In the last few years, we have developed a united-residue (UNRES) force field (24, 25, 29–31) that proved successful in predicting the native-like structures of small globular proteins with simple topology (such as a fragment of the B domain of staphylococcal protein A) as the lowest-energy conformations. In our model (24, 25, 29), a polypeptide chain is represented initially by a sequence of a-carbon (Ca) atoms linked by virtual bonds with attached united side chains (SC) and united peptide groups (p) located in the middle between the consecutive a-carbons. Only the united peptide groups and united side chains serve as interaction sites, the a-carbons assisting in the definition of the geometry (see Fig. 1 of ref. 29). All the virtual bond lengths (i.e., Ca–Ca and Ca–SC) are fixed; the Ca–Ca distance is taken as 3.8 Å, which corresponds to trans peptide groups, while the side-chain angles (aSC and bSC), as well as the virtual-bond angles (u) and the dihedral angles (g) can vary.
ABSTRACT An approach based exclusively on finding the global minimum of an appropriate potential energy function has been used to predict the unknown structures of five globular proteins with sizes ranging from 89 to 140 amino acid residues. Comparison of the computed lowest-energy structures of two of them (HDEA and MarA) with the crystal structures, released by the Protein Data Bank after the predictions were made, shows that large fragments (61 residues) of both proteins were predicted with rms deviations of 4.2 and 6.0 Å for the Ca atoms, for HDEA and MarA, respectively. This represents 80% and 53% of the observed structures of HDEA and MarA, respectively. Similar rms deviations were obtained for ;60-residue fragments of the other three proteins. These results constitute an important step toward the prediction of protein structure based solely on global optimization of a potential energy function for a given amino acid sequence. Prediction of protein structure based on sequence information alone is one of the challenges of contemporary structural biology. There are three classes of approach to the structure-prediction problem: sequence-homology methods, methods based on energetic criteria, and threading methods. In the first method, the unknown structure is constructed based on known structural motifs whose amino acid sequences are similar to the sequence studied, taking advantage of the empirical relationship between sequence and the three-dimensional structure (1– 6). The methods of the second group (7–9) are based on the thermodynamic hypothesis formulated by Anfinsen (10), according to which the native structure of a protein corresponds to the global minimum of its free energy under given conditions. Structure prediction is therefore achieved by a search for the global minimum of an appropriate potential energy function; this is often called the ab initio or de novo approach. Throughout this paper, the ab initio approach to the protein-folding problem is meant to refer to methods based solely on global optimization of a potential energy function. The threading methods can be placed between these two approaches: they use the energy (or energy-like) functions to distinguish the native structure from alternative structures, but the unknown sequence is superposed on structural motifs chosen from a database of known protein structures (11). Although sequence homology and threading methods are thus far the most successful tools for protein-structure prediction, their success depends on the presence of sequence- or structural-homologous proteins in the databases. On the other hand, global optimization of a potential energy function is based on physical grounds, but thus far has had little success. Protein structure prediction based solely on the thermodynamic hypothesis has been considered to be unfeasible (12, 13).
Abbreviations: UNRES, united-residue force field; CSA, conformational space annealing; rmsd, rms deviation; PDB, Protein Data Bank. §To whom reprint requests should be addressed. e-mail: has5@ cornell.edu. ¶Bystroff, C., Simons, K. & Baker, D. Third Meeting on the Critical Assessment of Techniques for Protein Structure Prediction, Dec. 13–17, 1998, Pacific Grove, CA, p. 23. i Third Community Wide Experiment on the Critical Assessment of Techniques for Protein Structure Prediction, Dec. 13–17, 1998, Pacific Grove, CA. http://predictioncenter.llnl.govycasp3yCasp3.html.
The publication costs of this article were defrayed in part by page charge payment. This article must therefore be hereby marked ‘‘advertisement’’ in accordance with 18 U.S.C. §1734 solely to indicate this fact. PNAS is available online at www.pnas.org.
5482
Biophysics: Liwo et al.
Proc. Natl. Acad. Sci. USA 96 (1999)
The energy of the virtual-bond chain is expressed by Eq. 1. U5
O i,j
U SCiSCj1
1 w loc
O i
O
iÞj
U SCi pj 1 w el
O
i,j21
U pi pj 1 w tor
O i
U tor~ g i!
@U b~ u i! 1 U rot~ a SCi, b SCi!# 1 w corrU corr
[1]
The term USCi SCj consists of the mean free energy of the hydrophobic (hydrophilic) interactions between the side chains. It therefore implicitly contains the contributions arising from the interactions with the solvent. The terms USCi pj denote the excluded-volume potential of the side-chain–peptidegroup interactions. The peptide-group interaction potential (Upi pj) accounts mainly for the electrostatic interactions between them or, in other words, for their tendency to form backbone hydrogen bonds. Utor, Ub, and Urot denote the energies of virtual-dihedral angle torsions, virtual-angle bending, and side-chain rotamers; these terms reflect the local propensities of the polypeptide chain. Finally, the multibody (or cooperative) term Ucorr arises from the fact that details of the all-atom chain are lost when converting it into the simplified chain. For the functional forms of the energy terms, the reader is referred to the original papers (24, 25, 29–31). The ws denote relative weights of the respective energy terms. The energy expressions were parameterized based on distribution and correlation functions determined from a set of 195 highresolution nonhomologous structures from the Protein Data Bank (PDB) (32) or by averaging the all-atom energy functions. The relative weights of the energy terms were calculated so as to maximize the ratio of the gap between the energy of the native structure to the average energy of the nonnative structures of the phosphocarrier protein (1PTF) chosen to calibrate the force field (30). This was accomplished by developing a method (30) based on the approach of Wolynes and coworkers (19), Shakhnovich and coworkers (20), and Hao and Scheraga (21, 23, 33, 34). The effectiveness of the approach relies on the global optimization method. Recently, we developed a very efficient method called Conformational Space Annealing (CSA) (35– 38) for this purpose. The CSA method searches the whole conformational space in its early stages and then narrows the search to smaller regions with low energy as the distance cutoff, Dcut, which defines the similarity of two conformations, is reduced. As in genetic algorithms (39), CSA starts with a preassigned number (usually 50) of randomly generated and subsequently energy-minimized conformations. This pool of conformations is called the bank. At the beginning, the bank is a sparse representation of the entire conformational space. A number of dissimilar conformations (usually 20) are then selected from the bank, excluding those that have already been used; they are called seeds. Each seed conformation is modified by changing from one to one-third of the total number of variables pertaining to a contiguous portion of the chain; the new variables are selected from one of the remaining bank conformations, rather than being picked at random. Each conformation is energy-minimized to give a trial conformation. Thirty trial conformations are generated for each seed (a total of 600 conformations). This is the most time-consuming part of the computation, but it is highly suitable for parallel computing (38). For each trial conformation, a, the closest conformation A from the bank (in terms of the distance DaA) is determined. If DaA,Dcut (Dcut being the current cutoff criterion), a is considered similar to A; in this case a replaces A in the bank, if it is also lower in energy. If a is not similar to A, but its energy is lower than that of the highest-energy conformation in the bank, B, a replaces B. If neither of the above conditions holds, a is rejected. The narrowing of the search regions is accomplished by setting Dcut to a large value initially (usually one-half of the average pair distance in the bank), and gradually reducing it as the search progresses.
5483
Special attention is paid to selecting seeds that are far from each other. One round of the procedure is completed when there is no seed to select (i.e., all conformations from the bank have already been used). The round is repeated a predetermined number of times. The greatest advantage of the CSA method is that it always finds distinct families of low-energy conformations. The low-energy united-residue structures are subsequently converted to all-atom chains in the following steps (25): (i) positioning the peptide groups between consecutive Cas so as to achieve optimal alignment of the peptide group dipoles (the dipole-path method) (24); (ii) further optimization of the backbone conformations by using the Electrostatically Driven Monte Carlo (EDMC) method (40–42); (iii) adding the side chains with partial optimization of their degrees of freedom; (iv) final refinement of the all-atom chains by using the EDMC method and exploration of the flexible loop regions with the use of the Go ¯-Scheraga algorithm (43, 44). In the all-atom calculations, the empirical conformational energy program for peptides (ECEPP)y3 (45–47) force field with the solvation parameters, optimized from thermodynamic data with fixed radii (SRFOPT) solvation free energy contribution (48), is used.
RESULTS AND DISCUSSION With the UNRES force field, the CSA method successfully located the native-like conformations of two helical proteins (the 10–55 residue fragment of protein A, and apo calbindin D9K—a 75-residue protein) among the low-energy ones. Alternative structures (which were mirror images of the native folds) were also found. Details of the implementation of the CSA procedure with the UNRES force field are given elsewhere (37). It should be noted that the structures of protein A or apo calbindin D9K or the class of fold that they represent were not used in the optimization of the force field. These successful predictions encouraged us to try blind predictions of some of the target proteins provided for the Third Community Wide Experiment on the Critical Assessment of Techniques for Protein Structure Prediction (CASP3)i. The amino acid sequences of these targets had been volunteered by experimental structural biologists who were in the process of determining their three-dimensional structures by nuclear magnetic resonance (NMR) spectroscopy or x-ray crystallography. Our group submitted predictions for seven of these targets. For all five globular proteins, large portions of contiguous fragments (;60) were predicted within the range of 4.2–6.8 Å rmsd (rms deviation) of Ca atoms from the experimental structures. For the two remaining targets, cor-
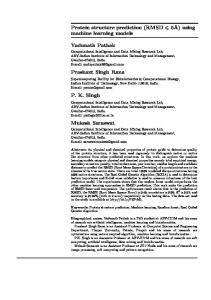
FIG. 1. Superposition of the crystal (red) and predicted (yellow) structures of HDEA. The Ca atoms of the fragment included between residues D25 and I85 were superposed. The rmsd is 4.2 Å. Helices 3, 4, and 5 are indicated as H-3, H-4 and H-5, respectively.
5484
Biophysics: Liwo et al.
Table 1.
Summary of results
No. of aa Protein in x-ray (no. of aa) structure HDEA (89)
76
MarA (129)
116
No. of aa in a fragment 76 (10–85) 61 (25–85) 27 (16–42) 116 (9–124) 61 (9–69)
Proc. Natl. Acad. Sci. USA 96 (1999)
Ca rmsd, Percentage Å (predictedyobserved) 9.0 4.2 2.9 11.0 6.0
100 80 36 100 53
responding to small synthetic constructs, we had a similar degree of success. The details of these predictions are discussed elsewhere (49). At the time of writing this report, the structures of most of the targets have been made available only to the participants in CASP3. Additionally, experimental structures of three of them have been publicly released: T0056 (NMR structure of the N-terminal domain of Escherichia coli Dnab helicase; PDB entry: 1JWE), T0061 [x-ray structure of HDEA, E. coli (50); 89 amino acid residues; PDB entry: 1BG8] and T0079 [x-ray structure of MarA (51); 129 amino acid residues; PDB entry: 1BL0]. For target T0056, some secondary structure information was provided to the predictors. A single model was submitted for T0056, and analysis of this prediction is reported elsewhere (49). Here, we discuss the performance of our method on the other two proteins in some detail. For proteins HDEA and MarA, we submitted four models ranked according to the UNRES energy, each of them representing a low-energy family of conformations. The discussion refers to the lowest-energy conformations (submitted as model 1 for each protein). The native structure of HDEA is a five-helix bundle with a long loop between the third (H-3) and the fourth (H-4) helix (50) (Fig. 1). The rmsd between the crystal and our predicted structure (see Table 1) is 4.2 Å for the Ca atoms, when the structures are superposed from residues D25 to I85 (80% of the experimentally observed structure), which corresponds to native helices H-3, H-4, and H-5 (the first nine and the last four residues are missing in the crystal structure). Our model is different from the native structure in the packing of the 27-residue N-terminal part (residues 1 to 9 are not observed in the crystal structure). This N-terminal fragment, which contains H-2, is rotated by approximately 180°, resulting in an overall rmsd (residues 10–85) of 9.0 Å for the Ca atoms. Superposing helices H-2 and H-3 (residues W16 to K42), we obtain an rmsd for the Ca atoms of 2.9 Å (Figure 2), which means that our predicted structure can be transformed into the native topology by only a single rotation of the N-terminal helix—turn–helix motif. It should be noted that the native protein forms a dimer in the crystal state and has a disulfide
FIG. 3. Superposition of the crystal (red) and predicted (yellow) structures of the MarA N-terminal domain. The Ca atoms of residues D9 to A69 were superposed with an rmsd of 6.0 Å. Helices 1, 2, 3, and 4 are indicated as H-1, H-2, H-3, and H-4, respectively.
bond linking helices H-2 and H-4, which is missing in our model. Information about the existence of a disulfide bond was not provided with the target. HDEA was assessed by the CASP3 refereesi as one of the most difficult targets for either homology modeling or threading methods because of its rare fold. Our prediction was evaluatedi (51) as the most successful one for this particular target. Our second prediction pertains to the protein MarA. In the crystal structure of a complex with DNA (PDB code: 1BL0), MarA appears as a bipartite helix—turn–helix protein (51). It contains two domains composed of four helices each (our simulations resulted in low-energy conformations containing two domains, a feature that was not known a priori). Our predicted structure has the same topology of the N-terminal domain as in the crystal (52) (residues 1–8 are not observed in the x-ray structure). The rmsd between the predicted and experimental structures for the fragment containing residues D9–A69 is 6.0 Å for the Ca atoms (Figure 3). The major difference between our prediction and the crystal structure is that the C-terminal domain in the predicted structure is folded as a mirror image of that part of the native structure. Furthermore, the long helix, H-4, connecting the two domains in the x-ray structure is significantly kinked in the middle in our predicted structure. The latter features result in tight packing of the two domains in our model whereas, in the native structure, the N- and the C-terminal domains each bind separately to DNA (and hence are not packed against each other). This leads to an rmsd between the predicted and native structures of 11.0 Å for all the observed Ca atoms. Our
FIG. 2. Superposition of the crystal (red) and predicted (yellow) structures of the 27-residue fragment (W16 to K42) of HDEA. The Ca atoms were superposed with an rmsd of 2.9 Å. Helices 2 and 3 are indicated as H-2, and H-3, respectively.
Biophysics: Liwo et al. calculations were carried out on the MarA protein only in the absence of the DNA.
CONCLUSIONS Our results demonstrate that it is possible to predict a significant portion of protein structure by using only a potential energy function and a powerful method of conformational search, without the aid of knowledge-based information provided by multiple-sequence alignment, secondary-structure prediction, or fold recognition. The probability of obtaining a structure within an rmsd of 6 Å for 60–80 residue proteins has been discussed recently, and a prediction with such an rmsd was considered to be quite successful, i.e., with a very low probability of having been obtained by chance (17). In our view, there are two reasons for this success. First, although our UNRES force field is approximate, it is based on physical grounds, both in deriving the energy terms and in its parameterization (25, 29, 30). Second, the CSA method of conformational search appears to locate all significant lowenergy structures in real time. This is very important because, given the approximations inherent in the force field, the lowest-energy structure may not be considered as the only possible candidate for the prediction, but a few distinct lowenergy structures should be taken into account. Further improvement of our approach can be accomplished by systematic interplay between CSA and UNRES. For example, by introducing cooperativity between local and backbone electrostatic interactions, it may be possible to extend the applicability of our approach from the largely a-helical proteins treated here to those including segments of b-structure. It should also be emphasized that, at the present stage of development, our approach can treat proteins of up to 140 residues with presently available computer resources in less than a week of computations. For MarA and HDEA, the calculations consumed a total of 100 and 70 hr of wall clock time, respectively, by using 64 processors of the IBM SP2 supercomputer at the Cornell Theory Center. We thank K. D. Gibson for helpful discussions and D. Sverdlik and D. Dwyer of the Cornell Theory Center for technical assistance. This research was supported by grants from the National Science Foundation (MCB95-13167), the National Institutes of Health (NIH) (GM14312), the NIH National Center for Research Resources (P41RR04293), and the Polish State Committee for Scientific Research, KBN (DS 8245-4-0124-9). Support was also received from the National Foundation for Cancer Research. The computations in this work were carried out at the Cornell Theory Center, which receives funding from Cornell University, New York State, the National Center for Research Resources at the National Institutes of Health, the National Science Foundation, the Department of Defense Modernization Program, and members of the Corporate Partnership Program. 1. 2. 3. 4. 5. 6. 7. 8. 9. 10. 11. 12.
Lewis, P. N. & Scheraga, H. A. (1971) Arch. Biochem. Biophys. 144, 584–588. Warme, P. K., Momany, F. A., Rumball, S. V., Tuttle, R. W. & Scheraga, H. A. (1974) Biochemistry 13, 768–782. Jones, T. A. & Thirup, S. (1986) EMBO J. 5, 819–822. Clark, D. A., Shirazi, J. & Rawlings, C. J. (1991) Prot. Eng. 4, 751–760. Rooman, M. J. & Wodak, S. J. (1992) Biochemistry 31, 10239– 10249. Johnson, M. S., Overington, J. P. & Blundell, T. L. (1993) J. Mol. Biol. 231, 735–752. Scheraga, H. A. (1992) Int. J. Quant. Chem. 42, 1529–1536. Scheraga, H. A. (1996) Biophys. Chem. 59, 329–339. Va´squez, M., Ne ´methy, G. & Scheraga, H. A. (1994) Chem. Rev. 94, 2183–2239. Anfinsen, C. B. (1973) Science 181, 223–230. Fischer, D., Rice, D., Bowie, J. U. & Eisenberg, D. (1996) FASEB J. 10, 126–136. Jones, D. T. (1997) Curr. Opin. Struct. Biol. 7 377–387.
Proc. Natl. Acad. Sci. USA 96 (1999) 13. 14. 15. 16. 17. 18. 19. 20. 21. 22. 23. 24. 25. 26. 27. 28. 29. 30. 31. 32. 33. 34. 35. 36. 37. 38. 39. 40. 41. 42. 43. 44. 45. 46. 47. 48. 49. 50. 51. 52.
5485
Mirny, L. A. & Shakhnovich, E. I. (1998) J. Mol. Biol. 283, 507–526. Skolnick, J., Kolin ´ski, A., Brooks III, C. L., Godzik, A. & Rey, A. (1993) Curr. Biol. 3, 414–424. Kolin ´ski, A. & Skolnick, J. (1994) Proteins Struct. Funct. Genet. 18, 338–352. Skolnick, J., Kolin ´ski, A. & Ortiz, A. R. (1997) J. Mol. Biol. 265, 217–241. Reva, B. A., Finkelstein, A. V. & Skolnick, J. (1998) Fold. Des. 3, 141–147. Dill, K. A. (1990) Biochemistry 29, 7133–7155. Goldstein, R. A., Luthey-Schulten, Z. A. & Wolynes, P. G. (1992) Proc. Natl. Acad. Sci. USA 89, 9029–9033. Saˇli, A., Shakhnovich, E. & Karplus, M. (1994) Nature (London) 369, 248–251. Hao, M. H. & Scheraga, H. A. (1994) J. Phys. Chem. 98, 9882–9893. Wolynes, P. G., Onuchic, J. N. & Thirumalai, D. (1995) Science 267, 1619–1620. Hao, M. H. & Scheraga, H. A. (1995) J. Chem. Phys. 102, 1334–1348. Liwo, A., Pincus, M. R., Wawak, R. J., Rackovsky, S. & Scheraga, H. A. (1993) Protein Sci. 2, 1697–1714. Liwo, A., Pincus, M. R., Wawak, R. J., Rackovsky, S. & Scheraga, H. A. (1993) Protein Sci. 2, 1715–1731. Levitt, M. & Warshel, A. (1975) Nature (London) 253, 694–698. Seetharamulu, P. & Crippen, G. M. (1991) J. Math. Chem. 6, 91–110. Maiorov, V. N. & Crippen, G. M. (1992) J. Mol. Biol. 227, 876–888. Liwo, A., Oldziej, S., Pincus, M. R., Wawak, R. J., Rackovsky, S. & Scheraga, H. A. (1997) J. Comput. Chem. 18, 849–873. Liwo, A., Pincus, M. R., Wawak, R. J., Rackovsky, S., Oldziej, S. & Scheraga, H. A. (1997) J. Comput. Chem. 18, 874–887. Liwo, A., Kaz´mierkiewicz, R., Czaplewski, C., Groth, M., Oldziej, S., Wawak, R. J., Rackovsky, S., Pincus, M. R. & Scheraga, H. A. (1998) J. Comput. Chem. 19, 259–276. Bernstein, F. C., Koetzle, T. F., Williams, G. J. B., Meyer, E. F., Jr., Brice, M. D., Rodgers, J. R., Kennard, O., Shimanouchi, T. & Tasumi, M. (1977) J. Mol. Biol. 112, 535–542. Hao, M. H. & Scheraga, H. A. (1996) Proc. Natl. Acad. Sci. USA 93, 4984–4989. Hao, M. H. & Scheraga, H. A. (1996) J. Phys. Chem. 100, 14540–14584. Lee, J., Scheraga, H. A. & Rackovsky, S. (1997) J. Comput. Chem. 18, 1222–1232. Lee, J., Scheraga, H. A. & Rackovsky, S. (1998) Biopolymers 46, 103–115. Lee, J., Liwo, A. & Scheraga, H. A. (1999) Proc. Natl. Acad. Sci. USA, 96, 2025–2030. Lee, J. & Scheraga, H. A. (1999) Int. J. Quant. Chem., in press. Goldberg, D. E. (1989) Genetic Algorithms in Search, Optimization and Machine Learning. (Addison–Wesley, Reading, MA). Ripoll, D. R. & Scheraga, H. A. (1988) Biopolymers 27, 1283– 1303. Ripoll, D. R. & Scheraga, H. A. (1990) Biopolymers 30, 165–176. Ripoll, D. R., Liwo, A. & Scheraga, H. A. (1998) Biopolymers 46, 117–126. Go ¯, N. & Scheraga, H. A. (1970) Macromolecules 3, 178–187. Palmer, K. A. & Scheraga, H. A. (1991) J. Comput. Chem. 12, 505–526. Momany, F. A., McGuire, R. F., Burgess, A. W. & Scheraga, H. A. (1975) J. Phys. Chem. 79, 2361–2381. Ne´methy, G., Pottle, M. S. & Scheraga, H. A. (1983) J. Phys. Chem. 87, 1883–1887. Ne´methy, G., Gibson, K. D., Palmer, K. A., Yoon, C. N., Paterlini, G., Zagari, A., Rumsey, S. & Scheraga, H. A. (1992) J. Phys. Chem. 96, 6472–6484. Vila, J., Williams, R. L., Va´squez, M. & Scheraga, H. A. (1991) Proteins Struct. Funct. Genet. 10, 199–218. Lee, J., Liwo, A., Ripoll, D. R., Pillardy, J. & Scheraga, H. A. (1999) Proteins Struct. Funct. Genet., submitted. Yang, F., Gustafson, K. R., Boyd, M. R. & Wlodawer, A. (1998) Nat. Struct. Biol. 5, 763–764. Koehl, P. & Levitt, M. (1999) Nat. Struct. Biol. 6, 108–111. Rhee, S., Martin, R. G., Rosner, J. L. & Davies, D. R. (1998) Proc. Natl. Acad. Sci. USA 95, 10413–10418.