World of Computer Science and Information Technology Journal (WCSIT) ISSN: 2221-0741 Vol. 1, No. 5, 177-183, 2011
Prototype System for Monitoring and Computing Greenhouse gases R. Jaichandran
Dr. A. Anthony Irudhayarj
Department of Information Technology AVIT–Vinayaka Missions University IT–Highways (OMR), TN-603104, India
[email protected]
Department of Information Technology AVIT–Vinayaka Missions University IT–Highways (OMR), TN-603104, India
[email protected]
Abstract—Global warming is not only the problem of the government or individual organization it is the fundamental problem of every individual. The main cause for global warming is green house gases (GHG). Monitoring and computing the greenhouse gases are a major challenging work. Globally, over the past several decades, human-induced activities like industrial revolution and burning of fossil fuels in power stations, vehicle transport systems and industries contribute significantly to the emission and concentration of GHG in atmosphere. Avoiding their usage may reduce the emission of GHG, but it may not be a practical approach as they are mandatory in modern day-to-day life, alternatively regular monitoring and reporting of GHG parameters may create awareness to individuals and organization for effective and proper use of human induced activities. There are very few works done in developing embedded systems for computing GHG. We have implemented a prototype system for sensing and computing the level of existence of GHG parameters (like CO 2, CO, temperature and humidity) in atmosphere using environmental sensors and advanced microcontrollers and energy efficient wireless technologies. The Prototype supports quality in terms of low cost, energy efficiency, flexibility and user friendliness. Data is collected, consistency models are define for analyzing the quality of data and the level of GHG in the deployed environment is computed. The results show that the prototype is capable for monitoring and computation of GHG in the deployed environment and can be applied at all levels of organization for creating awareness, performing scientific studies and to forecast re mediation policies by the authorities to individuals and organization in controlling GHG parameters. Keywords- Wireless sensor network; greenhouse gases; parts per million.
I.
INTRODUCTION
Overwhelming majority of scientist agree that the globe is undergoing major climate change due to increase in greenhouse gas (GHG) concentration in atmosphere. GHG in atmosphere absorb and emit radiations within thermal infra-red range. This process is fundamental cause for global warming. One of the main causes of global warming is increase in level of emission of Carbon dioxide. Primary sources for emission of green house gases are burning of fossil fuels in power plants, vehicle transport and industrialization. The effects of global warming bring dangerous weather patterns which may cause unstable agriculture and economy [12][13][21][23][24]. Therefore, it is a great important to monitor and compute greenhouse gases in atmosphere, where we live and work. Proper monitoring may help in finding root cause of emission and also facilitates the authorities in decision making for controlling GHG parameter [25-31]. Previously wired transmission mode is used to connect sensors with PC, which could cause large cost, wiring complexity and difficulty in maintenance of traditional environment monitoring system. In recent years, monitoring
systems using wireless sensors technology has become more important because wireless sensor network (WSN) is very suitable for distributed data collecting and monitoring in tough environments. Recently monitoring system based on wireless sensor technology using ZigBee, RFID, GSM/GPRS and short message service (SMS) wireless communication system are proposed [1-8]. We use ARM microcontroller for easy programming, flexible interfacing and XBee wireless module for power efficient communication. In this paper we present a embedded system design for monitoring and computing greenhouse gases in a wireless personal area network (WPAN). The prototype supports quality in terms of easy programming, flexible interfacing, low cost, energy efficiency and user friendliness. The primary components in the prototype include carbon dioxide sensor, carbon monoxide sensor, temperature sensor, humidity Sensor, ARM Micro controller and XBee Pro Wireless module. The system performs data acquisition using client server technology and graphs are plotted for performing analysis, scientific studies and to forecast remediation policies to authorities in controlling greenhouse gases. The results show
177
WCSIT 1 (5), 177 -183, 2011 that the prototype is capable to monitor and compute GHG in the deployed environment and can be applied at all level of organization as a preliminary effort in controlling global warming. II.
BACKGROUND KNOWLEDGE
Global Warming has been identified as one of the greatest challenges facing nations, governments, business and citizens over future decades. Climate change has implications for both human and natural systems and could lead to significant changes in resources use, production and economic activity [13]. The increase in concentration of GHG in earth atmosphere contributes significantly to global warming. In response, initiatives are necessary to limit GHG concentration in atmosphere [14]. Such initiatives relay on the quantification, monitoring, reporting and verification of GHG emissions and removals [27]. A. Greenhouse gas Gases that trap heat in atmosphere are often called greenhouse gases (GHG). The primary GHG include carbon dioxide (CO2), methane (CH4), nitrous oxide (N2O), chlorofluorocarbons (CFCs), Sulfur hexafluoride (SF6) and water vapor (H2O). GHG constituent of atmosphere, both natural and anthropogenic, absorbs and emits radiation at specific wavelength within spectrum on infrared radiation emitted by earth surface, atmosphere, and clouds. This process is the fundamental cause for global warming [23] [25]. Due to global warming average temperature of earth surface increased by 0.74 ± 0.18 °C (1.33 ± 0.32 °F) during the 20th century and likely to rise further, 1.1 to 6.4 °C (2.0 to 11.5 °F) during the 21st century [12][13]. B. Global Warming Potential Global warming potential (GWP) is a relative measure of heat trapped by GHG in atmosphere. GWP is based on radiative forcing properties, including radiative efficiency (infrared absorbing ability) and decay rate of each gas relative to carbon dioxide. Radiative forcing believed to influence the climate system and the global warming potential can be used to estimate the impacts of emission of different gases upon the climate system [12]. TABLE I.
RADIATIVE FORCING OF GHG
Gas
Mole Fraction Changes 2005 1998
Radiative Forcing (WM-2) 2005 1998
Carbon dioxide
379 μmol/mol 1,774 nmol/mol 319 nmol/mol 538 pmol/mol 5.6 pmol/mol
1.66
1.46
0.48
-
0.16
0.15
0.17
0.17
0.002
0.002
Methane Nitrous oxide Chlorofluorocarbon Sulfur hexafluoride
365 μmol/mol 1,745 nmol/mol 314 nmol/mol 533 pmol/mol 4.2 pmol/mol
Table has its source in Inter governmental panel on climate change (IPCC) Fourth Assessment Report, 2007, Chapter 2. The report describes warming and cooling effects on planet in terms of radiative forcing, Mole fraction
Unit : μmol/mol = ppm = parts per million (106); nmol/mol = ppb = parts per billion (109); pmol/mol = ppt = parts per trillion (1012).
Radiative forcing capacity (RF) is the amount of energy per unit area, per unit time, absorbed by GHG that would be otherwise lost to space. GWP is defined as ratio of time integrated radiative forcing of pulse emission of 1 kg of some component i relative to that of 1 kg of reference gas (CO2). 100
RF Absi * Fi ( pathlength * density )
(1)
n 1
Where subscript i represent an interval of 10 inverse centimeters. Absi represents integrated infrared absorbance of the sample in that interval, and Fi represents RF for that interval. Global Warming potential (GWP) is defined as the ratio of the time-integrated radiative forcing from the instantaneous release of 1 kg of a trace substance relative to that of 1kg of a reference gas. TH
TH
RFi (t )dt
GWPi TH0
a [C (t )]dt i
(2)
RF (t )dt a r
0
i
0 TH
r
[Cr (t )dt
0
Where GWPi is Global Warming potential of component i, TH is time horizon over which the calculation is considered, RFi is global mean RF of component i, ai is RF per unit mass increase in atmospheric abundance of component i, Ci(t) is time dependent abundance of i, and corresponding quantities for reference gas (r) in denominator. The numerator and denominator are called absolute global warming potential of i and r respectively [21]. C. Related Work Environmental monitoring using wireless sensors technology has become more important because wireless sensors technology is very suitable for distributed data collecting and monitoring in tough environments (Hui Liu et al., 2007). Previously wired transmission mode is used to connect sensors with PC, which could cause large cost, wiring complexity and difficulty in maintenance. The advantages of wireless transmission are significant reduction and simplification in wiring and harness, allow faster deployment and installation of various types of sensors integrated with computing and communication units to form nodes with extremely low cost, small size and low power requirement [33]. Previous research on developing of wireless sensor monitoring system focus on reducing the electricity cost by designing low power consumption node for monitoring application. Seung Chul Lee et al. (2007) designed an indoor air-conditioning system with ad-hoc query function for wireless sensor network platform and the proposed electrochemical sensor has lower power consumption than semiconductor gas sensor and able to measure CO gas and the temperature of indoor air-state and transfer the data wirelessly
178
WCSIT 1 (5), 177 -183, 2011 by using ad-hoc network. Andrzej et al. (2009) proposed architecture and application of ZigBee-based mesh network combine with event-based control technique and found that the architecture shows low power consumption of the node for the application in the average of 17.4µA, while event-based control reduced the number of changes by more than 80% in comparison with a traditional time-based controller. Xiliang Zhang et al. (2008) achieved measurement and control with lower power, lower cost and lower latency by using improved LEACH clustering algorithm as a tool for analyzing latency and energy consumption for three-level network model of the wireless monitoring and control system based on multi-span architecture. In recent years researchers on wireless sensor monitoring system discussed on wireless technologies being developed range from simple IrDA that uses infrared light for short-range point-to-point communications to wireless personal area network (WPAN) for short range, point-to multi-point communications, such as Bluetooth and ZigBee, to mid-range, multi hop wireless local area network (WLAN), to longdistance cellular phone systems, such as GSM/GPRS and CDMA (Ning Wang et al., 2006). Hui Liu et al., (2007) discussed short message service (SMS) as an effective and economical solution of communication in wireless sensor network. A prototype mobile augmented real system is designed for visualizing 3D as well as textual representations of environmental information in real-time using a lightweight handheld computer (Daniel goldsmith et al., 2008). Jong Won Kwon et al. (2007), Han Zhigangn et al. (2009) implemented air pollution monitoring system using ZigBee technologies and embedded system. Greenhouse temperature and humidity monitoring system was build using zigbee wireless sensor network technology and experiment shows that the system operates stably and the energy consumption was 22.4 mA at work, 4.7 mA in sleep and the success rate of data packet reception was 97.1 % (Guomin He et al 2010). Consistency model are key to evaluate the quality of data, many consistency models have been proposed for distributed and collaborative systems; however it is not applicable to WSN because of its limited resource constraints. Kewei sha et al. (2008) implemented consistency model for WSN and it may not applicable to our prototype because of its distinct features such as limited resource constraints, specific characteristics of the application. Hence a novel consistency model should be remodeled to evaluate the quality and dependability of the collected data. Different from the above approaches, we present a embedded system prototype for wireless sensor network application for monitoring and computing GHG parameters using environmental sensors, advanced computing machine and energy efficient wireless module. The prototype architecture supports quality in terms of easy programming, flexible interfacing, low cost, energy efficiency and user friendliness for a distributed data acquisition in a wireless personal area network. The prototype supports in system serial programming with extensive debug facilities: on-chip JTAG interface unit, embedded ICR-RT real time debug unit. Consistency models are defined for evaluating data quality.
III.
SYSTEM OVERVIEW
The system components include carbon dioxide sensor, carbon monoxide sensor, temperature sensor, humidity sensor, ARM micro controller and XBee pro wireless module. Figure 1 shows the overview of the components used in the system prototype. A. Metadata for Sensor MG-811 sensor has high sensitivity to carbon dioxide (CO2). The gas sensor can measure the concentration of CO2 up to 10000 parts per million (PPM). MQ-7 sensor has high sensitivity to carbon monoxide (CO). The gas sensor can measure the concentration of CO up to 10000 PPM LM 35 sensor can measure temperature in the range between -55 to +155 degree Celsius Sy-Sh-220 sensor can measure relative humidity percentage (%RH) B. Metadata for ARM Microcontroller 32-bit micro controller with USB 2.0 module, Universal Asynchronous Receiver Transmitter (UART) Module, faster I/O ports, pipe lining techniques, timer / counter module, watch dog timer and system control 512 KB flash memory, 40 KB static Memory 400 K bit/s data rate Supports devices of heterogeneous nature C. Metadata for XBee PRO ISM 2.4 GHz frequency band Direct Sequence Spread Spectrum 250 kbps data rate pin-for-pin compatible IEEE 802.15.4 networking protocol Two or three times the range of standard ZigBee Receiver sensitivity -100dBm (1% packet error rate) Supported network topologies: Point-to-point, Pointto-multipoint & peer-to-peer 12 Direct sequence channels Figure 1 shows the architecture of system prototype which includes sensing unit and base station (sink). The sensing unit components include: sensors for environmental parameters, ARM microcontroller for computation and temporary storing and XBee Pro for transmitting the data to base station. The system is experimented using two sensing unit and a base station. The base station component include: Xbee Pro for receiving the data from sensing unit and the data table is created for analysis. The system is powered by 5V/ 2A using SMBS. All the components used in the system are cost effective and the prototype supports interfacing of components which are heterogeneous in nature and supports energy efficient modes for operation.
179
WCSIT 1 (5), 177 -183, 2011 IV.
PROBLEM ANALYSIS
The quality of data measured and collected by the wireless sensor networks may get affected by its stringent resource constraint, internal and external factors of sensor nodes deployed in harsh and unattended environment, because of which real world data are often dirty. Especially when the sensor node calibration fails, power failure, malicious attacks, noise and other environmental effects which further influence quality of the collected raw data and aggregated results. Given a dirty database D, one needs automated methods to evaluate the quality and dependability of data. V. Figure 1. System Prototype Architecture
The prototype confirms to two key functionalities: data gathering (i.e. many-to-one communication between sensing units and base station) and data dissemination (i.e. one-tomany communication between base station and sensing units). The general data format for the prototype is defined as follow.
( p , Seq, T ,Val ) i Where pi denotes the data is from the ith sensor for parameter p; Seq is the sequence number of the sampled value of the ith sensor for parameter p; TSample is the time when the value is sampled. Val is the value of the reading for the parameter p. In our application prototype the parameters sampled are co 2, co, temperature and humidity. The system samples data at regular time interval and operates in five modes: Ideal mode, Transmit mode, Receive mode, Sleep mode, Command mode. When not receiving or transmitting the data the system is in idle mode and power requirement for the mode is 55mA. In transmit mode the system will transmit the sensed data and the power requirement is 250mA. In receive mode the power requirement is 55mA. Sleep modes enable the module to enter states of low-power consumption when not in use and the power requirement is 0. The Trend consistency detects whether the trend of collected data is maintained, i.e., By detecting and counting any two
180
WCSIT 1 (5), 177 -183, 2011 continuously sampled data value vali and vali+1 which are out of each other’s endurance range (ɜ). Trend consistency is modeled as follows,
TrndCon (Trndsatisfy( D, ))
[5]
(7)
The consistency models will be applied to every sensed data for evaluating the quality. Results will be helpful for application scientist in evaluating the consistency and dependability on the data.
[6]
[7]
VI.
CONCLUSION
We present an embedded system design of wireless sensor monitoring system for sensing and computation of global warming indicators. Four commercial sensors had been integrated with ARM processor to monitor and compute the level of existence of GHG parameters (like CO2, CO temperature and humidity) in atmosphere using information and communication technologies. Prototype operates for data gathering and data dissemination using five modes and preliminary test prove that the developed prototype is capable to monitor and compute CO2, CO temperature and humidity parameters in the deployed environment and has several advantages in term of low cost, flexibility, user friendliness and energy efficiency. Data is collected and can be applied at all levels of organization for creating awareness, performing scientific studies and to forecast re mediation policies by the authorities to individuals and organization in controlling global warming and GHG parameters. We define application specific consistency models for evaluating the data quality of the prototype. This is our initial step in building efficient embedded system for monitoring and computing GHG parameters. We expect this paper will raise the global warming problem to the community.
[8]
[9]
[10]
[11]
[12]
[13]
[14]
[15]
ACKNOWLEDGMENT
[16]
This work is carried out in information technology department of Aarupadai Veedu Institute of Technology, vinayaka Missions University. Authors wish to thank the management for providing the financial and equipment support in carrying out this project.
[17]
[18]
REFERENCES [1]
[2]
[3]
[4]
Guomine He, Xiaochan Wang, Guoxiang sun, ―Design of a Greenhouse Humiture Monitoring System based on Zigbee Wireless Sensor Networks,‖ 2010 IEEE International Conference on Geo informatics, pp.361-365, DOI:10.1109/FCST.2010.10. Othen Sidek, Muhammad Quayum Omard, Hashim Edin, Khairu Anuwarohamed Zain, Muhamad Azman Miskam, ―Preliminary Infrastructure Development for Greenhouse accounting of Malaysian Rain forest using wireless Sensor Networks,‖ European Journal of Scientific Research. 2009, Vol.33, pp. 249-260. Dae-Heon Park, Boem-Jin Kang, Kyung-Ryong Cho, Chang-Sun Shin, Sung-Eon Cho, Jang-Woo Park and Won-Moyang, ―A Study on Greenhouse Automatic Control System Based on Wireless Sensor Networks,‖ Springer-Wireless Personal Communications. Dec 2009, Vol.56, No.1, pp. 117-130, DOI: 10.1007/S11277-009-9881-2. Andrzej pawlowski, jose Luis Guzman, Francisco Rodriguez, Manuel Berenguel, Jose Sanchez, Scbastian Dormido, ―Simulation of Greenhouse Climate Monitoring and control with Wireless Sensor
[19]
[20] [21] [22]
[23]
[24]
181
Networks and Event-Based Control,‖ Sensor 2009, Vol.9, Issue1, pp.232-252, DOI: 10.3390/S90100232. L.S. Jayashree, V.K.Yamini, R. Manjupriya, ―A Communication Efficient Framework for Soil Monitoring,‖ International Journal of Computer Application, 2010, Vol. 1, No. 16, article 6, PP. 16-23, DOI: 10.5120/348-528. Johg-Won Kwon, Young-Man Park, Sang-Jun Koo, Hiesik Kim, ―Design of Air Pollution Monitoring System uses ZigBee Network for Ubiquitous City,‖ 2007 IEEE International Conference on Convergence information Technology, pp. 1024-1031, DOI:10.1109/ICCIT.2007.3 61. Li Li, Haixia Liu, Hui Liu, ―Greenhouse Environment Monitoring System Based on Wireless Sensor Network,‖ Transactions of the Chinese Society for Agricultural Machinery, September 2009, vol. 40, pp. 228-231. Jiwoong Lee, Hochul Lee, Jeonghwar Hwang, Youngyun Cho, Changsun Shin, Hyun Yoe, ―Design and Implementation of wireless Sensor Networks Based Paprika Green House System,‖ Communications in Computer and Information Science. 2010. Vol.78, pp.638-646, DOI: 10.1007/978-3-642-16444-6-80. Digi International, XBee-PRO RF Module –IEEE 802.15.4 RF Modules. Miinnetonka, MN: Digi International Inc, 2009.Young, The Technical Writers Handbook. Mill Valley, CA: University Science, 1989. Xingy Xiong, Qili, Junkui Zhang, ―Study of Specializing Social Statistical Data for Carbon Management,‖ 2010 IEEE International Conference on Geo Informatics, PP.4, DOI:10.1109/Geo informatics.2010.5567576. Shantanu Pal, ―Wind Energy–An Innovative Solution to Global Warming,‖ 2009 IEEE International Conference on the Development of Renewable Energy Technology‖, pp 1-3. IPCC, Summary for Pikuetnajeral of Climate Change 2007: The Physical Science Basis, Contribution of Work Group 1 to the Fourth Assessment Report of the Intergovernmental Panel on Climate Chang, Cambridge University Press, 2007. Cop15, Summary of the 2009 Copenhagen Climate Change Conference Synthesis Report: ―Climate change, Global Risks, Challenges and Decisions,‖ University of Copenhagen, Denmark, 2009. Kelly, T. Adolph M, ―ITU-T initiatives on Climate Change,‖ 2008 IEEE Communications Magazine, Vol.46, Issue 10, PP.108, DOI: 10.1109/MCOM.2008.4644127. http://www.greenlivingpedia.org/Carbon_dioxide_ppm_levels_and_targ ets. Weihong Wang Shuntain Coa, ―Application Research on Remote Intelligent monitoring System of Greenhouse based Based on ZIGBEE WSN,‖ 2009 IEEE International Conference on Image and Signal Processing,‖pp.1-5, DOI: 10.1109/CISP.2009-5304535. Jang Xiaolin, Miao Yu, Gu Xuemai, Zhou Yang, ―Wireless Communications Network Design Based on the LPC2138,‖ 2010 IEEE International Conference on Communication and Mobile Computing, PP.171-174, DOI: 10.1109/CMC2010.178. Daniel Goldsmith, Fotis Liarokapis, Garry Malone, John Kemp, ― Augmented Reality Environmental Monitoring Using Wireless Sensor Networks,‖ 2008 International Conference Information Visualization, PP.539-544, DOI: 10.1109/IV.2008.72. Yussoff, Y. Abidin, H.Z. Rahman, R.A. Yahaya, F.H, ―Development of a PIC-based wireless sensor node utilizing XBee technology,‖ 2010 International Conference on Information Management and Engineering, pp.116, DOI: 10.1109/ICIME.2010.5477666. Specification Document of MG811, MQ7, LM35, SY-SH-220. United Nations Framework Convention on Climate Change (UNFCCC). The Kyoto Protocol to the Convention on Climate Change, 1998. United Nations Framework Convention on Climate Change (UNFCCC). Clean Development Mechanism, Project Design Document form (CDMPDD), Version 02, July 2004. Inter government Panel on Climate Change (IPCC). Revised 1996 IPCC Guidelines for National Greenhouse Gas Inventories Reporting Instructions, 1997. Inter government Panel on Climate Change (IPCC). Third Assessment Report ―Climate Change 2001‖ and the synthesis report.
WCSIT 1 (5), 177 -183, 2011 [25] World Resource Institute (WRI) and World Business Council for Sustainable Development (WBCSD), 2005, the GHG Protocol for Project Accounting. [26] ISO 14064:1997, Environment Management – Life cycle assessment – Principles and framework. [27] ISO 14064-1: 2006, Greenhouse gases – Part 1: Specification with guidance at the organization at the organization level for quantification and reporting of greenhouse gas emissions and removals. [28] ISO 14064-1: 2006, Greenhouse gases – Part 2: Specification with guidance at the project level for quantification, monitoring and reporting of greenhouse gas emission reduction or removal enhancements. [29] ISO 14064-1: 2006, Greenhouse gases – Part 3: Specification with guidance for the validation and verification of greenhouse gas assertions. [30] ISO 14065: Greenhouse gases – Requirements for greenhouse gas validation and verification bodies for use in accrediation or other forms of recognition. [31] ISO 19011:2002, Guidelines for quality and environmental management systems auditing. [32] Xuemei Li, Yuyan Deng, Lixing Ding, ―Study on precision agriculture monitoring framework based on WSN. Proceedings of the 2nd International Conference on Anticounterfeiting, Security and dentification,‖ pp. 183-185, DOI: 10.1109/IWASID.2008.4688381. [33] Xiuhong Li, Zhongfu Sun, Tianshu Huang, Keming Du, Qian Wang, Yingchun Wan, ―Embedded wireless network control system: an application of remote monitoring system for greenhouse environment, ‖ Proceedings of the Multi-conference on Computation Engineering Systems Applications, IMACS, Oct 2006, PP.1719-1722, DOI: 10.1109/CESA.2006.4281914. [34] Kewei sha,weisong Shi, ―Consistency driven data quality management of networked sensor systems,‖ Journal of Parallel and distributed computing, September 2008, volume 68, issue 9, pp. 1207-1221, DOI: 10.1016/jpdc.2008.06.004.
Figure 3. The Change in CO Concentration as Function of Time
APPENDICES The results collected verified the fact that the rise in concentration of GHG in atmosphere increases temperature. Here we provide sample data and plotted graphs of the prototype system. TABLE II.
Figure 4. The Change in Temperature as Function of Time
SYSTEM PROTOTYPE SAMPLE DATA Environmental GHG Parameters
S.no
Time
CO2 (PPM)
CO (PPM)
Tem (degree Celsius)
Humidity %
1,
14.00
310
90
31
50
2.
14.15
330
80
31.5
30
3
14.30
300
100
29
60
….
….
….
….
….
…. Figure 5. The Change in Humidity as Function of Time
AUTHORS PROFILE R. Jaichandran received the B.Tech degree in Information Technology from university of madras in 2004, Masters degree in Computer Science and Engineering from Anna University in 2006 . He is a Assistant Professor and Working towards his PhD at the Department of Information Technology, Aarupadai Veedu Institute of Technology, Vinayaka Missions University; previously worked as research scholar in Indian Institute of Technology, New Delhi. His current research interest includes wireless and sensor networks, ICT for Green Environments, pervasive computing and Formal
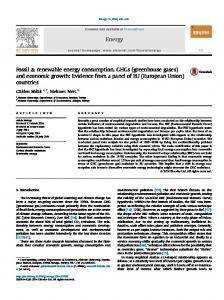
Figure 2. The Change in CO2 Concentration as Function of Time
182
WCSIT 1 (5), 177 -183, 2011 methods in software safety security and dependability. He has published many research papers in National and International Conferences, Journals in his area of research and got best paper award in NCMPC '09, sponsored by TQIP, MHRD, New Delhi. He serve as member in the organizing committee of IEEE computer society National Conference on Information and Software Engineering. He is a member of Indian Society of Technical Education (ISTE), Computer Society of India (CSI), Association of Computer Electronics and Electrical Engineers (ACEEE) and International Association of Engineers (IAENG).
A. Anthony Irudhayaraj received his Masters degree in Computer Science and Engineering and PhD from Anna University. He is currently serving as Dean in the Department of Information Technology, Aarupadai Veedu Institute of Technology, Vinayaka Missions University; previously worked as professor and head of Computer Science and Engineering department in Hindustan and SRM University. His current research interest includes wireless and sensor networks, ICT for Green Environments, Information Engineering, software safety security and dependability. He has published many research papers in National, International Conferences and Journals. He serves as reviewer and member in the editorial board of National Journal on Computer Science and Technology. He serves as Program Chair for IEEE computer society National Conference on Information and Software Engineering. He is a member and Advisor of IEEE Computer Society Branch Chapter.
183