WSEAS TRANSACTIONS on BIOLOGY and BIOMEDICINE
Gilberto Gonzalez, LucasJodar, RafaelVillanueva, FransiscoSantonja
Random modeling of population dynamics with uncertainty Gilberto Gonz´alez1,2 ,Lucas J´odar2 , Rafael Villanueva2 , Fransisco Santonja2 1 Departamento de C´ alculo, Universidad de los Andes, M´erida, Venezuela 2 Instituto de Matem´ atica Multidisciplinar, Universidad Polit´ecnica de Valencia, Valencia,Spain
[email protected] Abstract: Obesity is growing at an important rate in developed and developing countries and it is becoming a serious disease not only from the individual health point of view but also from the public socioeconomic one. In this paper it is studied the effect of uncertainty in the dynamics behavior of the overweight and obesity childhood populations. Since initial conditions and parameters appearing in a deterministic mathematical model of obesity population are subject to some degree of uncertainty, randomness in the differential equations are introduced in the initial conditions and in the most relevant parameter of the deterministic model. Additionally, in this work stochastic and random ordinary differential equations were used to study the randomness effect in the deterministic mathematical model of obesity population. Monte Carlo simulations are performed assuming different distributions for the initial conditions and parameters of the model. Furthermore, confidence intervals and expected solutions of the random models are also obtained. To verify the consistence of the method, results are compared against numerical solutions of the deterministic mathematical model. Key–Words: Random differential equation, Population dynamics, Numerical simulation, Stochastic differential equation, Monte Carlo method.
1 Introduction
certainty, [28]. The first one, namely stochastic differential equations, considers uncertainty that enters into equations through the differential of Brownian motion, also known as white noise. These forms required the Itˆ o calculus and particulary the notion of the Itˆ o integral [28, 33]. On the other hand, differential equations involving another kind of randomness which is studied by mean of mean square RiemanStieltjes integration are denominated random differential equations. Mean square calculus is the main tool for dealing with random differential equations [21, 38, 37]. These kinds of equations allow consideration of a wide variety of uncertainty on the differential models. For instance in [36] a work to study the dynamic behavior of tree diameter using a stochastic differential equation has been presented. In our work both fields for studying differential equations involving uncertainty are considered. During the last two decades there has been intensive research in the development of analytical and numerical solutions for stochastic differential equations, [19, 7, 28, 15, 33]. Analytical treatment of random differential equations has been done by [38, 37]. Numerical methods to solve numerically first order random differential equations and sufficient conditions for the mean square convergence of such methods with its order of convergence have been presented in [12, 13, 14]. There are several works that study the impact
Mathematical models dealing with uncertainty in differential equations have been considered in the recent decades in a wide variety of applied areas, such as physics, chemistry, biology, economics, sociology and medicine. Uncertainty can be considered in differential equations in different forms. The simplest class is one where only the initial conditions are random. This class has its origin in statistical physics and kinetic theory, [37]. A second class of differential equations with uncertainty is characterized by the presence of a random input term or source term. Langevin’s investigation in 1908 of the motion of a particle executing Brownian motion perhaps started the study of differential equations of this kind, [28, 37]. Finally a third class is when the uncertainty enters into the differential equation through its coefficients. In this paper uncertainty of first and third class are considered in the differential equations. The study of equations of this type has become a subject of intensive research. Problems that can be modeled by these kinds of equations are wave propagations in homogeneous media, systems and structures with parametric excitations, dynamics of imperfectly known systems in physics, medicine, biology, [35, 27, 17, 38]. In the available literature there are two research fields for studying differential equations involving unISSN: 1109-9518
34
Issue 2, Volume 5, February 2008
WSEAS TRANSACTIONS on BIOLOGY and BIOMEDICINE
Gilberto Gonzalez, LucasJodar, RafaelVillanueva, FransiscoSantonja
of parameter distributions on the disease populations models. For instance in [29] the effects of including more realistic distributions of the infectious period within SIR (susceptible/infectious/recovered) models are studied. One work where a epidemic model is studied using Monte Carlo method is [1], they use Monte Carlo results and compared against exact steady-state solutions. Additionally, in [27] a interesting simple SI (susceptible-infected) epidemic model with random initial conditions and a distribution that describes the proportion of susceptibles at any time during an epidemic has been presented. Nevertheless, since in our work the epidemic model is more complex and several distributions are introduced, theoretical distributions for different subpopulations can not be obtained. Other complex numerical methods that can be applied to this kind of problems are [12, 13, 14], where the obtention of numerical solutions may be computationally expensive. A classical technique for modeling the behavior of infectious diseases in the population is by means of systems of ordinary differential equations, where the variables represent different classes or subpopulations. These models are also known as compartment models and have been applied in different areas such as pharmacokinetics, epidemic models, social systems and others [4, 32, 3]. Recently, epidemiologists have tried to refine the use of computer simulations to help public policy decision-makers understand the real world dynamics of epidemic transmission and to assess the potential efficacy of various public health policies. One of the epidemiologist’s most basic tasks is estimation of disease occurrence and compartmental modeling is an excellent tool to achieve this task. However lately other methods such Cellular Automata models have been used to study epidemic models, social systems and pharmacokinetics [23]. In this work randomness is introduced in the compartmental deterministic mathematical model presented in [25], which was used to study qualitative and quantitative behavior of overweight and obesity in childhood population. In this compartmental mathematical model obesity is considered like a health concern of social environment transmission [18, 11]. It is important to remark that obesity is growing at an important rate in developed and developing countries and it is becoming a serious disease not only from the individual health point of view but also from the public socioeconomic one [24]. Moreover several studies correlate infant and adult obesity at the point that infant obesity is a powerful predictor of adult age obesity [16]. Additionally, several studies also find association between obesity and fatal diseases such as diabetes, heart attacks, blindness, renal failures and nonfatal related diseases such as respiratory difficulISSN: 1109-9518
ties, arthritis, infertility and psychological disorders. Therefore based on all the aforementioned facts is of paramount importance to construct models to study and prevent obesity from children, s early years. It is important to remark that a huge amount of studies related to obesity have been presented, but very few use mathematical models to study dynamics behaviors of obesity populations. The introduction of randomness in the aforementioned deterministic model is justified by the fact that it is realistic to assume that some of the parameters and initial conditions have some degree of uncertainty. Therefore random ordinary differential equation models are constructed in order to obtain different possible dynamics of the populations. In this way one aim of this work is to model and to obtain future behavior of the childhood obesity. However the model also helps to understand the mechanisms of the worldwide obesity epidemic. These mathematical models, simpler than the reality, allow to understand the global dynamical behavior of the obesity in the population and to establish sustainable public health programs for the prevention of the childhood obesity. The real world is much more complex than anything that can be created with arithmetic and logical operations [31, p.341]. Therefore it is necessary to use methods that include some real world complexity. The versatility of Monte Carlo simulation modeling allows us to include more complexity to the deterministic mathematical model, and thus study the impact of randomness in the dependent variables. Following this way Monte Carlo method is a powerful method for assess the impact of uncertainties due to the model inputs [30]. Random effects can be studied using Monte Carlo simulations and different distributions can be incorporated in ordinary differential equations models. Several works have been used Monte Carlo method in different areas [34]. Monte Carlo method is used here with the aim of obtain qualitative and quantitative behavior of the numerical solutions of the random differential equation models. Monte Carlo simulation differs from traditional simulation in that the model parameters are treated as random variables, rather than as fixed values. Therefore, confidence intervals and expectation for the different populations dynamics can be obtained through Monte Carlo simulations. Based on the confidence intervals the possible dynamics of obesity population can be observed for the next few years. It is worth here to point out the difficulties to obtain confident data and the importance of introducing randomness in the uncertain parameters of the model. For instance, in the Spanish region of Valencia, a health survey is done every 5 years and data should be prepared, processed and stored in databases before their 35
Issue 2, Volume 5, February 2008
WSEAS TRANSACTIONS on BIOLOGY and BIOMEDICINE
Gilberto Gonzalez, LucasJodar, RafaelVillanueva, FransiscoSantonja
availability. Moreover surveys are exposed to human errors and their costs are very high. The paper is organized as follows. In Section 2 the deterministic mathematical model of obesity population is presented. Section 3 is devoted to present the random modeling approaches. Section 4 is addressed to Monte Carlo numerical simulation results. Finally, Section 5 is devoted to a short discussion and conclusions.
2
Table 1: Description of the parameters used in the compartmental mathematical model (1)
µ β γS ε α ϕ σ δ γD
The mathematical model
In [25] a compartmental deterministic mathematical model to study the dynamics of overweight and obesity in childhood population was introduced. In this model childhood population was divided in six classes or subpopulations, children with normal weight, latent children (children with unhealthy habits but who are still normal weight), overweight children, obese children, overweight children on diet and obese children on diet. The model was normalized for the sake of clarity and since qualitative behavior of the different classes are more easily observed using proportions. In this model the following proportions are defined:
Rate description Inflow rate to the system population. Transmission rate to unhealthy habits. Overweight children becomes an obese. Overweight children on diet becomes a normal weight. Overweight children transit to healthy habits(diet). Overweight children on diet relapse to unhealthy habits. Obese children transit to healthy habits(diet). Obese children on diet relapse to unhealthy habits. Obese on diet becomes an overweight on diet.
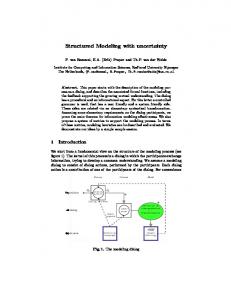
where the description of the time-invariant parameters of the model (1) are presented in Table 1. The values of the parameters of the model (1) are presented in Table 2 and the initial conditions in Table 3. The model (1)is represented graphically in Fig. 1.
• N (t) denotes the proportion of normal weight children. • L (t) the proportion of latent individuals. • S (t) the proportion of children with overweight. • O (t) the proportion of obese children. Figure 1: Diagram of the mathematical model for obesity population dynamics as defined in system (1). The boxes represent the subpopulations and the arrows represent the transitions between the subpopulations, labeled by the parameters of the model.
• DS (t) the proportion of overweight children on diet(through their parents). • DO (t) the proportion of obese children on diet(through their parents). Therefore one gets, N (t) + L(t) + S(t) + O(t) + DS (t) + DO (t) = 1.
µ γS α σ γD
The compartmental deterministic mathematical model can be represented analytically by the following nonlinear system of ordinary differential equations, N˙ (t) = µ + εDS (t) − µN (t) − βN (t)[L(t) + S(t) + O(t)], L˙ (t) = βN (t)[L(t) + S(t) + O(t)] − [µ + γL ]L(t), S˙ (t) = γL L(t) + ϕDS (t) − [µ + γS + α]S(t), O˙ (t) = γS S(t) + δDO (t) − [µ + σ]O(t),
γL ε ϕ δ β
Value 0.0089 2.776 8 × 10⁻³ 0.12735 0.15974 0.0222949
Table 2: Parameters of the model (1).
(1)
D˙S (t) = γD DO (t) + αS(t) − [µ + ε + ϕ]DS (t), D˙O (t) = σO(t) − [µ + γD + δ]DO (t). ISSN: 1109-9518
Value 0.0064 0.003085 4.068 × 10⁻³ 4.4379 × 10⁻³ 4.5045 × 10⁻⁴
A linear stability analysis of system (1) is developed here in order to check numerically dynamic 36
Issue 2, Volume 5, February 2008
WSEAS TRANSACTIONS on BIOLOGY and BIOMEDICINE
Subpopulation N (t) L(t) S(t) O(t) DS (t) DO (t)
Gilberto Gonzalez, LucasJodar, RafaelVillanueva, FransiscoSantonja
Initial condition 0.462 0.194 0.2176 0.09 0.0249 0.0115
Eigenvalue λ1 λ2 λ3 λ4 λ5 λ6
Table 3: Initial conditions for t = 0(1999 yr.) corresponding to proportions of the subpopulations respect to the total population.
consistency between the deterministic mathematical model and the random models, this analysis is performed using the parameter values showed in Table 2. It is well known that an equilibrium point is a locally asymptotically stable node if and only if the real part of the eigenvalues of the Jacobian associated system evaluated at the equilibrium points are negative. The system (1) has two steady states; a trivial steady state called obesity free equilibrium (OFE) and a nontrivial steady state called obesity endemic equilibrium (OEE). For the particular set of parameters values presented in Table 2 for system (1), the obtained equilibrium points are showed in Table 4.
At OFE point -0.170976 -0.140644 -0.0151898 0.0134083 -0.00921949 -0.00641026
At the OEE point -0.170977 -0.140622 -0.0143034 + 0.00134272i -0.0143034-0.00134272i -0.00909934 -0.00641026
Table 5: The eigenvalues of the Jacobian of system (1) evaluated at the OFE point and at the OEE point.
Equilibrium Numerical value OFE (1, 0, 0, 0, 0, 0) OEE (0.293, 0.2971, 0.270, 0.126, 0.008, 0.003)
0.7
0.6
Table 4: The equilibrium points for the deterministic mathematical model (1). Proportions
0.5
The eigenvalues of the Jacobian evaluated at the OFE point and at the positive OEE point are showed in Table 5. The OFE point is unstable, since the eigenvalue λ4 is positive. On the other hand the OEE point is locally asymptotically stable, due to the fact that all real parts of the eigenvalues of the Jacobian of system (1) evaluated at the OEE point are negative. The graphical behavior of normal weight, overweight and obese subpopulations using the parameter values showed in Table 2 are depicted in Figure 2. It can be seen an increasing trend of obese and overweight populations.
3
Normal weight population Overweight population Obese population
0.4
0.3
0.2
0.1
0
0
1999
100
200
300
400
500
Weeks
2010
Figure 2: Evolution of the normal weight, overweight and obese subpopulations of 3 − 5 years old children in the region of Valencia, Spain for the period 1999 − 2010.
Random modeling
A random modeling approach can be used to include the possibility that the initial conditions and parameters are not fixed as assumed in the deterministic model. The introduction of randomness in the deterministic model (1) is justified by the fact that it is more ISSN: 1109-9518
600
37
Issue 2, Volume 5, February 2008
WSEAS TRANSACTIONS on BIOLOGY and BIOMEDICINE
Gilberto Gonzalez, LucasJodar, RafaelVillanueva, FransiscoSantonja
realistic to assume that some of the parameters and initial conditions have some degree of uncertainty. In fact the initial condition for the latent class rely on the results of a health survey about style of life of individuals. Therefore, since the initial condition for the latent class is expected to have some uncertainty a probability distribution function for the initial latent subpopulation is assumed in this work. Hence, a random ordinary differential equation model arise to study the dynamics of the subpopulations when probability distribution function is used for an initial condition. Notice that this approach can be applied to a very wide class of differential equations models in other areas. On the other hand, in [25] a sensitivity analysis of the deterministic mathematical model (1) reveals that the transmission rate parameter β affects clearly its dynamics. Since, this parameter may be affected by complex relationships between survey data and model fitting, a probability distribution function for the parameter β is also assumed. Therefore, a random differential equation related to the transmission rate parameter β arise. The social environment has fluctuations over the time due to factors as advertising, educative campaigns and this affects the social pressure to acquire unhealthy habits. Therefore, a stochastic model is introduced adding Gaussian white noise to the transmission parameter β. The aim of the introduction of this model is to analyze the effects of random fluctuations over the time in the parameter β and how this affect the dynamics of the overweight and obese children population. The constructed model is a stochastic ordinary differential equation system (SODEs). Since an explicit solution is not known for this SODEs, in this paper the Euler-Maruyama method is used to obtain pathwise approximations of the stochastic process [28]. With these models, it is aimed to obtain future behavior of the childhood obesity and to help to understand the mechanisms of the worldwide obesity epidemic. It is important to remark that in order to obtain numerical solutions of the random and stochastic models, the Monte Carlo method is used. Next subsections present in more details the random and stochastic differential equation models.
tical analysis of the data, in this work it is assumed an uniform and a normal distribution. However since a random number generated form a normal distribution function takes a wide range of negative and positive values, careful attention must be paid in order to avoid unreal negative and positive values for the latent and normal weight classes initial condition. In this paper two particular distribution are assumed for the parameter β in order to study the dynamics of the random model. This approach allows to analyze the impact of uncertainties in the transmission rate parameter β on the dynamics of the subpopulations. As in the random initial condition case, an uniform and a normal distribution are assumed. Since in our work the random model is composed by a nonlinear system of six differential equations, the theoretical distribution of the time varying solution can not obtained as in [27]. Additionally, other complex numerical methods that can be applied to this kind of problems are [12, 13], but the obtention these numerical solutions are computationally expensive. Therefore, numerical solutions are obtained using Monte Carlo method in conjunction with RungeKutta type methods. These numerical results are presented in Section 4.
3.2
In this model it is assumed that the parameter β is time varying. In real life is difficult to estimate the transmission rate to unhealthy habits (β) since this parameter is affected by many complicated events. Therefore, in this model small time varying random perturbations of the transmission rate parameter β are included. Here it is assumed that this random fluctuations can be modeled adding Gaussian white noise to the parameter β. This time varying random perturbations could be a major driving force for dynamical transitions of the mathematical model. Stochasticity in the model is introduced when the transmission rate parameter β is perturbated. Parameter perturbation is a well known standard technique in stochastic modeling. The constructed model is a stochastic ordinary differential equation system (SODEs) and since an explicit solution is not known for this SODEs, the Euler-Maruyama method is used to obtain pathwise approximations of the stochastic process [8, 28]. Confidence intervals for the discrete solution are constructed through Monte Carlo simulations. Based on the confidence intervals the possible dynamics of obesity population can be observed for the next few years. When the Gaussian white noise is introduced the following stochastic differential system of Itˆ o type
3.1 Random differential equation It is expected that the initial condition have some amount of uncertainty. Therefore, initial condition for the latent class or subpopulation in the model (1) may take different values around the fixed value assumed in the deterministic mathematical model. Several probability distribution functions can be used for the initial condition in the latent class. Based in statisISSN: 1109-9518
Stochastic differential equation
38
Issue 2, Volume 5, February 2008
WSEAS TRANSACTIONS on BIOLOGY and BIOMEDICINE
Gilberto Gonzalez, LucasJodar, RafaelVillanueva, FransiscoSantonja
form is obtained, dX(t) = f (t, X(t))dt + g(t, X(t))dW (t), X(t0 ) = X0 , t ∈ [t0 , tf ],
(2)
where X(t) = (N (t), L(t), S(t), O(t), DS (t), DO (t))T and the solution {X(t), t ∈ [t0 , tf ]} is an Itˆ o process, f is the continuous deterministic component or drift coefficient, g is the continuous random component or diffusion coefficient [28], which are defined on f : Rd × [0, +∞) −→ Rd and g : Rd × [0, +∞) −→ Rd×m . Thus f is an d-vector valued function, g is an d × m matrix-valued function and W (t) is a m-dimensional stochastic process having scalar Wiener process components with increments 4Wj (t) = Wj (t + 4t) − Wj (t), j = 1, ..., m, which are independent Gaussian random variables N (0, 4t) [8]. For our particular case, m = 1 and d = 6. Thus, if we consider the deterministic model (1) with random perturbation on the parameter β of the form β = β + θdW (t), where θ ∈ R and W (t) is a standard Wiener process. Thus, the following stochastic differential system is obtained ¡ ¢ dN (t) = µ + εDS (t) − µN (t) − βN (t)[L(t) + S(t) + O(t)] dt
where Xn = (Xn1 , Xn2 , Xn3 , Xn4 , Xn5 , Xn6 )T = n )T is the numerical solu(N n , Ln , S n , On , DSn , DO tion of system (3) at time tn , 4tn = tn+1 − tn and 4Wn =Wn+1 − Wn =W (tn+1 ) − W (tn ), n = 0, 1, 2, ..., N. The noise increments 4Wn are N (0, 4tn ) distributed independent random variables which can be generated numerically by pseudorandom number generators. The Euler-Maruyama method has strong order of accuracy γ = 0.5, is numerically stable and converges to the Itˆ o solution of system (3), [28]. For the system (3), the function f (tn , Xn ) is 1 f (tn , Xn ) f 2 (tn , Xn ) 3 f (tn , Xn ) f (tn , Xn ) = 4 f 5 (tn , Xn ) f (tn , Xn ) f 6 (tn , Xn ) µ + εDSn − µN n − βN n [Ln + S n + On ] βN n [Ln + S n + On ] − [µ + γL ]Ln γL Ln + ϕDSn − [µ + γS + α]S n = n n n γ S + δD − [µ + σ]O S O n γD DO + αS n − [µ + ε + ϕ]DSn n σOn − [µ + γD + δ]DO
and the function g(tn , Xn ) for the system (3) is given by
− θN (t)[L(t) + S(t) + O(t)]dW t, ¡ ¢ dL(t) = βN (t)[L(t) + S(t) + O(t)] − [µ + γL ]L(t) dt
−θN n [Ln + S n + On ] 4 Wn θN n [Ln + S n + On ] 4 Wn 0 , g(tn , Xn ) = 0 0 0
+ θN (t)[L(t) + S(t) + O(t)]dW (t), dS(t) = γL L(t) + ϕDS (t) − [µ + γS + α]S(t),
(3)
dO(t) = γS S(t) + δDO (t) − [µ + σ]O(t), dDS (t) = γD DO (t) + αS(t) − [µ + ε + ϕ]DS (t), dDO (t) = σO(t) − [µ + γD + δ]DO (t).
with initial data (N © (0), L(0), S(0), O(0), DS6(0), DO (0)) ∈ (x1 , x2 , x3 , x4 , x5 , x6 ) ∈ R+ such that, ª x1 + x2 + x3 + x4 + x5 + x6 = 1 . Now, it is showed how to solve numerically SODEs (3).
n are approximations where N n , Ln , S n , On , DSn , DO of N (n 4 tn ), L(n 4 tn ), S(n 4 tn ), O(n 4 tn ), DS (n 4 √ tn ), DO (n 4 tn ) for n = 0, 1, 2, ..., and 4Wn = 4tn η n , with η n the nth realization of the Gaussian random variable N (0, 1) [9]. Numerical solutions for the stochastic differential equation system (3) are computed using the Euler-Maruyama stochastic numerical scheme presented here.
Stochastic numerical scheme Lets consider the Euler-Maruyama stochastic numerical scheme [28, 22] applied to the stochastic differential system (3). Considering the Itˆ o SODEs (3) on [t0 , T ], for a given discretization 0 ≤ t0 < t1 < · · · < tn < · · · < tN = T the kth (k = 1, 2, 3, 4, 5, 6) component of the multidimensional Euler-Maruyama scheme is given by k Xn+1
=
Xnk
k
4
In this section Monte Carlo simulations are performed using four type of models: • Randomness in the initial condition of the latent class.
k
+ f (tn , Xn ) 4 tn + g (tn , Xn ) 4 Wn ,
0 T (X01 , X02 , X03 , X04 , X05 , X06 )T = (N 0 , L0 , S 0 , O 0 , DS0 , DO ) ,
ISSN: 1109-9518
Monte Carlo simulations and numerical results
• Randomness in the transmission parameter β. 39
Issue 2, Volume 5, February 2008
WSEAS TRANSACTIONS on BIOLOGY and BIOMEDICINE
Gilberto Gonzalez, LucasJodar, RafaelVillanueva, FransiscoSantonja
• Randomness in the initial condition and the transmission rate parameter β together.
In all the numerical experiments 200 runs were performed in order to obtain significative values for the expected behaviors of the subpopulations. It is important to remark that in all cases Monte Carlo method is applied to construct confidence intervals for different classes or subpopulations over the whole simulation time. The models are simulated in the period 1999 − 2010 (572 weeks) and 95% confidence interval are obtained. Next subsections show the numerical results for the four aforementioned models.
1
0.5
0.8
0.4
0.6 0.4 0.2
0
200 400 600 Time (Weeks)
0.1
800
200 400 600 Time (Weeks)
800
200 400 600 Time (Weeks)
800
0.12 Obese
Overweight
Graphical results of Monte Carlo simulations for model (1) using a uniform distribution for the initial conditions of the latent subpopulation are showed in Fig. 3. It is important to remark that since the in this the total population model has been normalized to unity, one gets
0
0.13
0.35 0.3 0.25
Random initial condition
0.3 0.2
0.4
0.2
4.1
Latent
Normal weight
• Random perturbations in the transmission parameter β using Gaussian white noise.
0.11 0.1 0.09
0
200 400 600 Time (Weeks)
0.08
800
0
Figure 3: Expected value and 95% confidence interval for the different subpopulations when the initial conditions for the latent individuals in the model (1) take different values from a uniform distribution U (0.1, 0.3).
N (t) + L(t) + S(t) + O(t) + DS (t) + DO (t) = 1, and since the following equation is assumed certain, N (0) + L(0) = 0.656
1
0.6
0.8
0.4 Latent
Normal weight
, the initial value of the latent subpopulation fix implicitly the value of the normal weight subpopulation. The graphical dynamics of the subpopulations, when a normal distribution for the initial conditions of the latent subpopulation is used is depicted in Fig. 4. Notice that despite of using different distributions for the initial condition of the latent subpopulation, asymptotic behavior do not differ from the deterministic model. It is important to remark that dealing with distributions like the normal for instance, careful attention must be paid in order to avoid unreal negative values for the latent and normal initial subpopulations.
0.6 0.4 0.2
0.2 0
0
200 400 600 Time (Weeks)
−0.2
800
0.3
0
200 400 600 Time (Weeks)
800
0
200 400 600 Time (Weeks)
800
0.13
Obese
Overweight
0.12 0.25
0.2
0.11 0.1 0.09
4.2
Randomness on the transmission rate β
0
Graphical results of Monte Carlo simulations of model (1) using a uniform distribution for the transmission rate parameter β are showed in Figs. 5 and 6. As it can be observed the increasing trend of overweight and obese population is maintained, nevertheless when the dispersion of the uniform distribution is increased the predictions lost accuracy. This last fact is of paramount importance since can be translated in that asymptotic behavior of model (1) is strongly relying on the value of the transmission parameter β. ISSN: 1109-9518
200 400 600 Time (Weeks)
800
0.08
Figure 4: Expected value and 95% confidence interval for the different subpopulations when the initial conditions for the latent individuals in the model (1) take different values from a normal distribution with mean 0.194 and standard deviation 0.01.
40
Issue 2, Volume 5, February 2008
WSEAS TRANSACTIONS on BIOLOGY and BIOMEDICINE
0.3 0.25 0.5
0 0.13
0.28
0.12 Obese
0.3
0.26 0.24
0.09 0.08
600
0.3
0.2
0
200 400 Time (Weeks)
600
Figure 5: Expected value and 95% confidence interval for the different subpopulations when the transmission parameter β in the model (1) take different values from a uniform distribution (0.0210, 0.0234).
0
200 400 Time (Weeks)
600
0
200 400 Time (Weeks)
600
0
200 400 Time (Weeks)
600
0.16 0.14
0.3
0.25
0.2
0.25 0.2
0.35
0.1
0.2
200 400 Time (Weeks)
600
0.11
0.22 0
200 400 Time (Weeks)
0.3
0.4
Latent
600
0.35
Obese
200 400 Time (Weeks)
Overweight
0
Normal weight
0.2
0.12 0.1
0
200 400 Time (Weeks)
0.08
600
Figure 6: Expected value and 95% confidence interval for the different subpopulations when the transmission parameter β in the model (1) take different values from a uniform distribution (0.0200, 0.0244).
Asymptotic behavior using a normal distribution for the transmission rate parameter β are similar to the uniform cases as it can be observed in Fig. 7. However, as it can be observed in Fig. 8, when the standard deviation is increased immediately the confidence intervals for the subpopulations dynamics increase, giving more uncertainty to the future predictions.
4.3 Random effects in the initial conditions and social transmission rate β mixed
Normal weight
0.5
In this subsection some Monte Carlo simulations are performed in order to observe the impact of uncertainties in the initial condition for the latent subpopulation and in the social transmission rate β. Since in the previous sections these effects have been studied separately, our aim here is to observe the dynamics changes putting together random effects in two relevant inputs of the model. In Fig. 9 it can be seen that dynamics using uniform distributions maintain similar behavior to the deterministic model. On the other hand, when normal distributions are employed 95% confidence intervals becomes more wider and predictions need to be taken carefully, as it can be observed in Fig. 10.
0.35 0.3
0.4
Latent
0.3
0.3
0.2
0.25 0.2
0
200 400 Time (Weeks)
600
0.35
0
200 400 Time (Weeks)
600
0
200 400 Time (Weeks)
600
0.13
Overweight
0.12 0.3
Obese
0.4
0.2
Overweight
0.35
Latent
Normal weight
0.5
Gilberto Gonzalez, LucasJodar, RafaelVillanueva, FransiscoSantonja
0.25
0.11 0.1 0.09
0.2
0
200 400 Time (Weeks)
600
0.08
Figure 7: Expected value and 95% confidence interval for the different subpopulations when the transmission parameter β in the model (1) take different values from a normal distribution with mean 0.0222949 and standard deviation 0.000001.
4.4 Stochastic numerical simulation through Monte Carlo method Numerical stochastic solutions of model (3) are obtained using the Euler-Maruyama stochastic scheme. In addition, confidence intervals for the stochastic ISSN: 1109-9518
41
Issue 2, Volume 5, February 2008
0.3
0.4
0.3
200 400 Time (Weeks)
600
0
200 400 Time (Weeks)
Obese 0
200 400 Time (Weeks)
0.08
600
0
200 400 Time (Weeks)
600
0
Latent
0.3 0.2
0
200 400 Time (Weeks)
0.1
600
0.35
0
200 400 Time (Weeks)
600
0
200 400 Time (Weeks)
600
0.16 0.14 Obese
0.3
0.25
0.12 0.1
0
200 400 Time (Weeks)
600
0.08
Figure 9: Expected value and 95% confidence interval for the different subpopulations when the initial conditions for the latent individuals in the model (1) take different values from a uniform distribution (0.1, 0.3) and the transmission parameter β in the model (1) take different values from a uniform distribution (0.0200, 0.0244).
ISSN: 1109-9518
−0.2
600
0.35
0.16
0.3
0.14
0
200 400 Time (Weeks)
600
0.25 0.2
0
200 400 Time (Weeks)
600
0.12 0.1
200 400 Time (Weeks)
600
0.08
solution at the end of the time interval are computed using the Monte Carlo simulations in conjunction with the Euler-Maruyama stochastic numerical scheme. Moreover Monte Carlo method is also applied to construct confidence intervals over the whole simulation time using statistics percentiles. Figure 11 shows the evolution of the 95% confidence interval and the expected overweight and obese populations considering random perturbations of 50% (θ = 0.01) of the transmission rate parameter β value, using the Monte Carlo method for period 1999 − 2010 (572 weeks). In Figure 12 it can be seen the evolution of the 95% confidence interval and the expected overweight and obese populations considering random perturbations of 100% (θ = 0.02) of the estimated value of the transmission rate parameter β. Notice that the confidence interval tends to stabilize near the overweight and obesity component of the endemic equilibrium point OEE as expected (see Section 2). In Tables 6 and 7, the mean value, standard deviation and 95% confidence interval for overweight and obese population for year 2010 using Monte Carlo method are showed. The mean values are almost equal for different ranges of perturbation, but the standard deviation has increases when the variability of the parameter β is increased. Additionally, confidence intervals for both overweight and obese populations are larger when the transmission rate β is perturbated ran-
0.4
0.4
200 400 Time (Weeks)
Figure 10: Expected value and 95% confidence interval for the different subpopulations when the initial conditions for the latent individuals in the model (1) take different values from a normal distribution with mean 0.194 and standard deviation 0.01, and the transmission parameter β in the model (1) take different values from a normal distribution with mean 0.0222949 and standard deviation 0.00001.
0.5
0.6
0.2 0
0 0.1
0.8 Normal weight
0.4
0.12
Figure 8: Expected value and 95% confidence interval for the different subpopulations when the transmission parameter β in the model (1) take different values from a normal distribution with mean 0.0222949 and standard deviation 0.00001.
Overweight
0.6
600
0.14
0.25
0.2
0.4
0.2
0.16
0.3
0.2
0.8
Obese
0
0.35
0.2
0.6
0.2
Overweight
0.2
Overweight
0.25
1
Latent
0.35
Latent
Normal weight
0.5
Gilberto Gonzalez, LucasJodar, RafaelVillanueva, FransiscoSantonja
Normal weight
WSEAS TRANSACTIONS on BIOLOGY and BIOMEDICINE
42
Issue 2, Volume 5, February 2008
WSEAS TRANSACTIONS on BIOLOGY and BIOMEDICINE
Gilberto Gonzalez, LucasJodar, RafaelVillanueva, FransiscoSantonja
domly in a large range as was expected. Table 6: Mean, standard deviation and 95% confidence intervals with θ = 0.01. 0.29
0.13
0.28
0.125 0.12
Obese proportion
0.27 Overweight proportion
Population Mean and Std. Monte Carlo C.I. Overweight (0,2714, 0,0035) (0.2645,0.2782) Obese (0,1259, 0,0011) (0.1236,0.1282)
0.26 0.25 0.24
0.115 0.11
Table 7: Mean, standard deviation and 95% confidence intervals with θ = 0.02.
0.105 0.1
Expected Percentile 97.5 Percentile 2.5
0.23 0.22 0.21
0
200 400 Time (Weeks)
Expected Percentile 97.5 Percentile 2.5
0.095 0.09 0.085
600
0
200 400 Time (Weeks)
Population Mean and Std. Monte Carlo C.I. Overweight (0,2715, 0,0070) (0.2584, 0.2846) Obese (0,1260, 0,0023) (0.1210, 0.1299) 600
5
Figure 11: Confidence interval and expected value with a time step ∆t = 0.1 when the transmission rate β is perturbated randomly in a range of 50%.
0.29
0.13
0.28
0.125
Obese proportion
Overweight proportion
In modeling, analyzing, and predicting behaviors of physical and natural phenomena, greater and greater emphasis has been placed upon probabilistic methods, [27, 6, 5, 10, 37]. This is due to the combination of complexity, uncertainty and ignorance which are present in the formulation of a great number of these problems. For example, geostatics aims at providing quantitative descriptions of natural variables such as pressure, temperature, a wind velocity in the atmosphere, concentrations of pollution in a contaminated site, and so forth. The variables exhibit an immense complexity of detail that precludes a description by a simplistic models, [10]. These facts make dealing with mathematical models where the uncertainty is considered more appropriate. The effect of introducing randomness in a deterministic mathematical model dynamics of obesity population has been observed by means of the well known Monte Carlo method. Furthermore, confidence intervals and expected solutions for the random models were obtained. The simulations carried out with these random models indicated that the increasing trend in the 3 − 5 years old overweight and obese populations showed by the deterministic model is still maintained despite the initial condition of normal weight and latent classes or subpopulations are random values taken from an uniform and normal distributions. This means that the long time behavior model predictions are still accurate if the initial conditions for the latent and normal subpopulations have discrepancies with the reality. The situation when the value of the transmission parameter β is a random variable taken from a uni-
0.12
0.27 0.26 0.25 0.24
0.115 0.11 0.105 0.1
Expected Percentile 97.5 Percentile 2.5
0.23 0.22 0.21
Expected Percentile 97.5 Percentile 2.5
0.095 0.09
0
200 400 Time (Weeks)
600
0.085
0
200 400 Time (Weeks)
600
Figure 12: Confidence interval and expected value with a time step ∆t = 0.1 when the parameter β is perturbated randomly in a range of 100%.
ISSN: 1109-9518
Conclusions
43
Issue 2, Volume 5, February 2008
WSEAS TRANSACTIONS on BIOLOGY and BIOMEDICINE
Gilberto Gonzalez, LucasJodar, RafaelVillanueva, FransiscoSantonja
form or normal distribution is quite different, since for this case dispersion in the assumed distributions can modify drastically the dynamics of the model. However, for small standard deviations of the distribution, the confidence intervals give meaningful information in regard to the dynamics of the subpopulations. Additionally, expected solutions of the random models are quite similar to the numerical solutions of the deterministic model, conserving in this way the same increasing trend in the overweight and obesity subpopulations. It is important to mention that Monte Carlo simulations give realistic values which are consistent with the results obtained for the deterministic mathematical model, specially in regard to the asymptotic behavior.
References: [1] O.E. Ai´ello, V.J. Haas, M.A.A. daSilva and A. Caliri, Solution of deterministic stochastic epidemic models by dynamical Monte Carlo method, Physica A: Statistical Mechanics and its Applications 282, 2000, pp. 546-558. [2] R.E. Andersen, The spread of the childhood obesity epidemic CMAJ, 11, 2000, pp. 163. [3] K.E. Biebler, Compartment models and the PEARSON system of distributions, WSEAS Transactions Mathematics, 4(3), July 2005, pp. 170-175. [4] F. Brauer, C. Castillo-Chavez, Mathematical Models in Population Biology and Epidemiology. Springer Verlag (2001).
On the other hand, when the transmission parameter β is perturbated the stochastic model indicate an increasing trend in the overweight and obese populations in the next few years as the corresponding deterministic model predicted. This increasing trend in obesity is still observed even when the transmission rate is perturbed in a range of 100%. As expected the length of the confidence intervals are proportional to the amplitude of the fluctuations of the transmission rate. Therefore, the variability of forecasts for the incidence of infant obesity in the next few years depends on the effect that social environment has over the parameter β. This fact is important since educative plans, advertising programs, and health programs can be designed to affect positively the social environment.
[5] C.A. Braumann, Variable effort fishing models in random enviroments, Math. Biosci, 156, 1999, pp. 1-19. [6] C.A. Braumann, Modeling population growth in random environments: Itˆ o or Stratonovich calculus?, Bull. Intl. Statistical Institute, LX CP1, 2003, pp. 119-120. [7] L. Brugnano, K. Burrage and P. M. Burrage, Adams-type methods for the numerical solution of stochastic ordinary differential equations, BIT Numerical Mathematics, 40(3) 2004, pp. 451470. [8] M. Carletti, K. Burrage, P.M. Burrage, Numerical simulation of stochastic ordinary differential equations in biomathematical modelling, Math. Comp. Simul. 64 (2004), pp. 271277.
Finally, the approaches applied in this paper can be applied in to a very wide class of differential equations models. These include mathematical models dealing with uncertainty in a wide variety of applied areas, such as physics, chemistry, biology, economics, sociology and medicine.
[9] M. Carletti, Numerical solution of stochastic differential problems in the biosciences, J. Comp. Appl. Math. 185 (2006) 422440. [10] J. Chils and P. Delfiner, Geostatistic. Modelling Spatial Uncertainty,John Wiley & Sons, London 1999.
Future directions of research in this area is to compare numerical results of Monte Carlo simulations and the results provided by numerical methods applied directly to the random differential equations. In this way, computational costs can be evaluated in order to see the convenience of applying one method or other to other real world applications where it is clear the necessity of using random differential equations.
[11] N.A. Christakis, J.H. Fowler, The spread of obesity in a large social network over 32 years. The New England Journal of Medicine 357 (2007) pp. 370-379. [12] J.C. Cort´es and L. J´odar and L. Villafuerte, Numerical solution of random differential equations: mean square approach, Math. Comput. Model., 45, 2007, pp. 757-765. [13] J.C. Cort´es and L. J´odar and L. Villafuerte, Mean square numerical solutions of random differential equations: Facts and possibilities,Computers and Mathematics with Applications, 53, 2007, pp. 1098-1106.
Acknowledgements We acknowledge the collaboration of the Servicio Valenciano de Endocrinolog´ıa y Nutrici´on de la Comunidad Valenciana and the Conseller´ıa de Sanidad de la Comunidad Valenciana. ISSN: 1109-9518
44
Issue 2, Volume 5, February 2008
WSEAS TRANSACTIONS on BIOLOGY and BIOMEDICINE
Gilberto Gonzalez, LucasJodar, RafaelVillanueva, FransiscoSantonja
[14] J.C. Cort´es and P. Sevilla-Peris and Lucas J´odar, Analytic numerical approximating process of diffusion equation with data uncertainty, Computers and Mathematics with Applications, 49 , 2005, pp. 1255-1266. [15] G. Denk and S. Schffler, Adams methods for the efficient solution of stochastic differential equations with additive noise, Computing,59(2), 1997,pp. 153-161. [16] W.H. Dietz, Childhood weight affects adult morbidity and mortality. The Journal of Nutrition 128 - 2 (1998) pp. 411-414. [17] E.V. Eijnden, Studying random differential equations as a tool for turbulent diffusion,Physical Review E, 53(5), 1998,pp. 229232. [18] A.M. Evangelista, A.R. Ortiz, K.R. Rios-Soto, A. Urdapilleta, USA the fast food nation: obesity as an epidemic [on line]. T-7, MS B284, Theoretical Division, Los Alamos National Laboratory, Los Alamos, NM 87545 (2004). [Accessed 5 February 2007]. [19] B.D. Ewald and R. Tmam, Numerical analysis of stochastic schemes in geophysics,SIAM Journal on Numerical Analysis, 42, 2005, pp. 22572276. [20] T.F. Filippova, On the generalized solutions for uncertain system with applications to optimal control and estimation problems, WSEAS Transactions on Systems, 4(5), May 2005, pp. 481486. [21] M. Grigoriu and T. Soong, Random Vibration of Mechanical and Structure Engineering,Prentice Hall, New Jersey, 1992. [22] D.J. Higham, An algorithmic introduction to numerical simulation of stochastical differential equations. SIAM Review. 43-3 (2001) 525-546. [23] Huang, Chung-Yuan — Hsieh, Ji-Lung — Sun, Chuen-Tsai — Cheng, Chia-Ying, Teaching epidemic and public health policies through simulation, WSEAS Transactions on Information Science and Applications, 3(5), May 2006, pp. 899904. [24] P.T. James, R. Leach, E. Kalamara and M. Shayeghi, Obesity, the Major Health Issue of the 21st Century The Worldwide Obesity Epidemic,Obesity Research, 9, 2001, pp. 228-233. [25] L. J´odar, F. Santonja, G. Gonz´alez-Parra, Modeling dynamics of infant obesity in the region of Valencia, Spain, Computers & Mathematics with Applications, doi:10.1016/j.camwa.2008.01.011. ISSN: 1109-9518
[26] K. Kadry, A Solution of Linear Stochastic Differential Equation, WSEAS Transactions Mathematics, 6(4), April 2007, pp. 628-631. [27] B. Kegan and R.W. West, Modeling the simple epidemic with deterministic differential equations and random initial conditions, Mathematical Biosciences,195, 2005, pp. 179-193. [28] P. Kloeden, E. Platen, Numerical solution of stochastic differential equations, Springer (1995). [29] A.L. Lloyd ,Realistic Distributions of Infectious Periods in Epidemic Models: Changing Patterns of Persistence and Dynamics,Theoretical Population Biology, 60-1, 2001, pp. 59-71. [30] V. Mallet and B. Sportisse, Air quality modeling: From deterministic to stochastic approaches, Computers & Mathematics with Applications., (2008), doi:10.1016/j.camwa.2007.11.004. [31] F. Morrison, The art of modeling dynamic systems. Springer (1995). [32] J.D. Murray, Mathematical biology. Springer (2002). [33] B. Oksendal, Stochastic Differential Equations, Springer, New York, 1995. [34] B. Saf, Peak flow estimation based on synthetic storm with Monte Carlo method, WSEAS Transactions on Environment and Development, 2(1), January 2006, pp. 9-14. [35] R.B. Schinazi, A Stochastic model for cancer risk, Genetics Society of America, 174, 2006, pp. 545-547. [36] P. Rupsys, The Relationships Between the Diameter Growth and Distribution Laws, WSEAS Transactions on BIOLOGY and BIOMEDICINE, 4(12), December 2007, pp. 142-161. [37] T. Soong T. Soong, Random Differential Equations in Science and Engineering, Academic Press, New York, 1973. [38] T. Soong, Probabilistic Modeling and Analysis in Science and Engineering, Wiley, New York, 1992. [39] Y. Wang, T. Lobstein, Worldwide trends in childhood overweight and obesity. International Journal of Pediatric Obesity. 1 - 1 (2006) pp. 1125.
45
Issue 2, Volume 5, February 2008