Read-Out Frequency Response of Solution-Processed Organic Photoconductive Devices Takeshi Fukuda, Mitsuo Komoriya, Ryotaro Mori, Zentaro Honda, Khorou Takahashi and Norihiko Kamata
Graduate School of Science and Engineering, Saitama University 255 Shimo-Okubo, Sakura-ku, Saitama-shi, Saitama 338-8570, Japan
Corresponding author: T. Fukuda Electronic mail:
[email protected] Tel and Fax: +81-48-858-3526
A solution-processed organic photoconductive device sensitive to the only blue-light was demonstrated using poly(9,9-dioctylfluorene-alt-benzothiadiazole) (F8BT). The spectral selectivity was good enough to divide the incident light into a blue component, indicating the possibility of color separation without a prism for video cameras in combination with green- and red-sensitive devices. The maximum conversion efficiency of 190 µA/W was observed while irradiating the blue-light (475 nm) and applying the voltage (2.4 V). In addition, the response speed of more than 30 Hz was achieved, and it was fast enough to apply this photoconductive device to practical applications.
Keyword: photoconductive device, frequency response, color selectivity, wet process, polymer 1
Introduction
sensors have attracted much attention from
Recently, there have been considerable interests
viewpoints of lightweight and thinness compared to
in organic devices [1-5] due to the possibility of
such
other
conventional
image
sensors,
solution process, which leads us to a large-device
complementary metal-oxide-semiconductor sensors
area and a low-fabrication cost. Especially, there
and charge-coupled devices.
has been an extensive effort to investigate organic
In order to obtain a color picture image using an
light-emitting diodes, which are already practical
organic photoconductive film, a practical read-out
use in main- and sub-displays for mobile phones
frequency response as well as the static sensitivity
[6]. In addition, organic photoconductive devices
is desirable. In general, organic devices consist of
have been also expected for many applications,
stacked thin organic layers because of its lower
such as organic solar cells [7, 8] and flexible
carrier mobility than that of semiconductor
scanners [9, 10].
materials [13, 14]. Therefore, the larger capacitance of an organic layer causes the lower frequency
In previous papers, a new type of an organic
response [15, 16].
image sensor overlaid with three kinds of organic photoconductive films was proposed and this
By now, previous studies have focused on
device is individually sensitive to only one of the
frequency responses of organic devices [17-20],
primary color components (blue, green, and red
and the modulation frequency over MHz has been
lights, respectively) [11, 12]. Organic materials
achieved. The required modulation frequency of
have singular characteristics of the absorption
image sensors is several tens Hz, which is over the
spectrum at a visible wavelength region [11], and
TV flame rate. Therefore, frequency response of
the particular large absorbance leads us to realize
previous organic devices is considered to be high
color-selectivity in photoconductive devices by
enough for image sensing applications. However,
stacking several organic layers with different
little is known about the read-out frequency
absorption bands [12]. Therefore, organic image
response of an organic photoconductive device with 2
the high carrier mobility of an organic material are
the read-out circuit.
necessary.
The primary purpose of this study is to
Therefore,
we
selected
investigate static optical characteristics of a blue-
poly(dioctylfluorenyl-co-benzo-thiadiazole (F8BT)
sensitive organic photoconductive device fabricated
as an organic photoconductive material due to its
by a solution process, such as the absorption
high carrier mobility [21, 22]. The molecular
spectrum, the photocurrent spectrum, and the
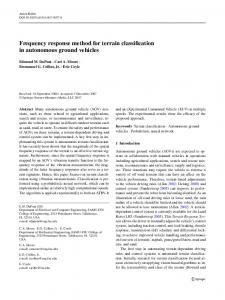
structure of F8BT is shown in the inset of Fig. 1.
while
At first, a glass substrate covered with a
red-lights,
patterned ITO was cleaned with organic solvents
respectively. Another purpose is to estimate the
and deionized water. The ITO layer was deposited
frequency response of optical-electrical conversion
by a conventional sputtering method, and the
efficiency as a function of the optical intensity of
thickness was 150 nm. A blue-sensitive organic
irradiated light to the organic layer.
photoconductive material of F8BT was dissolved in
optical-electrical applying
the
conversion blue-,
efficiency
green-,
and
Experimental
chloroform as a content of 15 g/l. After passing
Figure 1 represents a cross sectional view of a
through a filter with 0.45 µm holes, the organic
blue-sensitive photoconductive device. This device
solution was spin-coated at a rotation speed of 1000
was fabricated by spin-coating and thermal
rpm for 60 sec. And then, chloroform was removed
evaporation processes for an organic layer and a
by baking the sample in nitrogen atmosphere at 100
metal cathode, respectively. When, the blue-light is
degree for 10 min. Finally, LiF and Al were
irradiated
a
thermally evaporated successively on the top of an
transparent anode, an organic photoconductive
organic layer. The device structure was Glass/ITO
layer generates carriers and read out signals are
(150 nm)/F8BT (160 nm)/LiF (1.0 nm)/Al (150
taken out from an indium tin oxide (ITO) anode
nm), and the photoconductive area was 6.25 mm2.
through
a
glass
substrate and
and an Al cathode. In order to realize high device
The ultraviolet-visible light absorption spectrum
performances, the large absorption coefficient and
of the F8BT neat film was recorded with a double3
beam UV/Vis spectrophotometer (V-550, JASCO).
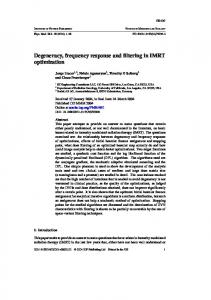
in Fig. 2(a). In addition, Fig. 2(b) shows a
In addition, the photocurrent spectrum of the device
fabricated
was estimated by measuring the wavelength
photoconductive device. The read-out circuit was
dependence
while
fabricated in combination with several electronic
irradiating the monochromic light by a fluorescence
equipments, operational amplifiers (OP 1 and OP 2),
spectrometer (FP-777, JASCO). The irradiated light
analog switches (SW 1, SW 2, and SW 3), and
was modulated by an optical chopper, and the
several capacitances. When the excitation light with
photocurrent was detected by a digital lock-in
the center wavelength of 450 nm was irradiated the
amplifier (LI5640, NF Corporation).
photoconductive device, the photocurrent was
of
photocurrent
density
of output electrons divided by the total number of photons,
was
the
organic
Figure 2(c) indicates the timing chart of switches, SW 1, SW 2, and SW 3. If SWs 1 and 3 are closed
measured photocurrent and the optical intensity of
in the time region A, the capacitance of the organic
irradiated light. In order to estimate the color-
photoconductive layer (Cm) is charged up to Vb.
selectivity of this device, we used three-kinds of
Then, the charging current corresponding to the
light-emitting
center
photocurrent transports through SW1, and is
wavelengths of 469, 525, and 619 nm, respectively.
integrated with the aid of the capacitance of
In addition, the dark current was also measured
integrator (C1). The output voltage of OP1 is
without irradiating light.
sampled and held in the capacitance (C2) as the
(LEDs)
from
for
the
diodes
estimated
circuit
measured as an output voltage of Vo.
The quantum efficiency, defined as the number
irradiated
read-out
with
In order to investigate transient responses of the
read out voltage of Vo. After closing the SW 2, the
fabricated device, we measured the step response
integrated charge in the capacitor (C1) is discharged
and the transient voltage characteristics while
and reset in the case of the region C shown in Fig.
applying the pulse voltage to a read-out circuit. The
2(c). Therefore, the photocurrent of the organic
electronic circuit of a measurement setup is shown
photoconductive device can be read sequentially by 4
the absorption peak. Therefore, these results clearly
opening and closing these analog SWs. Results and Discussion
indicate that a selectively only blue-sensitive
The dotted curve in Fig. 3 shows the absorption
organic photoconductive device has been achieved
spectrum of the F8BT neat film. The peak
by the wet process. However, only the photocurrent
wavelength and the full width at half maximum
spectrum
(FWHM) were 463 and 85 nm, respectively. The
wavelength region. In order to investigate the
maximum absorption coefficient was 1.38 x 10⁵
second peak of the photocurrent spectrum, we
cm-1, corresponding to the absorbance of 80.2%
measured the PL spectrum of the device excited at
through the organic layer of 160 nm. Therefore, the
456 nm corresponding to the first peak of the
most of incident light is absorbed into the F8BT
photocurrent spectrum. However, the measured PL
layer, and photo-induced carriers are considered to
spectrum had no peak at the red wavelength region.
be excited efficiently. However, the thickness is not
Although the reason is not well confirmed at this
optimized yet, and the higher absorbance is
stage, we consider it to be unessential from the
necessary to improve the device performance.
viewpoint of the absorption spectrum in Fig. 3. We
However, the F8BT layer over 160 nm is difficult
tried to improve the quality of the organic layer and
to coat using the spin coating process owing to the
metal electrode.
low concentration of organic solution.
showed
second
peak
at
the
red
Figure 4 shows conversion efficiency-voltage
The photocurrent spectrum of the device is also
characteristics of the photoconductive device while
shown by the solid curve in Fig. 3. Here, the bias
irradiating blue- (475 nm), green- (513 nm), and
voltage of 2.5 V was applied to the device. The
red- (623 nm) lights, respectively. By excitation of
spectral shape is similar to the absorption spectrum
the blue-light, the conversion efficiency of the
of the F8BT neat film. Furthermore, the spectral
photoconductive device was 250 µA/W, while
photo-response
peak
those were 64.8 and 0.007 µA/W for green- and
wavelength at 456 nm, which was near the value at
red-excitations, respectively. Since the higher
curve
had
respective
5
absorption coefficient of an organic material causes
output voltage of Ch 1 and 2. Here, the output
the
a
voltage characteristics of Ch 1 and 2 are
photoconductive device, this property change is
corresponding to the photocurrent and the applied
primarily
voltage. In addition, the center wavelength of
large
conversion
associated
efficiency
with
of
photocurrent
and
absorption spectra as shown in Fig. 3. The
conversion
efficiency
irradiated light was 450 nm, which is near the value
increased
with
of absorption peak, as shown in Fig. 3. When the
increasing the applied voltage in all the cases of
applied voltage of Ch 2 is turned off, the
irradiated lights. This is because the carrier
photocurrent increases gradually. The time required
mobility of organic materials increased with
to change the output voltage to 63.2% of full
increasing the voltage [23], resulting in the efficient
change gave a rise time of 23 µs. From the rise time,
carrier transfer in F8BT with less recombination
the capacitance value of Cm=3.7x10⁴ pF/cm2 was
probability. As a result, the conversion efficiency
derived.
improves at higher electric field.
Figure
6(b)
shows
the
transient
voltage
Photocurrent and dark-current are plotted in Fig.
characteristics of Ch 1 while applying the pulse
5. The intensity and the center wavelength of
voltage. This experimental result yields the voltage
irradiated light were 2.8 mW/cm2 and 475 nm,
of 25 mV for the difference between a steady state
respectively. As clearly shown in Fig. 5, the
and a zero level. As a result, the resistivity of 250
photocurrent exceeded the dark current by two
Ωcm and the RC time constant of approximately
orders of magnitude in all the cases of applied
920 µs were obtained. Therefore, the RC time
voltage.
constant is not so large to affect the frequency
We estimated capacitance and resistance of an organic
photoconductive
layer
(F8BT)
response of the device [15].
by
We show in Fig. 7, the relationship between the
measuring step response and transient voltage
output voltage (Vo) and the intensity of irradiated
characteristics. Figure 6(a) shows the transient
light. The modulated read-out signal was ranged 6
from 2 to 100 Hz, and the bias voltage (Vb) was
However, the result indicates that the output
applied to the device during the measurement. The
voltage is still high enough up to 30 Hz for actual
output voltage increased with increasing the
TV frame rates. In the frequency region of less than
intensity of irradiated light. In such an organic
30 Hz, more than 0.1 V could be detected as the
photoconductive device, the photo-induced carriers
photocurrent.
are detected as the output voltage, and the photo-
Conclusion
induced carriers increased with increasing the
We investigated the read-out frequency response
irradiated optical intensity. Therefore, the high
of a solution-processed organic photoconductive
intensity light causes more carriers in the organic
device in combination with the read-out circuit. The
photoconductive layer, resulting in the higher
transient photocurrent showed enough frequency
photocurrent [11, 12].
response for practical application of TV frame rates
The frequency dependence of the output voltage
using organic photoconductive materials based on a wet process.
is shown in Fig. 8. The intensity of irradiated bluelight was 0.6, 8.3, and 14.5 mW/cm2, respectively.
Acknowledgment
In all the cases, the output voltage decreased with
The part of this work was supported by
increasing the frequency of read-out signal. This is
"Development of functional optical materials and
because
read-out
devices for next generation in frontier photonics",
operation reduces photo-generated carriers in the
Regional New Consortium of Ministry of Economy,
organic photoconductive layer because of the low
Trade and Industry.
carrier
that
the
mobility
higher
of
frequency
F8BT
compared
to
References
semiconductor materials [21, 22] and the large gap
[1] S. Nakano, T. Sekitani, T. Yokota, T. Someya.
between
Appl. Phys. Lett., 92, 053302, (2008).
highest
unoccupied
molecular
orbital/lowest occupied molecular orbital levels of
[2] J. A. Hauch, P. Schilinsky, S. A. Choulis, R.
F8BT and work functions of electrodes [20, 24, 25].
Childers, M. Biele, C. J. Brabec. Sol. Energy Mater. 7
Sol. Cells, 92, 727, (2008).
Phys, Lett., 82, 511, (2003).
[3] D. Wang, X. Gong, P. S. Heeger, F. Rininsland,
[12] H. Seo S. Aihara, T. Watabe, H. Ohtake, M.
G. C. Bazan, A. J. Heeger. PNAS, 99, 49, (2002).
Kubota, N. Egami. Jpn. J. Appl. Phys., 46, L1240,
[4] S. Tatemichi, M. Ichikawa, S. Kato, T. Koyama,
(2007).
Y. Taniguchi. Phys. Sta. Sol. (RRL), 2, 47, (2008).
[13] C. W. Tang, S. A. VanSlyke, C. H. Chen. J.
[5] M. Shakutui, K. Fujita, T. Tsutsui. Jpn. J. Appl.
Appl. Phys., 65, 3610, (1989).
Phys., 45, L790, (2006).
[14] P. S. Vincentt, W. A. Barlow, R. A. Hann, G. G.
[6] H. Kubota, S. Miyaguchi, S. Ishizuka, T.
Roberts. Thin Solid Films, 98, 171, (1982).
Wakimoto, J. Funaki, Y. Fukuda, T. Watanabe, H.
[15] B. Wei, K. Furukawa, J. Amagi, M. Ichikawa,
Ochi, T. Sakamoto, T. Miyake, M. Tsuchida, I.
T. Koyama, Y. Taniguchi. Semicond. Sci. Technol.,
Ohshita, T. Tohma. J. Lumi., 87-89, 56, (2000).
19, L56, (2004)
[7] O. Hagemann, M. Bjerring, N. C. Nielsen, F. C.
[16] H. Kajii, T. Tsukagawa, T. Taneda, Y. Ohmori.
Krebs. Sol. Energy Mater. Sol. Cells, 92, 1327,
IEICE Trans. Electron., E85-C, 1245, (2002).
(2008).
[17] J. –S. Kim, H. Kajii, Y. Ohmori. Thin Solid
[8] C. J. Brabec, N. S. Sariciffi, J. C. Hummelen.
Films, 499, 343, (2006).
Adv. Funct. Mater., 11, 15, (2001).
[18] S. W. Culligan, A. C. –A. Chen, J. U. Wallace,
[9] Y. Matsushita, H. Shimada, T. Miyashita, M.
K. P. Klubek, C. W. Tang, S. H. Chen. Adv. Funct.
Shibata, S. Naka, H. Okada. Jpn. J. Appl. Phys., 44,
Mater., 16, 1481, (2006).
2826, (2005).
[19] T. Fukuda, M. Ohashi, B. Wei, T. Okada, M.
[10] H. Kawaguchi, Shingo Iba, Y. Kato, T.
Ichikawa, Y. Taniguchi. Opt. Lett., 32, 1150, (2007).
Sekitani, T. Someya, T. Sakurai. IEEE Sensors
[20] T. Fukuda, B. Wei, M. Ichikawa, Y. Taniguchi.
Journal, 6, 1209, (2005).
Jpn. J. Appl. Phys., 46, 7880, (2007).
[11] S. Aihara, Y. Hirano, T. Tajima, K. Tanioka, M.
[21] L. –L. Chua, J. Zaumeil, J. –F. Chang, E. C. –
Abe, N. Saito, N. Kamata, D. Terunuma. Appl.
W. Ou, P. K. –H. Ho, H. Sirringhaus, R. H. Friend. 8
Nature, 434, 194, (2005).
[2] Q. Niu, Y. Zhou, L. Wang, J. Peng, J. Wang, J.
[22] A. J. Campbell, D. D. C. Bradley, H.
Pei, Y. Cao. Adv. Mater., 20, 964, (2008).
Antoniadis. Appl. Phys. Lett., 79, 2133, (2001).
[25] Y. Kim, S. Cook, S. A. Choulis, J. Nelson, J. R.
[23] S. Barth, P. Müller, H. Riel, P. F. Seidler, W.
Durrant, D. C. C. Bradley. Chem. Mater., 16, 4812,
Rieβ. J. Appl. Phys., 89, 3711, (2001).
(2004).
9
N
S N
n
+
Al:150 nm
F8BT:160 nm
Glass substrate ITO:150 nm
LiF:1.0 nm
Light
Fig. 1 The structure of a blue-sensitive device and the molecular structure of F8BT used as a photoconductive layer.
10
Ch 2
Rm
Cm Ch 1
device 10 kΩ
C2 (a)
Light 450 nm
SW 2 C1
Cm
2000 pF SW 1 Vb
ON OFF
Organic photoconductive device
OP1
OP2 Vo
SW 3 C2
1000 pF
(b)
A SW 1, SW 3 B
C
ON OFF
SW 2 (c)
Fig. 2 (a) The electric circuit to measure transient properties of an organic photoconductive device. (b) The read-out circuit for an organic photoconductive device and (c) the timing chart of SWs (SW 1, 2, and 3) used in the read-out circuit.
11
2 Photocurrent Absorption coeff.
50
1.5
40 30
1
20 0.5 10 0
0 400
500
600 700 Wavelength (nm)
Absorption coefficient (105 cm-1 )
Conversion efficiency (µA/W)
60
800
Fig. 3 The photocurrent spectrum of the organic photoconductive device under the bias voltage of 2.5 V and the absorption spectrum of the F8BT neat film.
12
Conversion efficiency (µA/W)
300 200 100 0 -100
475 nm 513 nm 623 nm
-200 -300 -3
-1.5
0 Voltage (V)
1.5
3
Fig. 4 The relationship between the conversion efficiency of the organic photoconductive device and the applied voltage while irradiating the blue (475 nm), green (513 nm), and red (623 nm) lights, respectively.
13
Current density (nA/cm2)
100 10 1 0.1
Photocurrent Dark current
0.01 0
1
2
3
Voltage (V)
Fig. 5 Photocurrent and dark current as a function of the applied voltage. The center wavelength and the intensity of irradiated light were 475 nm and 2.8 mW/cm2, respectively.
14
23 µs
Ch 1
Ch 2
(a)
Ch 1 25 mV
Ch 2
(b)
Fig. 6 (a) The photoccurent (Ch 1) and applied voltage (Ch 2) of organic photoconductive device and (b) the transient voltage characteristic while applying the pulse voltage to Ch 2.
15
Output voltage (V)
4
2 Hz 5 Hz 10 Hz 50 Hz 100 Hz
3 2 1 0 0
5 10 15 Optical intensity(mW/cm2)
20
Fig. 7 The relationship between the output voltage (Vo) and the optical intensity of irradiated blue-light. The frequency of read-out circuit was changed from 2 to 100 Hz.
16
10
Output voltage (V)
0.6 mW/cm2 W/cm2 8.3 mW/cm2 W/cm2 1
14.5 mW/cm2 W/cm2
0.1
0.01 0
50 100 Frequency (Hz)
150
Fig. 8 The frequency dependence of the output voltage (Vo). The optical intensities of irradiated blue-light were 0.6, 8.3, and 14.5 mW/cm2, respectively.
17