13754 • The Journal of Neuroscience, December 17, 2008 • 28(51):13754 –13764
Behavioral/Systems/Cognitive
Regional Variation in Interhemispheric Coordination of Intrinsic Hemodynamic Fluctuations David E. Stark,1,2 Daniel S. Margulies,3 Zarrar E. Shehzad,1 Philip Reiss,1 A. M. Clare Kelly,1 Lucina Q. Uddin,1 Dylan G. Gee,1 Amy K. Roy,1 Marie T. Banich,4 F. Xavier Castellanos,1,5 and Michael P. Milham1 Phyllis Green and Randolph Co wen Institute for Pediatric Neuroscience at the New York University Child Study Center, New York, New York 10016, Harvard Medical School, Boston, Massachusetts 02115, 3Berlin School of Mind and Brain, 10099 Berlin, Germany, 4Department of Psychology, University of Colorado, Boulder, Colorado 80309, and 5Nathan Kline Institute for Psychiatric Research, Orangeburg, New York 10962 1 2
Electrophysiological studies have long demonstrated a high degree of correlated activity between the left and right hemispheres, however little is known about regional variation in this interhemispheric coordination. Whereas cognitive models and neuroanatomical evidence suggest differences in coordination across primary sensory-motor cortices versus higher-order association areas, these have not been characterized. Here, we used resting-state functional magnetic resonance imaging data acquired from 62 healthy volunteers to examine interregional correlation in spontaneous low-frequency hemodynamic fluctuations. Using a probabilistic atlas, we correlated probability-weighted time series from 112 regions comprising the entire cerebrum. We then examined regional variation in correlated activity between homotopic regions, contrasting primary sensory-motor cortices, unimodal association areas, and heteromodal association areas. Consistent with previous studies, robustly correlated spontaneous activity was noted between all homotopic regions, which was significantly higher than that between nonhomotopic (heterotopic and intrahemispheric) regions. We further demonstrated substantial regional variation in homotopic interhemispheric correlations that was highly consistent across subjects. Specifically, there was a gradient of interhemispheric correlation, with highest correlations across primary sensory-motor cortices (0.758, SD ⫽ 0.152), significantly lower correlations across unimodal association areas (0.597, SD ⫽ 0.230) and still lower correlations across heteromodal association areas (0.517, SD ⫽ 0.226). These results demonstrate functional differences in interhemispheric coordination related to the brain’s hierarchical subdivisions. Synchrony across primary cortices may reflect networks engaged in bilateral sensory integration and motor coordination, whereas lower coordination across heteromodal association areas is consistent with functional lateralization of these regions. This novel method of examining interhemispheric coordination may yield insights regarding diverse disease processes as well as healthy development. Key words: interhemispheric; synchrony; functional MRI; connectivity; lateralization; hemisphere; coordination
Introduction Models of the brain’s functional architecture emphasize both distributed processing within spatially segregated regions and longrange integration across regions. These organizing principles become especially apparent with regard to interhemispheric coordination. Processing of sensory inputs and motor outputs requires integration between the hemispheres, whereas higherorder cognitive functions including language and spatial attention are predominantly lateralized (Toga and Thompson, 2003). Such considerations suggest that the nature of interhemispheric coordination may differ across regions, yet little is known about regional variation in interhemispheric coordination across the brain. Received Sept. 22, 2008; revised; accepted Oct. 22, 2008. We thank E. Petkova and W. Gan for assistance with statistical analyses, A. F. T. Arnsten for discussion, and R. Toro for assistance with 3D reconstructions. D.S.M was responsible for initial study conceptualization, design, and feasibility analyses. Correspondence should be addressed to either of the following: David E. Stark or Michael P. Milham, 215 Lexington Avenue, 14th Floor, New York, NY 10016. E-mail:
[email protected] or
[email protected]. DOI:10.1523/JNEUROSCI.4544-08.2008 Copyright © 2008 Society for Neuroscience 0270-6474/08/2813754-11$15.00/0
Resting-state EEG studies have long demonstrated coherent electrical activity between the left and right hemispheres (Duffy et al., 1996). Likewise, functional neuroimaging studies consistently reveal bilateral patterns of coactivation (Toro et al., 2008). The corpus callosum appears to play a central role in mediating this coordination, as interhemispheric coherence is decreased in acallosal (Nielsen et al., 1993; Koeda et al., 1995) and callosotomized (Johnston et al., 2008) patients. Indeed, postmortem tracing studies in animals indicate that most callosal fibers interconnect homotopic regions (Innocenti, 1986), defined as corresponding anatomical areas in opposite hemispheres. Whereas studies report a high overall degree of interhemispheric coordination, with functional coupling likely subserved by the callosum, regional variation in such interhemispheric connectivity has been reported, primarily in anatomical studies (Tomasch, 1954; LaMantia and Rakic, 1990b; Aboitiz et al., 1992). Such anatomical variability suggests functional differences in interhemispheric coordination across different regions, yet studies performed to date, limited by low spatial resolution inherent to EEG, have not distinguished such regional differences. Resting-state functional magnetic resonance imaging (fMRI)
Stark et al. • Variation in Interhemispheric Coordination
approaches enable simultaneous examination of correlated activity across many regions and thus offer a novel means for studying interhemispheric coordination. Temporally correlated patterns of low-frequency spontaneous (nonevoked) brain activity revealed by this approach recapitulate known functional and neuroanatomical networks. Moreover, their presence has been demonstrated during task performance, sleep, sedation, anesthesia, and at rest, suggesting that they reflect intrinsic aspects of the brain’s functional architecture (Fox and Raichle, 2007; Vincent et al., 2007; Greicius et al., 2008). Studies have observed a high degree of interhemispheric correlation in various cortical and subcortical regions (Biswal et al., 1995; Lowe et al., 1998; Cordes et al., 2000; Margulies et al., 2007). Salvador and colleagues (2005) in particular noted that correlated activity between homotopic regions is a relatively ubiquitous phenomenon observable across brain regions, although they did not directly examine regional variation in interhemispheric correlation. Other restingstate studies offer insights into regional variation. For example, of 10 functional networks identified by Damoiseaux and colleagues (2006), only two, both encompassing dorsolateral prefrontal and parietal regions, were lateralized. As these higher-order association areas are thought to subserve functionally lateralized cognitive processes, the authors speculated that their results reflect this hemispheric specialization. Here, we examine interregional correlations in spontaneous brain activity, specifically addressing regional variation in the degree of correlated activity between homotopic regions. We hypothesized a high overall degree of correlated activity between homotopic regions, with greater interhemispheric correlation in primary sensory-motor cortices relative to prefrontal and temporoparietal heteromodal association areas.
Materials and Methods Subjects. Subjects included 62 right-handed volunteers (33 males, 29 females, ages 19 – 49 years, mean age 29.2 ⫾ 7.9 years) with no history of psychiatric or neurological illness as confirmed by psychiatric clinical assessment. Informed consent was obtained before participation. Data collection was carried out according to protocols approved by the institutional review boards of New York University (NYU) and the NYU School of Medicine, with Doctor F. Xavier Castellanos as principal investigator and Doctors Milham, Stark, and colleagues as coinvestigators. Data acquisition. A Siemens Allegra 3.0 Tesla scanner equipped for echo planar imaging (EPI) was used for data acquisition. Each subject underwent a resting-state scan consisting of 197 contiguous EPI wholebrain functional volumes, resulting in a 6 min 38 s scan [repetition time (TR) ⫽ 2000 ms; echo time (TE) ⫽ 25 ms; flip angle ⫽ 90°, 39 slices, matrix ⫽ 64 ⫻ 64; field of view (FOV) ⫽ 192 mm; acquisition voxel size ⫽ 3 ⫻ 3 ⫻ 3 mm]. Subjects were asked to relax and remain still with their eyes open. For spatial normalization and localization, a highresolution T1-weighted magnetization prepared gradient echo sequence was also obtained (TR ⫽ 2500 ms; TE ⫽ 4.35 ms; TI ⫽ 900 ms; flip angle ⫽ 8°, 176 slices; FOV ⫽ 256 mm). The complete set of scans used in the present study was obtained over the course of ⬃1 year. Subsets of these data have been used in previous publications (Margulies et al., 2007; Castellanos et al., 2008; Di Martino et al., 2008; Kelly et al., 2008a,b; Uddin et al., 2008a). Preprocessing. Consistent with prior work in our lab (Margulies et al., 2007; Castellanos et al., 2008; Di Martino et al., 2008), data processing was carried out using both Analysis of Functional NeuroImaging (AFNI) (http://afni.nimh.nih.gov/afni/) and fMRIb Software Library (FSL) (http://www.fmrib.ox.ac.uk/fsl/). Image preprocessing using AFNI consisted of (1) slice time correction for interleaved acquisitions using Fourier interpolation, (2) three-dimensional (3D) motion correction via 3D volume registration using least-squares alignment of three translational and three rotational parameters, and (3) despiking of extreme time series outliers using a hyperbolic tangent function. Preprocessing using FSL
J. Neurosci., December 17, 2008 • 28(51):13754 –13764 • 13755
consisted of (4) mean-based intensity normalization of all volumes by the same factor, (5) temporal high-pass filtering via Gaussian weighted least-squares straight line fitting with ⫽ 100.0 s, (6) temporal lowpass filtering via Gaussian filter with half width at half maximum ⫽ 2.8 s, and (7) correction for time series autocorrelation (prewhitening). The use of bandpass filtering to isolate the 0.005 to 0.1 Hz frequency interval was motivated by previous studies of low-frequency fluctuations, as well as our own experience, demonstrating relevant signal fluctuations over this frequency range (Fransson, 2005). The data were not spatially smoothed as this is effectively achieved via averaging across all voxels within each region (see below, Time series extraction) as well as to minimize artifactual interhemispheric correlation because of smoothing across the medial wall. Functional data were then transformed into MNI (Montreal Neurological Institute) space using a 12 degree of freedom (df) linear affine transformation implemented in FLIRT (fMRIb’s Linear Image Registration Tool) (voxel size, 2 ⫻ 2 ⫻ 2 mm), to enable time series extraction using standard anatomical masks. Time series extraction. Parcellation of functional data were carried out using the Harvard–Oxford Structural Atlas, a validated probabilistic atlas implemented in FSL that divides each hemisphere into regions corresponding to portions of cortical gyri and subcortical gray matter nuclei (Kennedy et al., 1998; Makris et al., 1999). Masks were generated for 112 regions (56 in each hemisphere), covering the entire cerebrum (Fig. 1). To minimize effects because of interindividual anatomic variability, atlas-derived values corresponding to each voxel’s probability of inclusion in a given region were used to weight each voxel’s time series within that region. In each subject, mean time series were then extracted for each region by averaging across all voxels’ probability-weighted time series within each region. To minimize the effects of physiological processes such as cardiac and respiratory fluctuations, time series were also extracted from nine nuisance signals [global signal, white matter (WM), CSF, and six motion parameters]. To extract the nuisance covariate time series for WM and CSF, we first segmented each individual’s high-resolution structural image, using FAST (fMRIb’s Automated Segmentation Tool). The resulting segmented WM and CSF images were then thresholded to ensure 80% tissue type probability. These thresholded masks were then applied to each individual’s time series, and a mean time series was calculated by averaging across all voxels within the mask. The global signal regressor was generated by averaging across all voxels within the brain. Each subject’s 112 regional time series were orthogonalized with respect to nuisance covariates (using the Gram–Schmidt process). This analysis generated 112 time series representing every cortical and subcortical region for all 62 subjects. Correlation analyses. All further analyses were carried out using R statistical analysis software (version 2.6.1, http://www.r-project.org/) and SAS software (version 9.1, SAS System for Microsoft Windows). For each subject, we calculated the correlation between every pairing of orthogonalized time series from the set of 112 brain regions. Homotopic versus nonhomotopic correlations. The spatial interrelationship of a given pairing of brain regions can be classified according to one of three broad categories. Homotopic regions indicate corresponding anatomical areas in opposite hemispheres, heterotopic regions indicate different anatomical areas in opposite hemispheres, and intrahemispheric regions indicate different anatomical areas in the same hemisphere. To first test whether a significant difference existed between homotopic versus nonhomotopic (heterotopic and intrahemispheric) interregional correlations, we used a linear mixed effects model, implemented using the R package nlme (Pinheiro et al., 2006), to regress all z-transformed correlations on three indicator variables: (1) homotopic, (2) heterotopic, and (3) intrahemispheric. Age and gender were entered as covariates and a random subject effect was included to account for within-subject correlation. Systematic regional variation in homotopic interhemispheric correlation. The primary focus of the present study was to examine regional variation in correlated activity between homotopic regions. To characterize this variation, we rank-ordered all 56 homotopic correlation coefficients in each subject. We tested whether the within-subject rankings of homo-
Stark et al. • Variation in Interhemispheric Coordination
13756 • J. Neurosci., December 17, 2008 • 28(51):13754 –13764
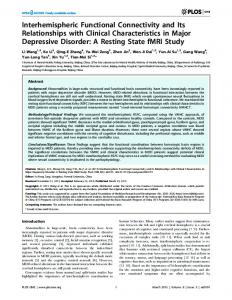
Figure 1. Regional masks. A total of 112 regional masks (56 in each hemisphere) comprising the entire cerebrum were generated from the Harvard–Oxford Structural Atlas, a validated probabilistic atlas that divides each hemisphere into regions corresponding to portions of cortical gyri and subcortical gray matter nuclei. Atlas-derived values corresponding to each voxel’s probability of inclusion in a given region were used to derive probability-weighted time series for all 112 regions (see Materials and Methods for details). For visualization, all three-dimensional reconstructions are thresholded to include voxels with ⬎25% probability of inclusion in a given region. Occluded perisylvian regions are depicted in cut-away views. The lower bank is viewed from a top-down perspective; the upper bank is viewed from a bottom-up perspective.
topic correlations differed systematically by implementing the Friedman 2 test. We also rank-ordered each homotopic correlation coefficient’s median ranking across subjects, resulting in the sorting of homotopic correlation coefficients from 1 (the region exhibiting the highest median ranked interhemispheric correlation) to 56 (the region exhibiting the lowest median ranked interhemispheric correlation). Analysis of regional variation related to hierarchical subdivisions. To statistically test our hypothesis that regions involved in higher-order processing exhibit lower levels of correlated activity across hemispheres, we labeled regions according to their functional classification as primary sensory-motor, unimodal association, or heteromodal association areas, as described by Mesulam (2000). These hierarchical subdivisions are broadly derived from anatomical, electrophysiological, behavioral, lesion, and functional imaging studies in nonhuman primates and in humans. Primary sensory-motor cortices include postcentral gyrus (somatosensory), intracalcarine cortex and occipital pole (visual), Heschl’s gyrus (auditory), and precentral gyrus (motor). Unimodal association areas are those regions adjacent to primary sensory-motor cortices involved in integration of information from predominantly one sensory or motor modality. Heteromodal association areas, located primarily in prefrontal and temporoparietal cortices, integrate information from multiple sensory and motor modalities (see Fig. 4 A and supplemental Table 1 for a complete listing of each region’s functional classification, available at www.jneurosci.org as supplemental material). We used a linear mixed effects model, implemented in SAS, to regress the entire set of z-transformed homotopic correlations on indicator variables defining primary sensory-motor, unimodal association, and heteromodal association areas. Three planned contrasts were carried out, comparing homotopic correlation strengths in primary, unimodal, and heteromodal areas. Age and gender were again entered as covariates and a random subject effect was included to account for within-subject correlation. Additional mixed effects analyses were carried out in which
z-transformed homotopic correlations for primary versus unimodal association areas were separately contrasted within each sensory and motor modality.
Results Homotopic versus nonhomotopic correlations Consistent with previous resting-state studies (Salvador et al., 2005), correlations between homotopic regions (mean r ⫽ 0.62, SD ⫽ 0.23) were significantly higher than correlations between heterotopic regions (mean r ⫽ ⫺0.01, SD ⫽ 0.27; t ⫽ 159 with 385328 df, p ⬍ 0.0001) and between intrahemispheric regions (mean r ⫽ 0.021, SD ⫽ 0.28; t ⫽ 152 with 385328 df, p ⬍ 0.0001) (Fig. 2) (see also supplemental Materials and Methods for further discussion of large reported df, available at www.jneurosci.org as supplemental material). Systematic regional variation in homotopic interhemispheric correlation Despite the high degree of synchronous activity noted between all homotopic regions, substantial regional variation in interhemispheric correlation was observed, with mean correlation coefficients ranging from 0.33– 0.88 (Fig. 3). The Friedman 2 test strongly confirmed the existence of a systematic pattern of variation among homotopic correlations ( 2 ⫽ 2057 with 55 df, p ⬍ 0.0001). Analysis of regional variation related to hierarchical subdivisions The presence of a notable pattern of regional variation in interhemispheric correlation was confirmed by mixed effects analyses modeling the z-transformed interhemispheric correlations be-
Stark et al. • Variation in Interhemispheric Coordination
Figure 2. Homotopic versus nonhomotopic correlations. Correlations between homotopic regions were significantly higher than correlations between heterotopic regions and between intrahemispheric regions. Data points are shown for each region, averaged across subjects. Black lines indicate mean with SEM.
tween all 56 homotopic regions as a function of hierarchical subdivision. The mean interhemispheric correlations for primary sensory-motor, unimodal association, and heteromodal association areas were estimated and compared based on this model. Primary sensory-motor cortices demonstrated a significantly higher degree of interhemispheric correlation than either unimodal association areas (t ⫽ 13.10 with 3405 df, p ⬍ 0.0001) or heteromodal association areas (t ⫽ 17.85 with 3405 df, p ⬍ 0.0001). Moreover, unimodal association areas showed significantly higher interhemispheric correlations than heteromodal association areas (t ⫽ 8.39 with 3405 df, p ⬍ 0.0001) (Figs. 4 B, 5). There were no significant age (t ⫽ 0.05 with 59 df, p ⫽ 0.96) or gender (t ⫽ 0.95 with 59 df, p ⫽ 0.35) effects. These highly significant regional distinctions demonstrate the existence of a wide spectrum of interhemispheric correlation in low-frequency spontaneous hemodynamic fluctuations, and point to the segregation of primary sensory-motor cortices and heteromodal association areas to opposite extremes of this spectrum, with unimodal association areas lying between. Below, we describe in detail the regional variations we observed in correlated spontaneous activity across hemispheres. As anatomical terminology is often variably applied, we make an attempt to explicitly define regions both in terms of their neuroanatomical designations as well as their corresponding functional designations. For each group of regions discussed, we report both the range of mean homotopic interhemispheric correlation coefficients (averaged across subjects), as well as each region’s rank (in which a rank of 1 indicates the region with the highest median ranked interhemispheric correlation and a rank of 56 indicates the region with the lowest median ranked interhemispheric correlation) (Figs. 3, 4 B) (see also supplemental Table 1 for all values, available at www.jneurosci.org as supplemental material). Sensory regions Primary sensory cortices exhibited a high degree of correlated activity across hemispheres, with decreased interhemispheric correlations in unimodal association areas (Fig. 5D). In the somatosensory system, primary somatosensory cortex (postcentral gyrus) demonstrated the highest degree of interhemispheric correlated activity (mean r ⫽ 0.825, rank ⫽ 6). Unimodal somatosensory association areas (central opercular cortex, superior parietal lobule, parietal opercular cortex, supramarginal gyrus, anterior division) exhibited significantly lower interhemi-
J. Neurosci., December 17, 2008 • 28(51):13754 –13764 • 13757
spheric correlations (mean r range ⫽ 0.656 – 0.708, rank ⫽ 16, 20, 24, and 27, respectively; t ⫽ 10.22 with 247 df, p ⬍ 0.0001). Likewise, in the visual system, primary visual cortex (occipital pole and intracalcarine cortex) as well as visual areas flanking the calcarine sulcus (lingual gyrus, supracalcarine cortex, cuneal cortex) demonstrated a high degree of interhemispheric correlation (mean r range ⫽ 0.791– 0.859, rank ⫽ 11, 12, 2, 2, 6, respectively). Compared with primary visual cortex, surrounding unimodal visual association areas encompassing the inferolateral surface of the occipital and temporal lobes (occipital fusiform gyrus, lateral occipital cortex inferior division, temporal occipital fusiform cortex, lateral occipital cortex superior division, temporal fusiform cortex posterior division, inferior temporal gyrus temporooccipital part, inferior temporal gyrus anterior division, temporal fusiform cortex anterior division, inferior temporal gyrus posterior division) exhibited significantly lower degrees of interhemispheric correlation (mean r range ⫽ 0.330 – 0.696, rank ⫽ 18, 26, 29, 32, 42, 48, 54, 55, 56, respectively; t ⫽ 9.46 with 805 df, p ⬍ 0.0001). In the auditory system, primary auditory cortex (Heschl’s gyrus) exhibited a moderately high degree of interhemispheric correlation (mean r ⫽ 0.621, rank ⫽ 27). Surrounding unimodal auditory association areas (planum temporale, planum polare, superior temporal gyrus posterior and anterior divisions) exhibited lower degrees of interhemispheric correlation (mean r range ⫽ 0.385– 0.675, rank ⫽ 23, 33, 34, 49, respectively; t ⫽ 2.49 with 247 df, p ⫽ 0.014), although the planum temporale, an auditory association area located immediately posterior to primary auditory cortex, demonstrated slightly higher interhemispheric correlation (mean r ⫽ 0.675, rank ⫽ 23; t ⫽ 2.24 with 61 df, p ⫽ 0.029). Motor regions Interhemispheric correlations for motor regions reflected the trend observed in sensory regions (Fig. 5D). Specifically, we found that primary motor cortex (precentral gyrus) exhibited a high degree of correlated spontaneous activity across hemispheres (mean r ⫽ 0.736, rank ⫽ 14), whereas unimodal motor association areas (supplementary motor cortex, frontal operculum cortex) demonstrated significantly lower interhemispheric correlations (mean r ⫽ 0.720, 0.391, rank ⫽ 18, 51, respectively; t ⫽ 5.73 with 123 df, p ⬍ 0.0001). Heteromodal association areas Heteromodal association areas generally demonstrated relatively low degrees of correlated spontaneous activity across hemispheres compared with other regions. Prefrontal association regions (inferior frontal gyrus pars opercularis and pars triangularis, frontal pole, middle frontal gyrus, superior frontal gyrus) uniformly demonstrated a low degree of correlated spontaneous activity across hemispheres (mean r range ⫽ 0.383– 0.520, rank ⫽ 49, 47, 44, 40, 38, respectively). Similarly, temporoparietal association regions (middle temporal gyrus temporooccipital part, angular gyrus, supramarginal gyrus posterior division, middle temporal gyrus anterior and posterior divisions) exhibited relatively low interhemispheric correlations (mean r range ⫽ 0.368 – 0.578, rank ⫽ 52, 46, 40, 39, 36, respectively). Notably, paracingulate gyrus and precuneus cortex, both heteromodal association areas lying within the medial wall, exhibited higher degrees of interhemispheric correlation than all other heteromodal areas. Generally speaking, the majority of prefrontal and temporoparietal heteromodal association areas exhibited substantially lower interhemispheric correlations compared with other
13758 • J. Neurosci., December 17, 2008 • 28(51):13754 –13764
Stark et al. • Variation in Interhemispheric Coordination
Figure 3. Homotopic interhemispheric correlations. A, B, Tukey box-and-whiskers plots showing the distribution of (A) interhemispheric correlations and (B) ranked interhemispheric correlations for all 56 homotopic regions across subjects (vertical line, median; box, interquartile range; whiskers, 1.5 times the interquartile range; closed circles, individual values lying outside 1.5 times the interquartile range).
homotopic regions, particularly the primary sensory and motor areas reported above. Analysis of potential confounds The use of anatomically defined masks introduced several potential confounds to our analyses. To determine the extent to which volumetric differences in the masks used may have influenced our results, we performed several additional analyses. We first calculated the left and right volumes for all 56 pairs of homotopic regional masks. For each pair, we found no relationship between total volume (left ⫹ right) and interhemispheric correlation (r ⫽ 0.122, p ⫽ 0.369) (Fig. 6 A). Furthermore, we found no relationship between volumetric asymmetry index [ (left – right)/(left ⫹ right) ] and interhemispheric correlation (r ⫽ 0.163, p ⫽ 0.232). Noting that prior studies have demonstrated higher correlations between regions that are closer together and visa versa (Sal-
vador et al., 2005), we sought to determine whether this effect of distance might have confounded our results. For each pair of homotopic regions, we calculated the Euclidean distance between left and right centroids (centers of mass). We then constructed a regression model with Euclidean distance and hierarchical subdivision as independent variables and interhemispheric correlation as the dependent variable. As expected, shorter Euclidean distance significantly correlated with higher degree of interhemispheric correlation (coefficient ⫽ ⫺0.003, t ⫽ ⫺0.558, p ⬍ 0.001) (Fig. 6 B). However this distance effect was independent of a higher-magnitude relationship between hierarchical subdivision and interhemispheric correlation (coefficient ⫽ ⫺0.089, t ⫽ ⫺0.347, p ⬍ 0.007). Thus, the relationship between hierarchical subdivision and interhemispheric correlation described above and discussed in detail below cannot be attributed to an effect of interregional distance.
Stark et al. • Variation in Interhemispheric Coordination
J. Neurosci., December 17, 2008 • 28(51):13754 –13764 • 13759
Figure 4. Homotopic interhemispheric correlations. A, Regional masks are labeled according to their functional classification, as described by Mesulam (2000). These classifications were used to model interhemispheric correlation as a function of hierarchical subdivision. B, Mean interhemispheric correlation strengths indicated for all cortical regions. Primary sensory-motor cortices exhibit significantly stronger correlations than unimodal association areas, which exhibit significantly stronger correlations than heteromodal association areas.
Stark et al. • Variation in Interhemispheric Coordination
13760 • J. Neurosci., December 17, 2008 • 28(51):13754 –13764
To minimize effects because of interindividual anatomical variability, regional time series were weighted according to each voxel’s probability of inclusion in a given region. To test the extent to which this probability-weighting influenced our results, we also conducted two sets of additional analyses without probabilityweighting, using regional masks thresholded to include only voxels with a ⬎50% and 25% probability of inclusion, with all included voxels given equal weighting. Even without probability-weighting, 50% thresholding yielded a nearly identical gradient of decreasing interhemispheric correlation from primary, to unimodal, to heteromodal association areas (primary versus heteromodal, t ⫽ 12.46 with 3281 df, p ⬍ 0.0001; primary versus unimodal, t ⫽ 9.89 with 3281 df, p ⬍ 0.0001; unimodal versus heteromodal, t ⫽ 4.62 with 3281 df, p ⬍ 0.0001). Analyses using less stringent thresholding of 25% still yielded highly similar results (primary versus heteromodal, t ⫽ 23.36 with 3405 df, p ⬍ 0.0001; primary versus unimodal, t ⫽ 14.99 with 3405 df, p ⬍ 0.0001; unimodal versus heteromodal, t ⫽ 13.95 with 3405 df, p ⬍ 0.0001). Thus, probabilityweighting did not appear to systematically affect our results. Finally, in recognition of the fact that higher-order regions are anatomically less well-defined and tend to exhibit greater interindividual variability, we repeated our analyses, replacing the regional masks with spherical regions of interest (radius ⫽ 4 mm) placed at the centroid of each regional mask. This approach minimizes interregional differences in accuracy of anatomical labeling and eliminates volumetric differences. Despite this more restrictive method of data sampling, the relationship between hierarchical subdivision and interhemispheric correlation was preserved (primary versus heteromodal, t ⫽ 6.48 with 3405 df, p ⬍ 0.0001; primary versus unimodal, t ⫽ 5.25 with 3405 df, p ⬍ 0.0001; unimodal versus heteromodal, t ⫽ 2.38 with 3405 df, p ⫽ 0.017) (supplemental Fig. 1, available at www.jneurosci.org as supplemental material).
Discussion
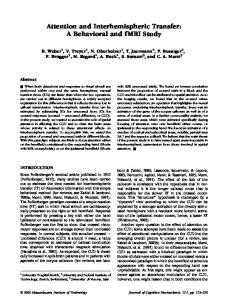
Figure 5. Interhemispheric correlation as a function of hierarchical subdivision. Scatterplots of interhemispheric correlation, organized by hierarchical subdivision and plotted to demonstrate: A, all data points (each data point represents homotopic interhemispheric correlation for one region in one subject); B, subject distribution (each data point represents one subject’s mean interhemispheric correlation averaged across primary, unimodal, or heteromodal regions, respectively); and C, region distribution (each data point represents one region’s mean interhemispheric correlation averaged across all subjects). Primary sensory-motor cortices demonstrated a significantly higher degree of interhemispheric correlation than either unimodal association areas or heteromodal association areas. Unimodal association areas showed significantly higher interhemispheric correlations than heteromodal association areas. D, Within each sensory-motor modality, primary cortices exhibited a high degree of correlated activity across hemispheres, with decreased interhemispheric correlations in unimodal association areas. This decrease was significant in somatosensory, visual, and motor modalities but did not reach significance in the auditory system when corrected for multiple comparisons.
Figure 6. Interhemispheric correlation as a function of regional volume and interregional distance. A, No relationship was observed between a region’s total volume (left plus right) and interhemispheric correlation. B, Consistent with previous studies, the distance between left and right homotopic regions was inversely related to interhemispheric correlation. This relationship was independent of the relationship observed between hierarchical subdivision and interhemispheric correlation.
Consistent with previous studies, we found that spontaneous brain activity is highly correlated between homotopic regions in opposite hemispheres (Salvador et al., 2005). We further demonstrate substantial regional variation in degree of interhemispheric correlation, with a gradient of highest correlations across primary sensory-motor cortices and lower correlations across prefrontal and temporoparietal heteromodal association areas. These results echo neuroanatomical findings and likely
reflect the distributed hierarchical nature of processing in the brain. Until recently, studies of interhemispheric coherence have focused on higher frequency (1– 80 Hz) electrical activity. Demonstration of interhemispheric correlation in low-frequency (⬍0.1 Hz) spontaneous hemodynamic fluctuations here and in previ-
Stark et al. • Variation in Interhemispheric Coordination
ous resting-state fMRI studies raises the question of whether the two types of phenomena are related, as well as their potential functional significance. Low-frequency correlated activity may provide an energy-efficient means of maintaining synaptic connections that comprise long-range functional networks (Pinsk and Kastner, 2007). Such activity may reflect development and experience, as it is refined through childhood and adolescence (Fair et al., 2007). In contrast, high-frequency correlated activity is thought to reflect moment-to-moment processing demands such as perceptual integration and motor coordination (Schnitzler et al., 2000; Mima et al., 2001). Whereas these two frequency ranges of synchronous activity reflect widely different temporal scales, their possible interaction is increasingly being entertained. For example, trial-to-trial variability in behavioral and cognitive performance has been linked to variations in spontaneous low-frequency activity (Fox et al., 2007; Kelly et al., 2008b). Furthermore, work combining fMRI and EEG has related hemodynamic fluctuations in resting-state networks to power variations in ␦, , ␣, , and ␥ rhythms (Mantini et al., 2007). Amplitude fluctuations of interhemispherically coherent high-frequency activity have been demonstrated at much slower time scales ranging from seconds to minutes (Linkenkaer-Hansen et al., 2001; Nikouline et al., 2001) and such variations correlate well with hemodynamic fluctuations (Logothetis et al., 2001; Leopold et al., 2003; Niessing et al., 2005; Shmuel and Leopold, 2008). Thus we propose, as have others, that low-frequency and higher frequency phenomena are interrelated (Buzsaki and Draguhn, 2004). The use of resting-state fMRI allowed us to appreciate regional differences in interhemispheric correlation as hypothesized. We speculate that the high degree of synchrony observed across primary cortices reflects networks engaged in interhemispheric relay of information essential for bilateral sensory integration and motor coordination. For example, synchronous gamma-band activity in visual cortex is thought to allow temporal binding of distributed visual features into a coherent percept (Gray et al., 1989; Engel et al., 1991; Singer, 1999). Similarly, the motor system appears to maintain a default state of interhemispheric coupling important for bilateral motor coordination (Schnitzler et al., 2000; Cardoso de Oliveira et al., 2001; Gerloff and Andres, 2002). In contrast, heteromodal association areas displayed a lower degree of interhemispheric coordination, presumably reflecting the predisposition of higher-order homotopic regions to operate more independently. Lesion, neuropsychological, and neuroimaging studies demonstrate that association areas exhibit substantial functional lateralization for certain cognitive domains (Toga and Thompson, 2003). Language production and comprehension (Frost et al., 1999; Price, 2000) and spatial attention (Shepard and Metzler, 1971; Ditunno and Mann, 1990) are predominantly lateralized to left and right hemispheres, respectively. Of note, studies comparing correlated brain activity at rest and during task performance demonstrate that interregional coordination may shift according to task demands (Hampson et al., 2006). The lower degree of interhemispheric coordination observed within higher-order regions may increase under conditions of greater computational complexity (Belger and Banich, 1992). Similarly, dynamic uncoupling of bilateral primary motor regions via local inhibitory connections may allow performance of more complex unilateral tasks (Cardoso de Oliveira et al., 2001; Rokni et al., 2003; Wahl et al., 2007). The high overall degree of interhemispheric synchrony we observed is consistent with a large body of neuroanatomical and functional evidence (Pandya et al., 1971; Innocenti, 1986; Duffy
J. Neurosci., December 17, 2008 • 28(51):13754 –13764 • 13761
et al., 1996; Toro et al., 2008). Moreover, the importance of an intact corpus callosum is suggested by studies in which interhemispheric synchrony, measured variably by microelectrode recording, EEG, or resting-state fMRI, is abolished or decreased with perturbations of callosal integrity including agenesis, transection, or demyelinating disease (Montplaisir et al., 1990; Engel et al., 1991; Quigley et al., 2003; Lowe et al., 2008). In considering possible neuroanatomical foundations of regional variation in interhemispheric synchrony, we note that oscillatory synchronization of distributed neuronal assemblies may be impacted by microstructural determinants of conduction velocity, such as fiber diameter (Innocenti et al., 1995; Schuz and Preissl, 1996; Aboitiz et al., 2003; Buzsaki and Draguhn, 2004; Uhlhaas and Singer, 2006). Meticulous work by LaMantia and Rakic (1990b) in monkeys, and Aboitiz and colleagues (1992) in humans has demonstrated that primary sensory-motor and heteromodal association areas differ in the diameters of their interhemispheric callosal projections. Primary sensory-motor cortices are interconnected via a subset of thickly myelinated, fastconducting fibers, whereas heteromodal association areas are interconnected via thinly myelinated, slow-conducting fibers. The degree to which regional differences in interhemispheric correlation may depend on variation in fiber diameters and conduction velocities will be addressed in future studies. Still, we note that ours and previous studies demonstrate a high degree of interhemispheric correlation across primary visual cortex, a region with limited callosal projections (Tootell et al., 1998; Vincent et al., 2007). Indeed, persistence of residual interhemispheric correlation in some split-brain patients (CorsiCabrera et al., 1995; Uddin et al., 2008b) and conversely, decreased interhemispheric correlation in a patient with an ischemic brainstem lesion (Salvador et al., 2005) suggest that subcortical pathways may also contribute to interhemispheric coordination of spontaneous activity. Top-down pathways may facilitate synchronization as well; primary visual cortex in particular exhibits reentrant feedback from higher-order visual areas (Lamme and Roelfsema, 2000; Ban et al., 2006). Thus, whereas direct callosal connections are likely the predominant driving force behind homotopic interhemispheric correlations, subcortical and polysynaptic feedback and feedforward mechanisms may also contribute. Impaired interhemispheric coordination may underlie a variety of disorders including schizophrenia (Spencer et al., 2003; Liang et al., 2006), Alzheimer’s disease (Lakmache et al., 1998; Pogarell et al., 2005), multiple sclerosis (Cover et al., 2006; Lowe et al., 2008) attention-deficit/hyperactivity disorder (Clarke et al., 2008), and acute spatial neglect after stroke (He et al., 2007). Our methods may be useful in future study of these diverse disease processes. Additionally, anatomical and functional interhemispheric connectivity appears to undergo lifelong changes, especially during early development and in normal aging (LaMantia and Rakic, 1990a; Cabeza, 2002; Fair et al., 2007). Examination of developmental changes in interhemispheric coordination may prove informative, particularly as region-specific changes have been noted (Bartzokis et al., 2004; Sullivan et al., 2006). Whereas regional variation in interhemispheric correlation closely paralleled presumptive differences in functional lateralization, several deviations from this pattern merit discussion. First, primary auditory cortex (Heschl’s gyrus) exhibited a lower, albeit still high, degree of interhemispheric correlation relative to other primary sensory-motor cortices, and demonstrated slightly lower correlation than planum temporale, an abutting perisylvian auditory association area. Delineation of these small and
13762 • J. Neurosci., December 17, 2008 • 28(51):13754 –13764
highly variable perisylvian regions has proven problematic in previous studies, and this difficulty may have been reflected in our results (Westbury et al., 1999; Zetzsche et al., 2001). Second, precuneus and paracingulate gyrus, both heteromodal association areas, demonstrated high interhemispheric correlations, most likely because of the close proximity of these medial wall structures to their homotopic counterparts. Post hoc analysis demonstrated a secondary independent relationship between proximity and correlation strength (see Analysis of potential confounds in the Results section). Still, the presence of decreasing interhemispheric correlations along the anterior medial wall, mirroring known dorsal-ventral distinctions (Bush et al., 2000), suggests that results obtained from medial wall structures are valid. Whereas the present study discerned a broad pattern of varying interhemispheric coordination, future work could benefit from using more localized and individual-specific methods of anatomic parcellation (Cohen et al., 2008). Several additional limitations merit attention. We considered whether volumetric differences in regional masks, probability weighting, and method of anatomic parcellation may have influenced our results (see Analysis of potential confounds in the Results section). However, we found no effect of these factors on our pattern of results. We also considered whether the low degree of frontal pole interhemispheric correlation, whereas consistent with its implication in functionally lateralized higher-order processing, may be attributable to susceptibility artifact. Nevertheless, other structures in the vicinity of frontal air-filled sinuses, including frontal medial cortex and subcallosal cortex, exhibited higher degrees of interhemispheric correlation, suggesting that susceptibility artifact did not impose a systematic effect on our results. Finally, it might be argued that bilateral sensory inputs during scanning might drive high interhemispheric correlation in primary sensory areas. However, correlated fluctuations persist across a variety of conditions including sleep and anesthesia (Fox et al., 2006; Fox and Raichle, 2007; Vincent et al., 2007). In summary, we report a pattern of regional variation in low-frequency temporally correlated brain activity across hemispheres, suggesting that interhemispheric coordination may differ across regions. Despite robust homotopic interhemispheric correlation across all regions, lower interhemispheric correlation was demonstrated in higher-order heteromodal association areas compared with primary sensorymotor cortices, potentially reflective of regional functional lateralization within the brain. Future work could benefit from addressing this pattern in the context of developmental changes, different clinical populations, and as it relates to regional variation in white matter structure.
References Aboitiz F, Lo´pez J, Montiel J (2003) Long distance communication in the human brain: timing constraints for inter-hemispheric synchrony and the origin of brain lateralization. Biol Res 36:89 –99. Aboitiz F, Scheibel AB, Fisher RS, Zaidel E (1992) Fiber composition of the human corpus callosum. Brain Res 598:143–153. Ban H, Yamamoto H, Fukunaga M, Nakagoshi A, Umeda M, Tanaka C, Ejima Y (2006) Toward a common circle: interhemispheric contextual modulation in human early visual areas. J Neurosci 26:8804 – 8809. Bartzokis G, Sultzer D, Lu PH, Nuechterlein KH, Mintz J, Cummings JL (2004) Heterogeneous age-related breakdown of white matter structural integrity: implications for cortical “disconnection” in aging and Alzheimer’s disease. Neurobiol Aging 25:843– 851. Belger A, Banich MT (1992) Interhemispheric interaction affected by computational complexity. Neuropsychologia 30:923–929. Biswal B, Yetkin FZ, Haughton VM, Hyde JS (1995) Functional connectiv-
Stark et al. • Variation in Interhemispheric Coordination ity in the motor cortex of resting human brain using echo-planar MRI. Magn Reson Med 34:537–541. Bush G, Luu P, Posner MI (2000) Cognitive and emotional influences in anterior cingulate cortex. Trends Cogn Sci 4:215–222. Buzsa´ki G, Draguhn A (2004) Neuronal oscillations in cortical networks. Science 304:1926 –1929. Cabeza R (2002) Hemispheric asymmetry reduction in older adults: the HAROLD model. Psychol Aging 17:85–100. Cardoso de Oliveira S, Gribova A, Donchin O, Bergman H, Vaadia E (2001) Neural interactions between motor cortical hemispheres during bimanual and unimanual arm movements. Eur J Neurosci 14:1881–1896. Castellanos FX, Margulies DS, Kelly C, Uddin LQ, Ghaffari M, Kirsch A, Shaw D, Shehzad Z, Di Martino A, Biswal B, Sonuga-Barke EJ, Rotrosen J, Adler LA, Milham MP (2008) Cingulate-precuneus interactions: a new locus of dysfunction in adult attention-deficit/hyperactivity disorder. Biol Psychiatry 63:332–337. Clarke AR, Barry RJ, Heaven PC, McCarthy R, Selikowitz M, Byrne MK (2008) EEG coherence in adults with Attention-Deficit/Hyperactivity Disorder. Int J Psychophysiol 67:35– 40. Cohen AL, Fair DA, Dosenbach NU, Miezin FM, Dierker D, Van Essen DC, Schlaggar BL, Petersen SE (2008) Defining functional areas in individual human brains using resting functional connectivity MRI. Neuroimage 41:45–57. Cordes D, Haughton VM, Arfanakis K, Wendt GJ, Turski PA, Moritz CH, Quigley MA, Meyerand ME (2000) Mapping functionally related regions of brain with functional connectivity MR imaging. AJNR Am J Neuroradiol 21:1636 –1644. Corsi-Cabrera M, Trías G, Guevara MA, Haro R, Herna´ndez A (1995) EEG interhemispheric correlation after callosotomy: one case study. Percept Mot Skills 80:504 –506. Cover KS, Vrenken H, Geurts JJ, van Oosten BW, Jelles B, Polman CH, Stam CJ, van Dijk BW (2006) Multiple sclerosis patients show a highly significant decrease in alpha band interhemispheric synchronization measured using MEG. Neuroimage 29:783–788. Damoiseaux JS, Rombouts SA, Barkhof F, Scheltens P, Stam CJ, Smith SM, Beckmann CF (2006) Consistent resting-state networks across healthy subjects. Proc Natl Acad Sci U S A 103:13848 –13853. Di Martino A, Scheres A, Margulies DS, Kelly AM, Uddin LQ, Shehzad Z, Biswal B, Walters JR, Castellanos FX, Milham MP (2008) Functional connectivity of human striatum: a resting state fMRI study. Cereb Cortex. Advance online publication. Retrieved November 6, 2008. doi: 10.1093/cercor/bhn041 Ditunno PL, Mann VA (1990) Right hemisphere specialization for mental rotation in normals and brain damaged subjects. Cortex 26:177–188. Duffy FH, Mcanulty GB, Albert MS (1996) Effects of age upon interhemispheric EEG coherence in normal adults. Neurobiol Aging 17:587–599. Engel A, Konig P, Kreiter A, Singer W (1991) Interhemispheric synchronization of oscillatory neuronal responses in cat visual cortex. Science 252:1177–1179. Fair DA, Dosenbach NU, Church JA, Cohen AL, Brahmbhatt S, Miezin FM, Barch DM, Raichle ME, Petersen SE, Schlaggar BL (2007) Development of distinct control networks through segregation and integration. Proc Natl Acad Sci U S A 104:13507–13512. Fox MD, Raichle ME (2007) Spontaneous fluctuations in brain activity observed with functional magnetic resonance imaging. Nat Rev Neurosci 8:700 –711. Fox MD, Snyder AZ, Zacks JM, Raichle ME (2006) Coherent spontaneous activity accounts for trial-to-trial variability in human evoked brain responses. Nat Neurosci 9:23–25. Fox MD, Snyder AZ, Vincent JL, Raichle ME (2007) Intrinsic fluctuations within cortical systems account for intertrial variability in human behavior. Neuron 56:171–184. Fransson P (2005) Spontaneous low-frequency BOLD signal fluctuations: an fMRI investigation of the resting-state default mode of brain function hypothesis. Hum Brain Mapp 26:15–29. Frost JA, Binder JR, Springer JA, Hammeke TA, Bellgowan PS, Rao SM, Cox RW (1999) Language processing is strongly left lateralized in both sexes: evidence from functional MRI. Brain 122:199 –208. Gerloff C, Andres FG (2002) Bimanual coordination and interhemispheric interaction. Acta Psychol (Amst) 110:161–186. Gray CM, Ko¨nig P, Engel AK, Singer W (1989) Oscillatory responses in cat
Stark et al. • Variation in Interhemispheric Coordination visual cortex exhibit inter-columnar synchronization which reflects global stimulus properties. Nature 338:334 –337. Greicius MD, Kiviniemi V, Tervonen O, Vainionpaa V, Alahuhta S, Reiss AL, Menon V (2008) Persistent default-mode network connectivity during light sedation. Hum Brain Mapp 29:839 – 847. Hampson M, Driesen NR, Skudlarski P, Gore JC, Constable RT (2006) Brain connectivity related to working memory performance. J Neurosci 26:13338 –13343. He BJ, Snyder AZ, Vincent JL, Epstein A, Shulman GL, Corbetta M (2007) Breakdown of functional connectivity in frontoparietal networks underlies behavioral deficits in spatial neglect. Neuron 53:905–918. Innocenti GM (1986) General organization of callosal connections in the cerebral cortex. In: Cerebral Cortex, Vol 5, Sensory-motor areas and aspects of cortical connectivity (Jones EG, Peters A, eds), pp 291–353. New York: Plenum. Innocenti GM, Aggoun-Zouaoui D, Lehmann P (1995) Cellular aspects of callosal connections and their development. Neuropsychologia 33:961–987. Johnston JM, Vaishnavi SN, Smyth MD, Zhang D, He BJ, Zempel JM, Shimony JS, Snyder AZ, Raichle ME (2008) Loss of resting interhemispheric functional connectivity after complete section of the corpus callosum. J Neurosci 28:6453– 6458. Kelly AM, Di Martino A, Uddin LQ, Shehzad Z, Gee DG, Reiss PT, Margulies DS, Castellanos FX, Milham MP (2008a) Development of anterior cingulate functional connectivity from late childhood to early adulthood. Cereb Cortex. Advance online publication. Retrieved November 6, 2008. doi:10.1093/cercor/bhn117 Kelly AM, Uddin LQ, Biswal BB, Castellanos FX, Milham MP (2008b) Competition between functional brain networks mediates behavioral variability. Neuroimage 39:527–537. Kennedy DN, Lange N, Makris N, Bates J, Meyer J, Caviness VS Jr (1998) Gyri of the human neocortex: an MRI-based analysis of volume and variance. Cereb Cortex 8:372–384. Koeda T, Knyazeva M, Njiokiktjien C, Jonkman EJ, De Sonneville L, Vildavsky V (1995) The EEG in acallosal children: coherence values in the resting state: left hemisphere compensatory mechanism? Electroencephalogr Clin Neurophysiol 95:397– 407. Lakmache Y, Lassonde M, Gauthier S, Frigon JY, Lepore F (1998) Interhemispheric disconnection syndrome in Alzheimer’s disease. Proc Natl Acad Sci U S A 95:9042–9046. LaMantia AS, Rakic P (1990a) Axon overproduction and elimination in the corpus callosum of the developing rhesus monkey. J Neurosci 10:2156 –2175. Lamantia AS, Rakic P (1990b) Cytological and quantitative characteristics of four cerebral commissures in the rhesus monkey. J Comp Neurol 291:520 –537. Lamme VA, Roelfsema PR (2000) The distinct modes of vision offered by feedforward and recurrent processing. Trends Neurosci 23:571–579. Leopold DA, Murayama Y, Logothetis NK (2003) Very slow activity fluctuations in monkey visual cortex: implications for functional brain imaging. Cereb Cortex 13:422– 433. Liang M, Zhou Y, Jiang T, Liu Z, Tian L, Liu H, Hao Y (2006) Widespread functional disconnectivity in schizophrenia with resting-state functional magnetic resonance imaging. Neuroreport 17:209 –213. Linkenkaer-Hansen K, Nikouline VV, Palva JM, Ilmoniemi RJ (2001) Long-range temporal correlations and scaling behavior in human brain oscillations. J Neurosci 21:1370 –1377. Logothetis NK, Pauls J, Augath M, Trinath T, Oeltermann A (2001) Neurophysiological investigation of the basis of the fMRI signal. Nature 412:150 –157. Lowe MJ, Mock BJ, Sorenson JA (1998) Functional connectivity in single and multislice echoplanar imaging using resting-state fluctuations. Neuroimage 7:119 –132. Lowe MJ, Beall EB, Sakaie KE, Koenig KA, Stone L, Marrie RA, Phillips MD (2008) Resting state sensorimotor functional connectivity in multiple sclerosis inversely correlates with transcallosal motor pathway transverse diffusivity. Hum Brain Mapp 29:818 – 827 Makris N, Meyer JW, Bates JF, Yeterian EH, Kennedy DN, Caviness VS (1999) MRI-Based topographic parcellation of human cerebral white matter and nuclei II. Rationale and applications with systematics of cerebral connectivity. Neuroimage 9:18 – 45. Mantini D, Perrucci MG, Del Gratta C, Romani GL, Corbetta M (2007)
J. Neurosci., December 17, 2008 • 28(51):13754 –13764 • 13763 Electrophysiological signatures of resting state networks in the human brain. Proc Natl Acad Sci U S A 104:13170 –13175. Margulies DS, Kelly AM, Uddin LQ, Biswal BB, Castellanos FX, Milham MP (2007) Mapping the functional connectivity of anterior cingulate cortex. Neuroimage 37:579 –588. Mesulam M (2000) Principles of behavioral and cognitive neurology. New York: Oxford University. Mima T, Oluwatimilehin T, Hiraoka T, Hallett M (2001) Transient interhemispheric neuronal synchrony correlates with object recognition. J Neurosci 21:3942–3948. Montplaisir J, Nielsen T, Coˆte´ J, Boivin D, Rouleau I, Lapierre G (1990) Interhemispheric EEG coherence before and after partial callosotomy. Clin Electroencephalogr 21:42– 47. Nielsen T, Montplaisir J, Lassonde M (1993) Decreased interhemispheric EEG coherence during sleep in agenesis of the corpus callosum. Eur Neurol 33:173–176. Niessing J, Ebisch B, Schmidt KE, Niessing M, Singer W, Galuske RA (2005) Hemodynamic signals correlate tightly with synchronized gamma oscillations. Science 309:948 –951. Nikouline VV, Linkenkaer-Hansen K, Huttunen J, Ilmoniemi RJ (2001) Interhemispheric phase synchrony and amplitude correlation of spontaneous beta oscillations in human subjects: a magnetoencephalographic study. Neuroreport 12:2487–2491. Pandya DN, Karol EA, Heilbronn D (1971) The topographical distribution of interhemispheric projections in the corpus callosum of the rhesus monkey. Brain Res 32:31– 43. Pinheiro J, Bates D, DebRoy S, Sarkar D, R Core Team (2006) nlme: Linear and nonlinear mixed effects models: R package version 3.1–74. Pinsk MA, Kastner S (2007) Neuroscience: unconscious networking. Nature 447:46 – 47. Pogarell O, Teipel SJ, Juckel G, Gootjes L, Mo¨ller T, Burger K, Leinsinger G, Mo¨ller HJ, Hegerl U, Hampel H (2005) EEG coherence reflects regional corpus callosum area in Alzheimer’s disease. J Neurol Neurosurg Psychiatry 76:109 –111. Price CJ (2000) The anatomy of language: contributions from functional neuroimaging. J Anat 197:335–359. Quigley M, Cordes D, Turski P, Moritz C, Haughton V, Seth R, Meyerand ME (2003) Role of the corpus callosum in functional connectivity. AJNR Am J Neuroradiol 24:208 –212. Rokni U, Steinberg O, Vaadia E, Sompolinsky H (2003) Cortical representation of bimanual movements. J Neurosci 23:11577–11586. Salvador R, Suckling J, Coleman MR, Pickard JD, Menon D, Bullmore E (2005) Neurophysiological architecture of functional magnetic resonance images of human brain. Cereb Cortex 15:1332–1342. Schnitzler A, Gross J, Timmermann L (2000) Synchronised oscillations of the human sensorimotor cortex. Acta Neurobiol Exp (Wars) 60:271–287. Schu¨z A, Preissl H (1996) Basic connectivity of the cerebral cortex and some considerations on the corpus callosum. Neurosci Biobehav Rev 20:567–570. Shepard RN, Metzler J (1971) Mental rotation of three-dimensional objects. Science 171:701–703. Shmuel A, Leopold DA (2008) Neuronal correlates of spontaneous fluctuations in fMRI signals in monkey visual cortex: implications for functional connectivity at rest. Hum Brain Mapp. Advance online publication. Retrieved November 7, 2008. doi:10.1002/hbm.20580 Singer W (1999) Neuronal synchrony: a versatile code for the definition of relations? Neuron 24:49 – 65:111–125. Spencer KM, Nestor PG, Niznikiewicz MA, Salisbury DF, Shenton ME, McCarley RW (2003) Abnormal neural synchrony in schizophrenia. J Neurosci 23:7407–7411. Sullivan EV, Adalsteinsson E, Pfefferbaum A (2006) Selective age-related degradation of anterior callosal fiber bundles quantified in vivo with fiber tracking. Cereb Cortex 16:1030 –1039. Toga AW, Thompson PM (2003) Mapping brain asymmetry. Nat Rev Neurosci 4:37– 48. Tomasch J (1954) Size, distribution, and number of fibres in the human corpus callosum. Anat Rec 119:119 –135. Tootell RB, Mendola JD, Hadjikhani NK, Liu AK, Dale AM (1998) The representation of the ipsilateral visual field in human cerebral cortex. Proc Natl Acad Sci U S A 95:818 – 824. Toro R, Fox PT, Paus T (2008) Functional coactivation map of the human
13764 • J. Neurosci., December 17, 2008 • 28(51):13754 –13764 brain. Cereb Cortex. Advance online publication. Retrieved November 7, 2008. doi:10.1093/cercor/bhn014 Uddin LQ, Clare Kelly AM, Biswal BB, Xavier Castellanos F, Milham MP (2008a) Functional connectivity of default mode network components: correlation, anticorrelation, and causality. Hum Brain Mapp. Advance online publication. Retrieved February 18, 2008. doi:10.1002/hbm.20531 Uddin LQ, Mooshagian E, Zaidel E, Scheres A, Margulies DS, Kelly AM, Shehzad Z, Adelstein JS, Castellanos FX, Biswal BB, Milham MP (2008b) Residual functional connectivity in the split-brain revealed with restingstate functional MRI. Neuroreport 19:703–709. Uhlhaas PJ, Singer W (2006) Neural synchrony in brain disorders: relevance for cognitive dysfunctions and pathophysiology. Neuron 52:155–168. Vincent JL, Patel GH, Fox MD, Snyder AZ, Baker JT, Van Essen DC, Zempel
Stark et al. • Variation in Interhemispheric Coordination JM, Snyder LH, Corbetta M, Raichle ME (2007) Intrinsic functional architecture in the anaesthetized monkey brain. Nature 447:83– 86. Wahl M, Lauterbach-Soon B, Hattingen E, Jung P, Singer O, Volz S, Klein JC, Steinmetz H, Ziemann U (2007) Human motor corpus callosum: topography, somatotopy, and link between microstructure and function. J Neurosci 27:12132–12138. Westbury CF, Zatorre RJ, Evans AC (1999) Quantifying variability in the planum temporale: a probability map. Cereb Cortex 9:392– 405. Zetzsche T, Meisenzahl EM, Preuss UW, Holder JJ, Kathmann N, Leinsinger G, Hahn K, Hegerl U, Mo¨ller HJ (2001) In-vivo analysis of the human planum temporale (PT): does the definition of PT borders influence the results with regard to cerebral asymmetry and correlation with handedness? Psychiatry Res 107:99 –115.