The Ivanpah sam-. Table 2. Ground-level tropospheric concentrations during. 1977-1978. Latitude. Sampling location. Date ppmv. 55.50N. Ketchikan, AK. 1/21/ ...
Proc. Nati Acad. Sci. USA Vol. 79, pp. 1366-1370, February 1982 Chemistry
Methane: Interhemispheric concentration gradient and atmospheric residence time (atmospheric OH/trace composition/interhemispheric transport/Amazon basin)
EDWARD W. MAYER*, DONALD R. BLAKE, STANLEY C. TYLER, YOSHIHIRO MAKIDEt, DEREK C. MONTAGUEt, AND F. SHERWOOD ROWLAND§ Department of Chemistry, University of California, Irvine, California 92717
Contributed by F. S. Rowland, November 9, 1981
ABSTRACT The ground level concentrations of methane in the atmosphere have been measured to be in the range from 1.45 to 1.62 parts per million by volume (ppmv) of dry air in remote locations between 620N and 540S latitudes during the time period from November 1977 to July 1979. The average (±rms) concentration for the northern hemisphere was 1.57 ± 0.02 ppmv in January 1978 and 1.59 ± 0.02 in July 1979. The average concentration in the southern hemisphere was lower-1.47 + 0.02 in January 1978 and 1.51 ± 0.01 in July 1979. The ratio of concentrations between the two hemispheres was 1.068 ± 0.016 in January 1978 and 1.055 ± 0.013 in July 1979, for an average of 1.06 ± 0.01. The higher concentrations in the northern hemisphere require either that the sources of methane lie preferentially in the northern hemisphere or that the removal processes operate more rapidly in the southern hemisphere or both. The primary removal process for CH4 is reaction with tropospheric OH radicals and its estimated atmospheric lifetime is 10.5 ± 1.8 yr. The observed interhemispheric gradient is consistent with this lifetime and preferential release of methane in the northern hemisphere. Measurements taken in the Amazon basin region indicate the presence of a substantial source of methane in that area.
The major hydrocarbon present in the natural atmosphere of the earth is methane, which is found in a relative concentration of =1.6 parts per million by volume (ppmv) throughout the troposphere (1-3). Most hydrogen and most carbon in the atmosphere are found in oxidized forms, and CH4 is subject to relatively rapid oxidation to other chemical forms. The major sources for the continuous replenishment of atmospheric CH4 certainly involve gaseous evolution from biological material under anaerobic conditions-e.g., rice paddies, swamps, enteric fermentation, etc.-but are not known in any precise quantitative detail. The overall biological origin of most of the atmospheric CH4 is inferred from the near-equivalence between the '4C/'2C ratio in it to that in living material that draws both 12CO2 and 14Co2 from the atmosphere (1-4). Any carbonaceous material isolated for >20,000 yr from exchange with the cosmic ray-produced atmospheric 14C reservoir will have a negligible 14C content. Hence, the contribution to atmospheric CH4 from the flaring of natural gas, or by volcanoes, earthquakes, etc. (5), cannot be major because these sources should be essentially devoid of 14C. Ehhalt (3) has placed an upper limit of 10% on the nonbiogenic sources of CH4. Methane has been known as a component of the atmosphere since 1948 (6), and several groups have reported (Table 1) higher concentrations in the northern than in the southern hemispheres (7-15, ¶). A consensus developed in the late 1970s that a concentration gradient does indeed exist between the two hemispheres. Ehhalt (10) has further demonstrated that the The publication costs ofthis article were defrayed in part by page charge payment. This article must therefore be hereby marked "advertisement" in accordance with 18 U. S. C. §1734 solely to indicate this fact.
presence of N/S hemispheric gradients in methane concentrations provides some boundary conditions on the atmospheric residence time of CH4 and upon the N/S distribution of its sources and sinks. During 1977-1979 we carried out three series of measurements of CH4 concentrations in tropospheric samples collected in remote locations at the surface between 620N and 540S latitudes, and we have consistently observed a N/S gradient with =5-7% higher concentrations in the north than in the south. The removal of CH4 from the atmosphere is usually assumed to occur almost entirely by reaction 1 with OH radicals, OH + CH4-* H20 + CH3, [1] with most of this attack occurring in the lowest 6 km of the atmosphere. Quantitative estimates of the overall rate of this reaction are limited by the current imprecision in the knowledge of worldwide concentrations of OH in both time and space. In the absence ofbetter information concerning sources and sinks, the atmospheric residence time of CH4 has not yet been well established and further data can be very useful. Previous estimates of the atmospheric residence time for CH4 have ranged from 1.5 (16) or 2 (17) yr to much longer times of 21.5 (12) or 29 (18) yr. Ehhalt (10) has recently estimated a most probable value of about 5 yr with a range from 2.5 to 11 yr. The variations in CH4 concentrations in our samples correlate well with the variations in CH3CC13 concentrations measured in the same canisters, for which a considerably larger N/S gradient was observed (19). Because the major removal process for CH3CC13 also involves reaction with OH radicals in the troposphere, as in Eq. 2, OH + CH3CC13 -- H20 + C2H2C13, [2] measurement and evaluation of CH4 and CH3CC13 concentrations from the same air parcels can provide still further information about the sources for CH4 and the geographical location of the sinks for both compounds. The CH3CC13 is released to the atmosphere anthropogenically, with about 95% going first into the northern hemisphere, most of it in the temperate zone. The annual release rates for CH3CC13 have risen sharply during the past decade. The observation of a N/S hemispheric gradient in the conAbbreviations: ppmv, concentration in parts per 106 by volume; ITCZ, Intertropical Convergence Zone, meteorologically separating northern and southern hemispheres; N/S, north/south; NBS, National Bureau of Standards. * Present address: United States Army Command and General Staff School, Leavenworth, KS 66048. tPresent address: Dept. of Chemistry, Univ. Tokyo, Tokyo, Japan. t Present address: Dept. of Atmospheric Sciences, Univ. California, Los Angeles, CA 90024. § To whom reprint requests should be addressed. Mayer, E. W., Makide, Y. & Rowland, F. S., Division of Environmental Chemistry, American Chemical Society, Honolulu, HI, April 1-6, 1979.
Chemistry: Mayer et al.
Proc. Natl. Acad. Sci. USA 79 (1982)
Table 1. Measurements of N/S interhemispheric gradients in CH4 concentrations Northern Latitude Time period Ref. N/S ratio Concentration Infrared spectroscopy, concentrations in atm-cm 130N-570N 1.2 1.46-1.58 7 Mar.-Apr. 1975 Instrumental gas analysis, concentrations in ppmv 70N-330N 1.44 ± 0.04 1.06 Nov.-Dec. 1972 8, 9 1.40 ± 0.02 00-300N 1.08 Nov.-Dec. 1972 10 11* 1.08 1.68 Nov.-Dec. 1972 1.43 ± 0.07 0W-650N 1.03 Sep.-Dec. 1977 12, 13 1.58 1.07 100N-560N Jan. 1978 t 1.72 N of 200N 14 1.06 Apr.-May 1978 1.595 450N 15 1.06 May 1979 1.565 ± 0.017 1.068 ± 0.016 100N-560N This work Jan. 1978 1.055 ± 0.013 1.593 ± 0.020 This work July 1979 100N-620N
1367
Southern Latitude Concentration
1.22-1.40
23OS-67oS
1.36 ± 0.04 1.30 ± 0.01 1.56 1.39 ± 0.05 1.47 1.62 1.510 1.466 ± 0.015 1.509 ± 0.005
50N-750S 50N-750S 0V-900S 20OS-54OS S of ITCZ 430S 20OS-54OS 80S-54OS
N/S, north/south; ITCZ, Intertropical Convergence Zone. * Data of ref. 10 corrected upward by 1.2 from calibration change. t Footnote ¶. centration of a trace gas requires either (i) the source of the gas be predominantly in one hemisphere or (ii) the removal rate be more rapid in one hemisphere than the other. The former is certainly the case for many anthropogenic gases that are released largely in the northern hemisphere, including CO2 from fossil fuel combustion (20), 85Kr from nuclear fission (21), and CC13F, CC12F2, and other industrially significant chlorine-containing molecules (22). There have also been suggestions that the average tropospheric OH concentration might be higher in the southern hemisphere than in the northern (23-27), such that removal of CH4 and CH3CC13 by reaction with OH would therefore occur more rapidly in the south than in the north. Because most ofthe known biological sources of CH4 are essentially landbased, the primary release of atmospheric CH4 into the northern hemisphere has been strongly indicated (10). Although biological in character and of long-standing historically, the release of CH4 from cultivated rice fields and from much of the enteric fermentation can also be assigned as essentially of anthropogenic origin. Both the world land area devoted to the cultivation of rice and the number of domesticated large mammals have increased during the past two decades (28, 29).
EXPERIMENTAL PROCEDURES We have collected ground-level air samples from rural locations (identified by nearby communities in Tables 2 and 3) between 62°N and 54°S latitudes, usually within a period ofseveral weeks for N/S comparisons. The samples were collected in 2-liter stainless steel canisters each equipped with a single Nupro stainless steel valve. The canisters were evacuated in the laboratory, transported to and opened in the remote environments, and then returned to the laboratory for analysis by gas chromatography. Aliquots were first measured for CH3CC13 concentrations by electron-capture gas chromatography. Further aliquots were then used for CH4 analysis with flame ionization as the detection technique, and finally, still others were used for CC13F and CC12F2 measurements by electron capture
detection. Two different procedures were used in the analysis of the November 1977 to February 1978 samples. In the first procedure, aliquots were taken directly from the stainless steel sample canisters at room temperature and were analyzed by using helium as the carrier gas in the flame-ionization gas chromatography. The CH4 concentrations so measured were then corrected to ppmv in dry air from the absolute humidities measured at the time ofcollection. These absolute humidities varied from 3 torr (1 torr = 1.333 x 10² pascal) (Idaho) to 21 torr (St. Croix), a variation of almost 3% in the contribution of H20 to
the total measured pressure. These data were reported by Mayer et al..¶ The second procedure, used for all of the data reported here, involves freezing out less volatile components (including H20) at -20°C, with N2 as the carrier gas for a more stable baseline and greater sensitivity in the flame-ionization measurements. The CH4 concentrations listed in the tables are the average of alternate data taken usually from five aliquots of the sample and five aliquots from a secondary standard. The CH4 concentrations for these samples are summarized in Tables 2 and 3, expressed as ppmv ofdry air, and are grouped generally by the dates of collection. The precision of the measurements ofthe CH4 content ofeach individual sample canister is estimated to be < ±0.01 ppmv. All of the sample measurements in each of the groups ofTable 2 and those ofTable 3 were made in the laboratory during time periods of about 1 month to permit more accurate between-sample comparisons, and are estimated to have a precision within each group of ±0.01 relative to one another. Repetitive measurements of the same set of samples 1-3 months later showed no changes in either the absolute or relative values beyond normal statistical variability, indicating that the air samples preserve the integrity of the CH4 concentrations over long periods of storage. The Ivanpah samTable 2. Ground-level tropospheric concentrations during 1977-1978 Date Latitude Sampling location 55.50N 1/21/78 Ketchikan, AK 43.40N Twin Buttes, ID 11/ 1/77 35.30N 11/ 8/77 Ivanpah, CA 25.20N 2/ 1/78 Key Largo, FL 17.80N 2/ 3/78 St. Croix, VI 13.70N 2/ 5/78 St. Lucia, B.W.I. 16.20S Rio Zongo, Bolivia 1/14/78 23.50S 1/12/78 Antofagasta, Chile 36.80S 1/ 6/78 Concepcion, Chile 41.50S Puerto Montt, Chile 1/ 8/78 45.70S 1/10/78 Coihaique, Chile 45.80S 1/ 9/78 Balmaceda, Chile 53.50S Punta Arenas, Chile 1/ 8/78 31.70N 8/ 9/78 Punta Banda, Mexico 31.60N 8/ 9/78 Santo Tomas, Mexico 21.30S 9/21/78 Rarotonga, Cook Is. 9/22/78 21.3°S Rarotonga, Cook Is. 21.30S 9/23/78 Rarotonga, Cook Is. 42.70S 8/30/78 Hokitika, N.Z. 43.80S 8/31/78 Knights Point, N.Z. 45.50S 9/ 2/78 Manipouri, N.Z.
ppmv 1.580 1.574 1.560 1.584 1.555 1.539 1.565 1.458 1.496 1.453 1.461 1.462 1.467 1.556 1.613 1.498 1.482 1.498 1.494 1.494 1.478
1368
Chemistry: Mayer et aL
Table 3. Ground-level tropospheric concentrations during 1979 Latitude Sampling location Date ppmv 61.80N Chickaloon, AK 6/18/79 1.617 61.70N Willow, AK 6/18/79 1.609 55.50N Ketchikan, AK 1.619 6/19/79 55.50N Ketchikan, AK 6/19/79 1.608 47.20N 6/20/79 Copalis Beach, WA 1.609 44.20N Roosevelt Beach, OR 1.592 6/20/79 40.40N 6/21/79 Cape Mendocino, CA 1.607 25.0N Islamorada, FL 7/14/79 1.569 22.80N Long Island, Bahamas 1.568 7/15/79 20.0N Lanpahoehoe, HI 1.566 4/ 7/79 17.80N St. Croix, VI 7/17/79 1.581 13.30N North Point, Barbados 7/18/79 1.571 10.50N Biche, Trinidad 7/21/79 1.587 10.30N Mayaro, Trinidad 7/21/79 1.570 5.40N Powakka, Surinam 7/20/79 1.555 1.20S Belem, Brazil 6/ 9/79 1.574 3.10S Manaus, Brazil 6/10/79 1.601 3.10S Manaus, Brazil 6/10/79 1.577 3.60S Fortaleza, Brazil 6/ 8/79 1.546 8.10S Recife, Brazil 1.512 6/ 7/79 13.0S Salvador, Brazil 1.509 6/ 7/79 19.20S Vitoria, Brazil 1.511 6/ 5/79 23.50S Antofagasta, Chile 6/ 2/79 1.504 41.40S Puerto Montt, Chile 1.503 5/29/79 53.10S Punta Arenas, Chile 1.517 5/31/79
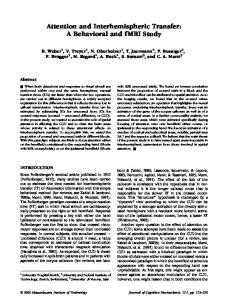
ple from November 1977 has been remeasured several times over the 4-yr period since collection without change in its indicated concentration of CH4. The agreement in measured concentrations of CH4 for samples treated by both procedures was excellent, with somewhat better precision for the N2-carrier freeze-out method, and the latter has been adopted as the standard method of analysis of subsequent samples. The current procedure utilizes a 91.5-cm, 80/100-mesh Spherocarb chromatographic column packed in 3.18-mm stainless steel and operated at 75°C. The CH3CC13 concentrations in the same canisters are not as readily preserved as CH4 but have generally also remained stable over periods of 2 or more months. The concentrations in ppmv for the individual samples of Table 3 are graphed in Fig. 1 versus the concentration of CH3CC13 in parts per 1012 by volume found in the same canister (unpublished data). Because the dominant tropospheric removal process for each is reaction with OH, as in Eqs. 1 and 2, the concentrations for these two molecules can be anticipated to have some correlation with one another. However, much of the CH4 is introduced into the atmosphere in tropical regions, whereas most ofthe CH3CC13 is released in the north temperate zone, and this difference in source location could readily reduce any correlation induced by the similarity in location ofthe sinks. The period of time around June-July 1979 offered a favorable opportunity for observation of a CH4/CH3CC13 correlation because both the northern (10°N-62°N) and southern (0°-54°S) hemispheres were well mixed at that time, as indicated by CC13F and CC12F2 concentrations, with a sharp gradient between 0° and 10°N at the ITCZ. An excellent linear correlation (R12 = 0. 97) is observed for the CH4 and CH3CC13 concentrations from 20 of the canisters, as indicated in Fig. 1. The five remaining points all deviate in the direction of having "excess" CH4 and are all located within the Amazon River basin of northern South America. The three northernmost Brazilian locations all clearly contained "southern hemispheric" concentrations of CC13F and CC12F2, whereas that from Surinam had concentrations of these chlorofluorocarbons intermediate between the northern and southern values (unpublished data). We attribute the additional CH4 in
Proc. Natl. Acad. Sci. USA 79 (1982)
0
eo
0~~~~~~~~~ 1.55 _)
1.50 X
, 70
. 80
. 90 100 CH3CCl3, pptv
110
FIG. 1. Correlation of measured concentrations of CH4 and CH3CC13 in tropospheric samples in mid-1979. pptv, concentration in parts per 1012 by volume.
these five samples to the presence of a substantial Amazon basin source of CH4 from the anaerobic decay of biological material. Approximate estimates from these very limited data suggest that the Amazon basin could be the source for as much as 10% of the atmospheric methane. We calculate an average southern hemispheric CH4 concentration of 1.466 + 0.015 in January 1978 and 1.491 ± 0.009 in August-September 1978. We omit the Amazon basin measurements in Table 3 and calculate a southern hemispheric concentration of 1.509 ± 0.005 for July 1979 over the latitude range from 8°S to 54°S. The difference in CH4 concentrations between January 1978 and July 1979 appears to be significant (30). Our northern hemispheric average for January 1978 is 1.565 ± 0.017 and for July 1979 is 1.593 ± 0.020. The corresponding ratios of N/S concentrations are 1.068 ± 0.016 in January 1978 and 1.055 ± 0.013 in July 1979 for an average value of 1.06 ± 0.01. Our average value for the interhemispheric gradient is in good agreement with other recent measurements insofar as the ratio of concentrations is concerned. ABSOLUTE CONCENTRATIONS Our absolute concentrations were determined by direct comparison with secondary standards prepared from a primary standard furnished by Matheson and stated to have an absolute concentration of 48.9 ppmv with an absolute accuracy of ± 1%, as determined by comparison with a National Bureau of Standards (NBS) standard. Cross-comparison showed the absolute concentration in one such secondary standard as 1.499 ppmv on the basis of vacuum-line dilution from the Matheson standard and 1.499 on the basis of direct comparison with a 0.97 ppmv NBS standard. The close agreement suggests that laboratory preparation of secondary standards can be done with a precision equal to or better than the accuracy of the absolute concentration measurements. The response of the flame ionization detector is linear with concentration over the range between two separate NBS standards at 0.97 and 4 ppmv within the accuracy of the measurements (±0.5%) and should certainly be linear over the observed 1.45- to 1.62-ppmv range of CH4 concentrations found in these samples of background tropospheric air. Our data in Tables 2 and 3 are given in ppmv of dry air, whereas some of the other measurements of Table 1 appear to be expressed in terms of air with natural humidity, judging from the experimental descriptions. Because some of these measurements are made at surface level in the tropics and others are from aircraft flying at altitudes with ambient temperatures below 0°C, the natural humidity undoubtedly varies widely. In our own data, the 21-torr water vapor concentration in the St. Croix sample corresponds to a dry air concentration of CH4
Chemistry: Mayer et al. 0.044 ppmv higher than the moist air concentration of CH4 quoted for the same air. The historical record of recent measurements of absolute CH4 concentrations is not very consistent, as evidenced in Table 1, so it is difficult to establish whether small variations in observed methane concentration have occurred during the period 1972-1979 (30). Agreement upon values of about 1.4 ppmv in the north and 1.3 ppmv in the south apparently existed earlier among the separate data from the same 1972 voyage (8-10). This concordance has been removed by the discovery of an error of a factor ofabout 1.2 in a calibration standard used in the National Center for Atmospheric Research measurements before 1974 (11). When this correction factor is included, one set of these 1972 measurements then lies above our present values and one lies below it. We are unable to explain the, discrepancy among these 1972 values and therefore unable to draw any conclusions about possible longer term trends in CH4 concentrations except those occurring internally within our own data set. It seems probable from the spectroscopic records back to 1948 (6) that no large variation (>20%) has occurred over the past 30 yr. ATMOSPHERIC LIFETIME OF CH4 If reactions 1 and 2 are the predominant mechanisms for atmospheric removal ofCH4 and CH3CC13, respectively, then the removal rates are proportional to the reaction rate constants, k, and k2, at each location in the atmosphere, and the relatively uncertain OH concentrations in the atmosphere can be essentially canceled out in a relative calculation. The best current rate constant equations for these reactions are (31) k, = 2.4 X 10⁻¹² exp(-1710/T) and k2 = 5.4 x 10⁻¹² exp(-1820/T) cm3mol-'s-'. Although the available temperature range in the troposphere covers about 90'C, 80% of the removal of these molecules occurs below an altitude of 6 km, at temperatures above 275 K, with the median altitude for such reaction at about 2 km (32). At the higher altitudes the lower temperatures reduce the rate constants for reactions 1 and 2 so that they are 1/8th as fast at 217 K as at 288 K. The lower absolute concentrations of wellmixed gases (factor of 4 between altitudes of0 and 12km) further decrease the actual reaction rates until the removal rate at 12 km for a given OH concentration is about 1/30th of that for the same concentration at the surface. Because the activation energies for reactions 1 and 2 are very similar, the ratio k2/k, varies only from 1.51 to 1.56 between 275-300 K, and the value at 280 K, 1.52, is an appropriate average value for the whole tropospheric reaction competition. By using the atmospheric lifetime of 6.9 ± 1.2 yr calculated for CH3CC13 from its measured atmospheric loading in' 1978 (19), the estimated lifetime for CH4 is 1.52 times longer, or 10.5 ± 1.8 yr. The CH3CC13 lifetime estimate is based upon removal by all processes-not just reaction with tropospheric OH-but is certainly dominated by the latter. The existence ofa N/S gradient in concentrations ofCH4 also provides some limitations on its atmospheric lifetime, through examination of the location and magnitude of its sources and sinks (10). Considerable insight into these relationships can be gained through a two-box N/S model of the atmosphere, as shown by.Ehhalt (10). The observation of essentially only two atmospheric concentrations (one north of 10°N and one south of 0°) for CC13F and CCl2F2 in July 1979 (unpublished data) demonstrates that the two-box model approach has substantial validity in the real atmosphere for discussions of concentration gradients for trace gases. Ehhalt has developed a formula. relating in steady state the average atmospheric lifetime, Ta, through Eq. 3,
Proc. Natl. Acad. Sci. USA 79 (1982)
1369
to the average interhemispheric mixing time, Tm, the concentrations in the north and south (Ma, M,), and the ratio, a, of the source strengths in the northern and southern hemispheres (10). He then adopted Tm as 1 yr and calculated Ta from his 1972 data (Table 1) in which Mn = 1.40 ppmv and M, = 1.30 ppmv for a difference of 0.10 ppmv. An equivalent formula to Eq. 3 is given in Eq. 4, in which the interhemispheric concentration ratio, (a - R) Ta
[4]
Tm
=
R = MIMS has been used instead of the individual concentrations. Because most biogenic CH4 is land-based, production must be predominantly in the northern hemisphere. Ehhalt postulated that CH4 production might be approximately proportional to the land area in each hemisphere (a = 2.06) or more likely to that below 60° in each hemisphere (a = 2.4), and he calculated the most probable lifetime for CH4 to be 5 yr. Values of 2.5 and 11 yr were calculated for interhemispheric gradients of 0. 15 and 0.05 ppmv, respectively, on the old calibration scale. The change in the National Center for Atmospheric Research absolute calibration (11) changes the absolute values of M. and M. but not those of R or Ta. The formulation of Eqs. 3 and 4 implicitly adopts the additional assumption that the rate of removal of CH4 is the same in both the northern and southern hemispheres-i.e., that there is no hemispheric asymmetry in the average OH radical concentrations. Several atmospheric model calculations have been performed which lead to questioning of the hemispheric equivalence in OH concentrations (23-27, 32), with some hypothesizing asymmetries as large as a factor of 3. The observed CH3CC13 gradient in concentrations has led to suggestions that the OH concentrations are twice as large in the southern as in the northern hemisphere (26). Other analyses place the ratio between 1.0 and 1.3 (27). We have expanded the Ehhalt two-box model to include the additional possibility of hemispheric asymmetry in the removal of CH4 and CH3CC13 by reaction with OH, and we have defined the interhemispheric mixing rate as k (= m') and the two removal rates as Ak and Ask with the ratio A = A/A. With different removal rates in the two hemispheres the average lifetime, Ta, is no longer rigorously defined because the lifetime is now dependent upon the hemisphere in which the trace gas is released. However, with lifetimes of 5 yr or longer and interhemispheric mixing times. of about 1 yr, the average atmospheric lifetimes are at most a few percent different for the same
molecule introduced into the northern versus the southern hemispheres. We therefore define an average loss rate in steady state, Aa, by Eq. 5, Aa (AnR + AS) [5] R+ 1
and an average lifetime, Ta = Aa 1 and assume its approximate applicability to any source distribution of gases introduced into the model. The differential equations for variation in the concentrations (Ma, M.) are then given by Eqs. 6 and 7,
Pn -k(Mn - Ms) - An(Mn)
[6]
d= Ps + k(Mn-MS) -ASA) dt
[7]
ddt
=
and
in which Pn and P, are the source functions into the northern and southern hemispheres, respectively, and a = PJP8. At , Ms-Mn steady state, both Eqs. 6 and 7 are equal to zero and R is given 33 (a + 1)(M - M8)[ by Eq. 8.
1370
Chemistry: Mayer et al.
R= a(As + k) + k (An+ k) + ak Obviously, an interhemispheric gradient with R > 1 requires either a > 1 or A > 1, and a > 1 is already indicated from the distribution of land mass. The other important parameter in determining the magnitude of the gradient R is the relative size of k versus the removal rate Aa-i.e., of Tm versus Ta. When the solutions to Eq. 8 are evaluated for the range of values generally appropriate to CH4 (a, 1-3; A, 1-3; Tm, 0.8-2 yr; Ta, 5-10 yr), the results are found empirically to be fitted within a few percent by Eq. 9. (a)(A)(Tm) = 6(R - 1). [9]
Proc. Natl. Acad. Sci. USA 79 (1982)
the source strengths for CH4 is certainly now of prime importance in establishing more quantitatively the details of the atmospheric methane cycle. This research was supported by Department of Energy Contract DEAT-76ER-70126 and by Environmental Protection Agency Contract 805532020. This work was completed during the tenure of an Alexander von Humboldt Award to F. S. R. 1. 2. 3. 4.
(Ta)
The form of this equation indicates that possible percentage errors in all four parameters on the left-hand side are found to be approximately equal.in importance. Although Eq. 9 could in principle be used to estimate Ta for CH4, it is readily apparent that the combined errors in a, A, Tm, and R are unlikely to be as small as the 17% error calculated for Ta from comparison with the CH3CC13 lifetime. However, consideration of the gradient in concentration can still be quite valuable in assessing whether the estimate of 10.5 ± 1.8 yr for Ta is consistent with the gradient and in furnishing insight into the hemispheric asymmetry or lack of it for sources and sinks. Our best value for Tm is 1.25 ± 0.15 yr (k = 0.8 + 0.1 yr-'), obtained from consideration of the observed N/S gradients for CC13F and CC12F2 (unpublished data). With values of R from 1.05 to 1.07, the value of T becomes [(a)(A)(1.25)/(6)(0.06 ± 0.01)] or (3.0-4.2)(a)(A) yr. With Ehhalt's (10) values of a = 2.4 and A = 1.0, the lifetime range becomes 7.2-10 yr. Alternatively stated, an atmospheric lifetime of 10.5 yr and R = 1.05-1.07 requires that the product (a)(A) = 2.5-3.5, which is certainly within the expected range for the product of these two ratios. Much more information is needed on the geographical locations of either sources or sinks before the CH4 gradient can be used to evaluate either (a) or (A) separately. A global average concentration of 1.56 ppmv for CH4 corresponds to about 4.2 X 10'5 g in the atmosphere in steady state. With an average lifetime of 10.5 yr, the required global source strength for all CH4 sources is then about 4.0 -x 1014 g/ yr. This source strength is somewhat less than the minimum values estimated for biogenic sources alone by Ehhalt of 5.78.3 x 104' g/yr (3). In his 1979 estimate (3), the individual biogenic source strengths were given in units of 1014 g/yr as: rice paddy fields, 2.8; swamps and marshes, 1.9-3.0; enteric fermentation, 1.0-2.0; freshwater lakes, 0.01-0.25; tundra, '0.03; and oceans, 0.01-0.17. He has also added 0. 16-0.5 from coal mining and other industrial activity with an upper limit on nonbiogenic sources of 10%. Recent measurements of CH4 emission from California rice fields lead to an extrapolated value of 0.59 x 10¹⁴ g/yr for world emissions from rice fields (33). The experimental bases for all of these extrapolations. to worldwide source totals are very thin, and the estimates for paddy fields and swamps could readily have been overestimated by an amount sufficient to bring the calculated source strength from the 10.5-yr lifetime into agreement with the summed minimum values from biogenic sources. Indeed, if the Cicerone-Shetter value of 0.59 is substituted for 2.8 in Ehhalt's estimates, the minimum biogenic release becomes 3.5 X 10¹⁴ g/yr, and the estimated source strength is then compatible with the lifetime of 10.5 yr (33). Though there is thus no necessary disagreement between yearly flux and lifetime, the ranges of possible values for the CH4 sources are still very large. Direct observation of
5. 6. 7. 8.
Ehhalt, Ehhalt, Ehhalt; Ehhalt,
D. H. (1974) Tellus 26, 58-70. D. H. & Schmidt, U. (1978) Pageoph 116, 452-464. D. H. (1979) Naturwissenschaften 66, 307-311. D. H. & Volz, A. (1976) in Microbial Production and Utilization of Gases, eds. Schlegel, H. G., Gottschalk, G. & Pfennig, N. (Goltzke, Gottingen, Federal Republic of Germany), pp. 23-33. Gold, T. &. Soter, S. (1980) Sci. Am. 242 (6), 130-137. Migeotte, M. V. (1948) Phys. Rev. 73, 519-520. Malkov, I. P., Yurganov, L. N. & Dianov-Klokov, V. I. (1976) Izv. Acad. Sci. USSR Atmos. Oceanic Phys. 12, 1218-1221. Wilkniss, P. E., Lamontagne, R. A., Larson, R. E., Swinnerton, J. W., Dickson, C. R. & Thompson, T. (1973) Nature (London)
245, 45-47.
9. Lamontagne, R. A., Swinnerton, J. W. & Linnenbom, V. J. (1974) Tellus 26, 71-77. 10. Ehhalt, D. H. (1978) Tellus 30, 169-176. 11. Heidt, L. E. & Ehhalt, D. H. (1980) Geophys. Res. Lett. 7, 1023. 12. Singh, H. B., Salas, L. J., Shigeishi, H., Smith, A. J., Scribner, E. & Cavanagh, L. A. (1979) in Atmospheric Distributions,
13. 14.
15.
Sources and Sinks of Selected Halocarbons, Hydrocarbons, SF6 and N20, EPA-600/3-79-107, November 1979 (EPA, Research Triangle Park, NC), p. 113. Singh, H. B., Salas, L. J., Shigeishi, H. & Scribner, E. (1979) Science 203, 899-903. Heidt, L. E., Krasnec, J. P., Lueb, R. A., Pollock, W. H., Henry, B. E. & Crutzen, P. J. (1980) J. Geophys. Res. 85, 7329-7336. Rasmussen, R. A. & Khalil, M. A. K. (1980) in Proceedings ofthe NATO Advanced Study Institute on Atmospheric Ozone, Report no. FAA-EE-80-20, eds. Nicolet, M. & Aikin, A. C. (U.S. Dept. Transp., Washington, DC), pp. 209-231. Levy, H. (1971) Science 173, 141-143. Weinstock, B. & Niki, H. (1972) Science 176, 290-292.
16. 17. 18. Altshuller, A. P. (1980) in Proceedings of the Conference on
Methyl Chloroform and Other Halocarbon Pollutants, EPA-600/ 9-80-003, ed. Bufalini, J. J. (EPA, Research Triangle Park, NC), pp. 1-1-1-9. 19. Makide, Y. & Rowland, F. S. (1981) Proc. Natl. Acad. Sci. USA
78, 5933-5937. 20. Keeling, C. D. & Bacastow, R. B. (1977) in Energy and Climate (Geophys. Res. Board, Natl. Acad. Sci., Washington, DC), pp. 72-95. 21. Telegadas, K. & Ferber, G. J. (1975) Science 190, 882-883. 22. Rowland, F. S. & Molina, M. J. (1976) J. Phys. Chem. 80, 2049-2056. 23. Crutzen, P. J. & Fishman, J. (1977) Geophys. Res. Lett. 4, 321-324. 24. Sze, N. D. (1977) Science 195, 673-674. 25. Singh, H. B. (1977) Geophys. Res. Lett. 4, 101-104. 26. Singh, H. B. (1977) Geophys. Res. Lett. 4, 453-456. 27. Chameides, W. L. & Tan, A. (1981) J. Geophys. Res. 86, 5209-5223. 28. Walsh, P. A. & Johnson, E. (1980) Agricultural Statistics 1980
(U.S. Dept. Agric., Washington, DC).
29. Food and Agriculture Organization of the United Nations, Rome (1981) FAO Monthly Bull Stat. 4 (5). 30. Khalil, M. A. K. & Rasmussen, R. A. (1981)J. Geophys. Res. 86, 9826-9832. 31. DeMore, W. B. ed. (1981) Chemical Kinetic and Photochemical Data for Use in Stratospheric Modeling, Evaluation No. 4 (Jet Propulsion Lab., Pasadena, CA), Publ. JPL 81-3. 32. Logan, J. A., Prather, M. J., Wofsy, S. C. & McElroy, M. B. (1981)J. Geophys. Res. 86, 7210-7254. 33. Cicerone, R. J. & Shetter, J. D. (1981) J. Geophys. Res. 86, 7203-7209.