Author’s Accepted Manuscript Relation between microstructure and formability of quenching-partitioning-tempering martensitic steel Qingguo Hao, Shengwei Qin, Yu Liu, Xunwei Zuo, Nailu Chen, Yonghua Rong www.elsevier.com/locate/msea
PII: DOI: Reference:
S0921-5093(16)30679-7 http://dx.doi.org/10.1016/j.msea.2016.06.023 MSA33769
To appear in: Materials Science & Engineering A Received date: 26 May 2016 Revised date: 9 June 2016 Accepted date: 10 June 2016 Cite this article as: Qingguo Hao, Shengwei Qin, Yu Liu, Xunwei Zuo, Nailu Chen and Yonghua Rong, Relation between microstructure and formability of quenching-partitioning-tempering martensitic steel, Materials Science & Engineering A, http://dx.doi.org/10.1016/j.msea.2016.06.023 This is a PDF file of an unedited manuscript that has been accepted for publication. As a service to our customers we are providing this early version of the manuscript. The manuscript will undergo copyediting, typesetting, and review of the resulting galley proof before it is published in its final citable form. Please note that during the production process errors may be discovered which could affect the content, and all legal disclaimers that apply to the journal pertain.
Relation between microstructure and formability of quenching-partitioning-tempering martensitic steel Qingguo Hao, Shengwei Qin, Yu Liu, Xunwei Zuo*, Nailu Chen, Yonghua Rong School of Materials Science and Engineering, Shanghai Jiao Tong University, Shanghai, 200240, China
Corresponding author. Tel. / fax: +86 21 34203742.
[email protected]
Abstract Investigation of the mechanical properties and forming limit diagrams (FLDs) of Fe-0.20C-1.49Mn-1.52Si-0.58Cr-0.05Nb (wt.%) steel treated by conventional quenching and tempering (Q&T) and a novel quenching-partitioning-tempering (Q-P-T) process has revealed that the latter produces more retained austenite (10.8%) than the former (less than 3%) and improves the formability. The better formability of the Q-P-T martensitic steel is attributed to a higher strain hardening exponent ( n =0.0958) and true uniform elongation ( u =10.3%) than the Q&T martensitic steel ( n =0.0410, u =3.6%), which leads to a lower yield ratio (σs/σb) and higher plastic strain ratio (r). The high value of n is found through microstructural characterization to stem from the high strain hardening rate of the retained austenite during deformation, as well as a low dislocation density in the martensitic matrix prior to deformation due to carbon partitioning into the retained austenite during the Q-P-T process. The high εu is attributed to the dislocation absorption by retained austenite (DARA) effect, which effectively enhances the deformability of the martensitic matrix, as well as the transformation induced plasticity of retained austenite during deformation. Since there is no carbon-depletion in the single-phase martensitic matrix of the Q&T steel, it exhibits reduced formability due to a lower value of n and εu.
1
Keywords: Quenching-partitioning-tempering (Q-P-T) martensitic steel; Forming limit diagram (FLD); Strain hardening exponent; True uniform elongation; Dislocation absorption by retained austenite (DARA) effect
1. Introduction In modern automotive industries, the design of vehicles is often driven by the need for lighter weight, better crash performance, more stringent safety standards, greater energy savings and lower environmental impact [1]. To help cope with these often conflicting requirements, advanced high strength steels (AHSSs) have been developed such as dual-phase (DP) steels [2], transformation induced plasticity (TRIP) steels [3], twinning induced plasticity (TWIP) steels [4], quenching and partitioning (Q&P) steels [5] and quenching-partitioning-tempering (Q-P-T) steels [6]. These materials exhibit an excellent combination of strength and ductility, and hence can be used to reduce the thickness of components without deteriorating their safety performance. However, before these newly developed steels can be used, they often need to be formed into potentially complex parts through processes such as stamping thin strips at room temperature [7]. The complexity of plastic during such processes requires careful and constant monitoring of both the mechanical behavior and formability of metal sheets [4, 8-12]. The formability of a metal is defined by its ability to deform into a desired shape without any local necking or fracture [13]. As an aid to evaluating the success of sheet forming operations, forming limit diagrams (FLDs) have proven to be a very useful and popular technique for the manufacturers and users of sheet metal [14]. Research in this field was pioneered by Keeler [15] based on the observations of Gensamer [16] that instead of using global indices, local 2
deformations should be considered. The basic concept of a FLD was first introduced by Keeler and Backofen (1963) [17] (right side) and Goodwin (1968) [18] (left side), but is now a standard technique for optimizing metal sheet forming processes. There has since been considerable research into the correlation between the formability of metal sheets and parameters such as their strain hardening exponent (n), plastic strain ratio (r), true uniform elongation (εu) and yield ratio (σs/σb). Keeler and Backofen [17] reported that an increase in n leads to a more homogeneous strain distribution and improved stamping formability, while Ahmadi et al. [19] verified through both experiments and simulation that increasing the value of n and r improves the formability, deep drawability, and major strain in the plane strain condition (FLD0) of low-carbon steel sheets. Indeed, Bouaziz et al. [7] have suggested that the forming limit is mainly controlled by the strain-hardening of the steel, and that FLD0 is equal to the strain hardening exponent. Moreover, Whiteley [20] verified that an increase in r improves the limiting drawing ratio in deep drawing tests. Studies have revealed that the formability of AHSSs is dependent on the microstructure that is created through different heat treatments; i.e., a ferrite matrix and martensite in DP steels; ferrite matrix, bainite and retained austenite in TRIP steels; single-phase austenite in TWIP steels, a martensitic matrix and retained austenite in Q&P steels; and a martensitic matrix, retained austenite and carbides in Q-P-T steels. Lee et al. [11] found that a large volume fraction and high stability of retained austenite is favorable for stability in the case of a 0.1C-1.5Si-1.5Mn-0.5Cu TRIP-aided cold-rolled steel sheet, though Sugimoto [21] pointed out that voids created at ferrite/martensite interfaces by a concentration of strain will reduce the formability. Kim et al. [22] found that ferrite in TRIP steels undergoes strain hardening, and that the accumulation of strain 3
energy caused by dislocation pile-up inside ferrite grains provides the mechanical driving force needed for strain-induced transformation of retained austenite. This transformation relaxes the dislocation pile-up and softens the ferrite grains, which are subsequently strain-hardened again by strain-induced martensite. This process of softening and hardening the ferrite repeats throughout the strain-induced transformation of retained austenite. Of the various AHSSs available, Q&P and Q-P-T steels possess the highest strength due to their martensitic matrix. However, as these are a relatively new development, much less is known about their formability than DP, TWIP and TRIP steels [23, 24]. Wang and Speer [24] have reported typical FLDs for cold rolled Q&P 980, dual-phase (DP) 780 and DP 980 steels, which revealed that the formability of Q&P 980 is superior to that of DP 980 steel and reaches the same level as that of DP 780. However, the effect of microstructure on formability has not been studied in the case of Q&P steels. What is known is that in the Q&P process originally proposed by Speer et al. [5] in 2003, a Si-containing steel is quenched from its austenitizing temperature to a temperature (Tq) that is between the start temperature (Ms) and finish temperature (Mf) of martensitic transformation. During this “partitioning” stage of the process, carbon diffuses from the supersaturated martensite phase to the untransformed austenite phase. This leads to carbon depletion (softening) in the martensitic matrix and carbon-enrichment in the retained austenite, which makes the latter more stable during subsequent cooling to room temperature. In the case of low- or medium-carbon Q&P steels, the value of Tq is usually much higher than room temperature [25], and so considerable amounts of retained austenite can be obtained. The “constrained carbon paraequilibrium” (CCE) theory of the Q&P process states that the precipitation of carbides is not permitted during the process, which excludes the possibility of 4
precipitation strengthening. To overcome this limitation, Hsu [6] proposed a Q-P-T process in which additional carbide forming elements like Nb are added for precipitation and refined-grain strengthening. This Q-P-T process incorporates the core idea of the Q&P process, i.e., a theoretical determination of quenching temperature (Tq) based on both CCE theory and the Koistine– Marburger (K-M) equation [5, 26]. As such, Q-P-T steels also have a carbon-depleted martensitic matrix and considerable carbon-enriched retained austenite, and therefore exhibit an excellent combination of strength and ductility. As softening of the martensitic matrix also occurs during deformation, variations in the average density of dislocations in the martensitic matrix and retained austenite of a medium carbon Q-P-T steel were measured by the authors of the present study at different deformation stages using X-ray diffraction line profile analysis (XLPA) [27]. This found during the initial stages of deformation the average dislocation density in the martensite decreases with increasing strain, but then gradually increases. As this phenomenon cannot be explained by TRIP effect, a dislocation absorption by retained austenite (DARA) effect was proposed in which dislocations in martensite move into nearby retained austenite through martensite-retained austenite interfaces, where they are then absorbed by the retained austenite. The possibility of dislocations being transmitted from a bcc-phase into a fcc-phase has been verified by molecular dynamic simulations [28-30] and in Cu-Nb bi-layer films [31]. This DARA effect softens the normally hard martensite phase during deformation and effectively enhances its formability. It was further proposed that for the DARA effect to occur, two empirical conditions need to be met [32]: 1) the amount of retained austenite needs to be more than 10% by volume fraction, and 2) the interface between the two phases should be coherent or semi-coherent. These two conditions have been confirmed to exist in low-carbon Q-P-T steel [33], bainitic steel [34] and 5
high-carbon Q-P-T steel [35] when subjected to quasi-static tension, as under these conditions the interface between martensite (or bainite) and retained austenite has a coherent or semi-coherent K-S or N-W orientation. It is therefore reasonable to assume that the formability of high-strength, low-carbon Q-P-T martensitic steels will be improved by a softening of its martensitic matrix and considerable retained austenite, but this has not been yet verified by experiments. This study therefore investigates the formability of high-strength, low-carbon Q-P-T martensitic steels to better understand the effects of microstructure on the apparent parameters and formability when compared to traditional quenching and tempering (Q&T) martensitic steels with the same composition.
2. Experimental procedure Low carbon steel with a chemical composition of Fe-0.20C-1.49Mn-1.52Si-0.58Cr-0.05Nb (wt.%) was melted in a medium frequency induction furnace, and then a hot-rolled to a 20 mm-thick plate by the Central Iron and Steel Research Institute (Beijing, China). Specimens measuring 4 mm in thickness were cut from this hot-rolled plate, and then subjected to Q-P-T or Q&T processes. Those samples treated by the Q-P-T process were austenitized at 950 °C for 600 s, followed by quenching in a molten salt bath at 320 °C (Tq) for 30 s. They were then partitioned/tempered at 450 °C for 60 s in another molten salt bath and finally quenched to room temperature in water. The Q&T process used was essentially the same as the Q-P-T process, except that the samples were only quenched at room temperature (Tq). To determine the mechanical properties of the Q-P-T and Q&T samples, they were first cut along their tensile axis in directions parallel (0°), diagonal (45º) and perpendicular (90°) to the 6
rolling direction of the sheet. The true stress and true strain were then calculated from their respective engineering values obtained using a Zwick/Roell Z100 tensile testing machine in accordance with GB/T 228-2002 and GB/T 5027-2007/ISO 10113-2006 using the following formula:
True Engineering 1 Engineering True ln 1 Engineering
(1)
In order to obtain the strain hardening exponent from the tensile data, the classic Hollomon equation was used [36, 37]:
K n
(2)
where σ is the true stress, ε is the true strain and K is the strength coefficient. When
d d
(necking criterion). The value of n can be written as:
n
d d
(3)
and then,
n u
(4)
where εu is the true uniform elongation. The plastic strain ratio, r, was calculated using the following equation [38]:
r
ln w0 w f w t ln l f w f l0 w0
(5)
where εw is the true width strain, εt the true thickness strain, w0 and l0 are the initial width and gauge length, and wf and lf are the final width and gauge length, respectively. The normal anisotropy
r
was further calculated from the r values using:
r r0 2r45 r90 / 4
(6) 7
where the subscripts of r represent the 0°, 45º and 90° rolling directions, respectively. The North American Deep Drawing Research Group (NADDRG) has developed an modified equation for describing the relationship between the value of true major strain (FLDT0) in the plane strain condition and the strain hardening exponent (n) to predict FLD [39, 40]:
FLD0TrueStrain ln 1 a 23.3 14.13 t , mm / 100
(7)
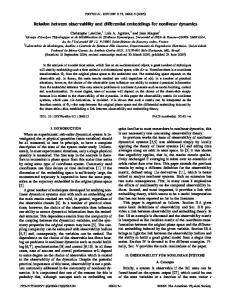
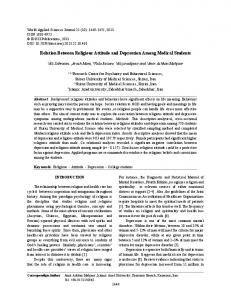
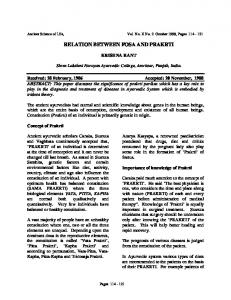
where a=n/0.21 when n≤0.21 and the material thickness t≤3. Two different forming methods [41] have been developed for experimentally determining the FLD value: in-plane stretching (e.g., the Marciniak test) [42] and out-of-plane stretching (e.g., the Nakazima test) [43]. In the present study, Nakazima tests were carried out in accordance with GB/T 15825.8-2008 and ASTM E2218-02 (2008) using a Zwick/Roell BUP600 sheet metal testing machine to determine the FLDs of the Q-P-T and Q&T steel samples. Figure 1 presents a schematic of this test setup, which included a hemispherical punch with a radius of 50 mm and drawbead in a blank holder. By forming a number of 180 mm-long, 1.8 mm-thick sheet samples with varying widths (20 to 180 mm, as shown in Fig. 2 and 3, and Table 1), different deformation paths could be observed at various strain states, i.e., the tension-compression region, plane strain and the tension–tension region. Figure 3 shows the punched samples at various strain states until failure. To achieve zero friction between the punch and blank, an elaborate lubrication system consisting of alternate layers of grease, Teflon and PVC sheets was applied onto the opposite side of the grid pattern surface. All tests were performed with a punch speed of 0.5 mm/s until either local necking or fracture occurred, and the load–displacement data was collected throughout the test. Strain analysis of the specimens was conducted by using an optical measuring system (Auto-Grid) to measure the deformation of a 2 mm-square grid pattern electrochemically etched 8
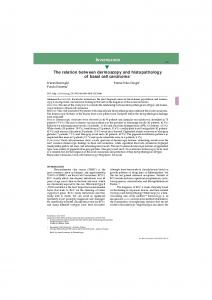
into the surface of the samples (note that the typical FLDs obtained from the literature [7, 17] presented in Fig. 4 used a circular initial grid). The major and minor strains were subsequently calculated using the following equations [44]:
d1 d 0 e1 d 100% 0 e d 2 d 0 100% 2 d0
(8)
d1 1 ln d ln 1 e1 0 (9) ln d 2 ln 1 e 2 2 d0 where e1 and e2 are the major and minor project strain; d0, d1 and d2 are the initial length and lengths of the major and minor axis; and ε1 and ε2 are the major and minor true strain, respectively. Finally, a forming limit curve (FLC) was constructed with the minor true strain as the abscissa and the major true strain as the ordinate, as this can be used to distinguish the range of strain between safety and failure in sheet forming. The fractured surfaces of the samples were observed using a scanning electron microscope (SEM) model JEOL-7600F operated at 30 kV. Microstructural characterization was carried out with a JEOL-2100F transmission electron microscope (TEM) operated at 200 kV using specimens prepared by mechanical polishing followed by electro polishing in a twin-jet polisher using 5 vol.% perchloric acid and 95 vol.% ethanol at -20 °C with an applied potential of 70 V. Each specimen was cut close to the vicinity of different cracks to investigate the effects of strain on the volume fraction of retained austenite (VRA) and average dislocation density in the martensite and retained austenite regions of the Q-P-T specimens. As shown in Table 5, these locations included a region of low strain far from the fracture region (No. 1), an area of high strain near the fracture region 9
(No. 3), and an area of medium strain between the two (No. 2). At each of these, the VRA was measured by X-ray diffraction (XRD) [45] and the average dislocation density by XLPA [46, 47] with a D/max-2550VL/ PC.
3. Results 3.1 Uniaxial tensile properties and apparent parameters To understand the behavior of Q-P-T and Q&T steels during forming, uniaxial tensile tests were performed on each sample at room temperature in three directions (0º, 45º and 90º to the rolling direction) along with FLD tests. Figure 5 shows the engineering stress vs. engineering strain curves under uniaxial tension, with the mechanical properties being listed in Table 2. These results indicate that the yield strength (YS) and ultimate tensile strength (UTS) of Q-P-T steel is lower in all three directions than in the Q&T steel. The yield ratio (YS/UTS) of the Q-P-T steel was similarly lower in all three directions, but its total elongation (TE) was higher in all three directions than in the Q&T samples. Using the uniaxial tensile test data, true stress-true strain curves were plotted based on Eq. (1), which as shown in Fig. 6, demonstrate that the true stress-true strain curves for each direction in the Q-P-T steel almost overlap before reaching uniform deformation. This is very different to the obvious separation seen in the three curves of the Q&T samples, suggesting that the mechanical properties of Q-P-T steel are not sensitive to the rolling direction, i.e., it has less anisotropy. It is also interesting to note that the 90º curve is between the 0º and 45º curves in the Q-P-T samples, whereas the 45º curve is between the 0º curve and 90º curve in the Q&T samples. The strain hardening exponent, n, and strength coefficient, K, were further calculated based on Eq. (2) by 10
fitting the true stress-true strain curves of the Q-P-T samples and Q&T ones along with three different directions, as shown Fig. 7. These results indicate that although the three curves of the Q-P-T samples are fitted well by Eq. (2), there is a relatively large deviation between the fitted and experimental curve in the case of the Q&T samples. From the n and K values listed in Table 3, it is evident that both values are higher in Q-P-T samples than in the Q&T ones. Furthermore, the minimum and maximum values in Q-P-T samples occur at 45° and 0° to the rolling direction, respectively, whereas with the Q&T samples the minimum and maximum occur at 90° and 0°. True uniform elongation ( u ) in Q-P-T samples was higher in all three directions than in the Q&T samples. The plastic strain ratio, r, and normal anisotropy,
r,
also listed in Table 3 were
calculated using Eq. (5) and (6), respectively. These demonstrate that the plastic strain ratio and normal anisotropy is higher in all three directions in Q-P-T steel than in the Q&T samples.
3.2 Forming limit diagrams and apparent parameters The FLDs of the Q-P-T and Q&T samples were determined by measuring the strain of deformed grids near cracks at various strain states, as listed in Table 4. Figure 8(a) and (b) present the FLDs of Q-P-T and Q&T steel, respectively, in which it can be seen that experimental data in the tension-tension region of the Q-P-T samples exhibits a smaller scatter than that of the Q&T steel. As this likely relates to the existence of considerable retained austenite in Q-P-T steel, fitted curves were plotted, as shown in Fig. 8(c), with a safe working zone being established below this line, and a failure zone above it. As these fitted lines obviously cannot precisely indicate the onset of failure, they should ultimately be replaced by a banded region [18]. The strain limits for the Q-P-T and Q&T steel sheets under various strain states given in 11
Table 4 show that in the tension-compression region, the maximum major true strain (ε1) and minor true strain (ε2) of the Q-P-T steel sheet were 0.26 and -0.09, respectively, while in the Q&T steel these values were 0.24 and -0.08. Under plane strain conditions, the maximum ε1 of the Q-P-T and Q&T steel sheets were 0.24 and 0.13, respectively. In the tension-tension region, the maximum ε1 and ε2 of the Q-P-T steel sheet were 0.51 and 0.25, respectively, while the Q&T sheet had values of 0.45 and 0.19. This means that the area of the safe working zone increases with strain limit and is therefore larger in the case of the Q-P-T sheet, especially in the tension-tension region (Fig. 8(c)). This is mainly attributed to the larger FLD0 and ε2 of the Q-P-T sheet, with the fact that the safe working zone of both steels is much higher in the tension-tension region than in the tension-compression region, likely being a feature of martensitic steels.
3.3 Microstructural characterization The XRD spectra of the Q-P-T samples before and after Nakazima punch testing (Fig. 9) indicate that it consisted of bcc-martensite and fcc-retained austenite, with the volume fraction of retained austenite (VRA) determined to be 10.8%. Subsequent TEM characterization revealed that the bcc-phase consists of dislocation-type martensite laths, as shown in the bright field (BF) image in Fig. 10(a), while the fcc-phase is made up of flake-like retained austenite between martensite laths, as shown in the dark field (DF) image and inserted selected area electron diffraction (SAED) pattern in Fig. 10(b). The SAED pattern in Fig. 10(b) also reveals a (110) / /(111) ,
[111] / /[011] K-S orientation relationship. In contrast, no peak for retained austenite could be found in the XRD spectra of the Q&T steel (Fig. 9(a)), which would suggest that it consists of single-phase martensite. However, TEM characterization revealed that it consists of 12
dislocation-type martensite with a small amount of film-like retained austenite (Fig. 10(c)), the latter being identified by the SAED pattern in Fig. 10(d). This indicates that the volume fraction of retained austenite in the Q&T specimen is less than 3%, as this was the XRD detection limit.
3.4 Measurement of average dislocation density and retained austenite fraction during forming From the XRD spectra obtained from different strain regions of Q-P-T steel with different strain paths (Fig. 9), the variation with strain in average dislocation density in both the martensitic matrix and retained austenite was determined, as listed in Table 5. This shows that prior to forming, the average dislocation density in the martensitic matrix and retained austenite is 6.59×10¹⁴ and 11.62×10¹⁴ m-2, respectively. With increasing strain (from No. 1 to No. 3 in Table 5), the average dislocation density in the martensitic matrix first reduces, and then increases, whereas the average dislocation density in the retained austenite increases continuously. At the same time, the volume fraction of retained austenite decreases from 10.8% to less than 3%. This variation shows similar tendencies during tension-compression (T-C) strain, plane strain (P-S) and tension-tension (T-T) strain conditions.
4. Discussion 4.1 Effect of microstructure on apparent parameters In order to understand the origin of a material’s behavior during forming, one must first investigate the effect of its microstructure on its apparent parameters, all of which are related to each other. For example, the strain hardening exponent, n, is proportional to the strain hardening rate, dσ/dε, as shown in Eq. (3). The strain hardening rate, in turn, describes the rate of change in 13
flow stress with strain during uniform plastic deformation, meaning that a larger n value produces a lower yield strength σs and higher tensile strength σb (i.e., a low yield ratio, σs/σb) It is also evident from Eq. (3) that when necking occurs (i.e., dσ/dε = σ), n is equal to the true uniform elongation (n = εu), which means that n reflects both the strength and ductility. The value of εu, on the other hand, represents the deformability of the material immediately prior to necking or crack initiation, and so is related to the plastic strain ratio, r. We can see from Eq. (5) that a large value of r coincides with a large true uniform elongation, and as r is related by Eq. (6) to the normal anisotropy ( r ), a large value of r reflects a large r despite describing the normal anisotropy. Based on this analysis, the strain hardening exponent is considered the most important parameter in all the apparent parameters affecting the formability of metal sheets. It is apparent in Table 3 that the n value of the Q-P-T sample is much larger than that of the Q&T sample in all three directions, and so the microstructure and average dislocation density of each steel type were characterized to determine the origin of this difference. The results obtained indicate that Q-P-T steel consists of a martensitic matrix with retained austenite, whereas the Q&T steel consists essentially of single-phase martensite. Previous work has indicated that the average dislocation density ( pM ) in the martensite of this Q-P-T steel is 6.59×10¹⁴ m−2 before deformation, but is 6.78×10¹⁴ m−2 in Q&T steel, and so it is the lower dislocation density of Q-P-T steel that leads to its lower yield strength [48]. This lower dislocation density is attributed to a depletion of carbon in the martensite matrix during Q-P-T that is caused by a partitioning of carbon from the supersaturated martensite to retained austenite, a phenomenon that does not occur in Q&T steel due to the effective absence of retained austenite. According to the equation
C ( 0.35467) / 0.00467 14
[49, 50], the
carbon content of retained austenite can be determined from its lattice constant ( , 0.36068 nm) by measuring the 111 r diffraction peak. In this way, the carbon content of the retained austenite in Q-P-T steel was calculated to be 1.287 wt.% and the carbon content in the martensite was estimated as 0.067 wt.% based on the carbon content (0.20 wt.%) of the steel. If the change in the volume ratio of bcc and fcc phases caused by the reduction of carbon due to the precipitation of carbides from the martensitic matrix is ignored, it is clear that the carbon content of the martensite decreases from 0.20 to 0.067 wt.%, whereas the carbon content in the retained austenite increases from 0.20 to 1.287 wt.%. With the Q&T steel, however, the carbon content of the martensite remains at 0.20 wt.% if the precipitation of carbides is ignored. This partitioning of carbon leads to a “softening” of the martensite matrix in Q-P-T steel prior to deformation. Previous studies involving quasi-static tensile tests have indicated that the ρ̅A of retained austenite rapidly increases from 11.62×10¹⁴ m−2 before deformation to 42.16×10¹⁴ m−2 with an increase in the strain due to the multiplication of dislocations, which leads to a high strain hardening behavior. However, the ρ̅M of martensite does not exhibit a similar change, but instead decreases from 6.59×10¹⁴ m−2 before deformation to 4.99×10¹⁴ m−2 at 3% strain, and then gradually increases to 6.52×10¹⁴ m−2 at fracture, a value which is still lower than that before deformation [48]. This phenomenon was explained by the DARA effect, in that the reduction in ρ̅M during initial deformation reflects the fact that the number of dislocations transported to the retained austenite exceeds the number produced in the martensite by dislocation multiplication. Similarly, the gradual increase at 3% is consistent with the number of dislocations transported to the retained austenite becoming less than the number generated in the martensite. In Q&T steel, on the other hand, the linear increase in the ρ̅M of martensite from 6.78×10¹⁴ m−2 before deformation 15
to 7.85×10¹⁴ m−2 at fracture indicates that there is no DARA effect, most likely because of insufficient retained austenite [48]. This same DARA effect is evident in the Q-P-T samples of the present study, as evidenced by the fact that the ρ̅M of the T-C sample decreases from 6.59×10¹⁴ m−2 before deformation to 5.96×10¹⁴ m−2 at location No.1 in Table 5 with increasing strain, and then gradually increases to 6.56×10¹⁴ m−2 at position No. 2 and No. 3 in Table 5. Meanwhile, the ρ̅A of the retained austenite rapidly increases from 11.62×10¹⁴ m−2 before deformation to 33.12×10¹⁴ m−2 with increasing strain. It is worth noting here that the strain energy accumulated by dislocation multiplication inside the austenite grains is what provides the mechanical driving force needed for the strain-induced transformation of retained austenite that accompanies the formation of twinned martensite (Fig. 11(a) and (b)), which further hardens low-carbon Q-P-T martensitic steel. It is therefore believed that the high n value of Q-P-T steel stems from the low initial dislocation density in its martensitic matrix before deformation and the high strain hardening rate of retained austenite during deformation. Similarly, the low n value of Q&T steel stems from the high initial dislocation density in its martensitic matrix and low strain hardening rate during deformation. The softening of the martensitic matrix due to carbon depletion during the Q-P-T process and the DARA effect during deformation effectively enhance the formability of the martensitic matrix, as the soft retained austenite phase possesses an intrinsic ductility that leads to a high elongation in low-carbon Q-P-T martensitic steel. Since there is almost no retained austenite in Q&T steel, and very little softening of its martensite, it has a low elongation.
4.2 Effect of microstructure on formability Past research has indicated that the strain hardening exponent and plastic strain ratio of sheet 16
metals are the most important parameters influencing the FLD [19]; however, based on the analysis presented above, it is evident that the strain hardening exponent has a much greater influence on formability than the plastic strain ratio, which only affects the slope of the curve in the negative (tension-compression) region. The FLDs of low carbon Q-P-T and Q&T martensitic steel in Fig. 8 share similar features to that of low carbon Q&P martensitic steel [24], i.e., the minor strain in the tension-tension region is larger than that in tension-compression region, and is opposite to that of low alloying high strength steels [9, 12, 14, 51, 52]. It can also be seen in Fig. 8 that the formability of low-carbon Q-P-T martensitic steel is much better than that of Q&T steel, which reflects the difference in major strain under both plane strain and tension-tension strain conditions. With the increase in n and r that comes with Q-P-T steel compared to Q&T, the forming limit curves are shifted upward due to the fact that a higher strain hardening exponent generally delays the onset of instability until a higher strain is reached. This enhances the limiting strain, and is in agreement with the results reported by Ahmadi et al. [19]. As mentioned earlier, the high n value of Q-P-T steel stems from the initial low dislocation density in its martensitic matrix and high strain hardening rate of retained austenite, whereas the high r value is attributed to a high εu due to the DARA effect and transformation induced plasticity of retained austenite during deformation. In addition, both the softening of the martensitic matrix and soft retained austenite phase effectively enhance ductility in the biaxial stretching (tension-tension) region. The SEM images in Fig. 12 show shear fractures in this region of the Q-P-T and Q&T samples, revealing that shear bands are less prevalent in the former. This is because the softening of the martensitic matrix and high ductility retained austenite phase in the Q-P-T sample facilitate plastic deformation and reduce the formation of shear bands. This is 17
significant given that the occurrence of shear fracture rather than localized necking is known to reduce the ductility of sheet metals [53], thus leading to a decrease in formability. Dimples in the Q-P-T sample are also deeper than those in Q&T sample, and the Q-P-T sample exhibits more tearing ridges. These features further indicate the excellent ductility of Q-P-T steel, and when compared to the microstructure of the Q&T sample, it is reasonable to conclude that the formation of these dimples comes from the nucleation, growth and coalescence of microvoids in the martensitic matrix [14, 54]. In contrast, the formation of tearing ridges is the result of severe localized deformation caused by the fracture of retained austenite. The difference in microstructure between the two sample types is consistent with the higher strain hardening exponent of the Q-P-T steel. For example, calculations based on Eq. (7) indicate that the n value of a Q-P-T sample cut parallel to the rolling direction (0.1058) corresponds to a ε1 of 0.22, whereas an n value of 0.0468 in Q&T martensitic steel corresponds to a ε1 of 0.10. These values are consistent with the experimental values for the Q-P-T (0.24) and Q&T (0.13) samples, and show that the better formability of Q-P-T martensitic steel can generally be attributed to a higher strain hardening exponent and true uniform elongation.
5. Conclusions The mechanical properties and FLDs of Fe-0.20C-1.49Mn-1.52Si-0.58Cr-0.05Nb (wt.%) steel treated by a novel Q-P-T process and Q&T were measured through both uniaxial tensile tests and Nakazima punching tests. The microstructures of two sample types were then characterized by XRD, SEM and TEM. The main conclusions drawn from this are as follows: (1) Q-P-T martensitic steel consists of a martensitic matrix with retained austenite, while the 18
Q&T steel consists essentially of single-phase martensite. This difference in microstructure leads to a higher strain hardening exponent in Q-P-T martensitic steel accompanying with a lower yield ratio, and a higher true uniform elongation accompanying with a higher plastic strain ratio. (2) The high strain hardening exponent of Q-P-T steel stems from a low dislocation density in the martensitic matrix prior to deformation and a high strain hardening rate of the retained austenite. The high true uniform elongation, on the other hand, is attributed to a softening of the martensitic matrix during deformation due to the DARA effect and the TRIP effect of retained austenite. (3) The higher strain hardening exponent and plastic strain ratio of Q-P-T martensitic steel gives it superior formability to Q&T steel. (4) Fewer shear bands, deeper dimples and a greater number of tearing ridges were identified in the tension-tension region of the Q-P-T, implying better formability in this region.
Acknowledgements The work is financially supported by the National Natural Science Foundation of China (No. 51371117), and one of authors, Prof. Yonghua Rong, sincerely thanks Dr. Mingxin Huang in The University of Hong Kong for useful discussion on the formability of sheet metals.
References [1] S. Panich, F. Barlat, V. Uthaisangsuk, S. Suranuntchai, S. Jirathearanat, Mater. Des. 51 (2013) 756-766. [2] A.-P. Pierman, O. Bouaziz, T. Pardoen, P.J. Jacques, L. Brassart, Acta Mater. 73 (2014) 19
298-311. [3] I.B. Timokhina, P.D. Hodgson, E.V. Pereloma, Metall. Mater. Trans. A 35 (2004) 2331-2341. [4] K. Chung, K. Ahn, D.-H. Yoo, K.-H. Chung, M.-H. Seo, S.-H. Park, Int. J. Plast. 27 (2011) 52-81. [5] J. Speer, D.K. Matlock, B.C. De Cooman, J.G. Schroth, Acta Mater. 51 (2003) 2611-2622. [6] T.Y. Hsu, Z.Y. Xu, Mater. Sci. Forum 561-565 (2007) 2283-2286. [7] O. Bouaziz, H. Zurob, M.X. Huang, Steel res. int. 84 (2013) 937-947. [8] H.B. Campos, M.C. Butuc, J.J. Grácio, J.E. Rocha, J.M.F. Duarte, J. Mater. Process. Technol. 179 (2006) 56-60. [9] M.Y. Demeri, F. Inc, ASM Handbook, 14B (2006) 530-538. [10] M.Y. Demeri, Metall. Trans. A 12 (1981) 1187-1196. [11] C.G. Lee, S.-J. Kim, T.-H. Lee, S. Lee, Mater. Sci. Eng. A 371 (2004) 16-23. [12] B.C. De Cooman, O. Kwon, K.-G. Chin, Mater. Sci. Technol. 28 (2012) 513-527. [13] L. Leotoing, D. Guines, I. Zidane, E. Ragneau, J. Mater. Process. Technol. 213 (2013) 856-863. [14] R. Narayanasamy, C.S. Narayanan, Mater. Sci. Eng. A 417 (2006) 197-224. [15] S.P. Keeler, Ph.D. Thesis, MIT, Boston, (1961). [16] M. Gensamer, Trans. ASM 36 (1946) 30-60. [17] S.P. Keeler, W.A. Backofen, Trans. ASM 56 (1963) 25-48. [18] G.M. Goodwin, SAE Int. 680093 (1968) 380-387. [19] S. Ahmadi, A.R. Eivani, A. Akbarzadeh, Comput. Mater. Sci. 44 (2009) 1252-1257. [20] R.L. Whiteley, Trans. ASM 52 (1959) 154-179. 20
[21] K. Sugimoto, CAMP-ISIJ 11 (1998) 400-403. [22] S.K. Kim, H.C. Shin, J.H. Chung, Y.W. Chang, J. Kor. Inst. Met. Mater. 36 (1998) 151-156. [23] M. Bhargava, A. Tewari, S.K. Mishra, Mater. Des. 85 (2015) 149-155. [24] L. Wang, J.G. Speer, Metallogr. Microstruct. Anal. 2 (2013) 268-281. [25] J.G. Speer, D.V. Edmonds, F.C. Rizzo, D.K. Matlock, Curr. Opin. Solid State Mater. Sci. 8 (2004) 219-237. [26] D.P. Koistinen, R.E. Marburger, Acta Metall. 7 (1959) 59-60. [27] K. Zhang, M.H. Zhang, Z.H. Guo, N.L. Chen, Y.H. Rong, Mater. Sci. Eng. A 528 (2011) 8486-8491. [28] R.F. Zhang, J. Wang, I.J. Beyerlein, T.C. Germann, Scripta Mater. 65 (2011) 1022-1025. [29] J. Wang, A. Misra, R.G. Hoagland, J.P. Hirth, Acta Mater. 60 (2012) 1503-1513. [30] G. Lasko, D. Saraev, S. Schmauder, P. Kizler, Comput. Mater. Sci. 32 (2005) 418-425. [31] S. Shao, S.N. Medyanik, Model. Simul. Mater. Sci. Eng. 18 (2010) 055010. [32] Y.H. Rong, Int. Heat Treat. Surf. Eng. 5 (2011) 145-154. [33] Y. Wang, K. Zhang, Z.H. Guo, N.L. Chen, Y.H. Rong, Acta Metall. Sin. 48 (2012) 641-648. [34] Y. Wang, K. Zhang, Z.H. Guo, N.L. Chen, Y.H. Rong, Mater. Sci. Eng. 552 (2012) 288-294. [35] S.W. Qin, Y. Liu, Q.G. Hao, Y. Wang, N.L. Chen, X.W. Zuo, Y.H. Rong, Metall. Mater. Trans. A 46 (2015) 4047-4055. [36] J.H. Hollomon, Trans. AIME 162 (1945) 268-290. [37] G.E. Dieter, Mech. Metall. (3rd edn.), McGraw-Hill, New York, (1986) 292-293. [38] Standard Test Method for Plastic Strain Ratio r for Sheet Metal, E517-00 (2010). [39] D. Anand, M.S. Thesis, Ryerson University, Toronto, Ontario, Canada, (2004). 21
[40] L.J. Kilfoil, M.S. Thesis, Queen’s University, Kingston, Ontario, Canada, (2007). [41] A.R. Ragab, B. Baudelet, J. Mech. Work Technol. 6 (1982) 267-276. [42] Z. Marciniak, K. Kuczynski, Int. J. Mech. Sci. 9 (1967) 609-620. [43] K. Nakajima, T. Kikuma, K. Hasuka, Technical report, Yawata, 264 (1968) 8517-8526. [44] Standard Test Method for Determining Forming Limit Curves, E2218-02 (2008). [45] J. Durnin, K.A. Ridal, J. Iron Steel Inst. 206 (1968) 60-67. [46] W. Woo, L. Balogh, T. Ungár, H. Choo, Z.L. Feng, Mater. Sci. Eng. A 498 (2008) 308-313. [47] W. Li, W.Z. Xu, X.D. Wang, Y.H. Rong, J. Alloy. Compd. 474 (2009) 546-550. [48] Q.G. Hao, S.W. Qin, Y. Liu, X.W. Zuo, N.L. Chen, W. Huang, Y.H. Rong, Mater. Sci. Eng. A 662 (2016) 16-25. [49] K. Sugimoto, T. Iida, J. Sakaguchi, T. Kashima, ISIJ int. 40 (2000) 902-908. [50] K. Sugimoto, M. Kobayashi, A. Nagasaka, S. Hashimoto, ISIJ int. 35 (1995) 1407-1414. [51] K.S. Choi, A. Soulami, W. Liu, X. Sun, M. Khaleel, SAE Int. J. Mater. Manuf. 4 (2011) 75-83. [52] R. Narayanasamy, N.L. Parthasarathi, C.S. Narayanan, Mater. Des. 30 (2009) 1310-1324. [53] A.S. Korhonen, T. Manninen, Mater. Sci. Eng. A 488 (2008) 157-166. [54] R. Narayanasamy, N.L. Parthasarathi, C.S. Narayanan, T. Venugopal, H.T. Pradhan, Mater. Des. 29 (2008) 1868-1885.
22
Figure captions Fig. 1 FLD and schematic of tool geometry for modified Nakazima (out-of-plane) test (dimensions are in mm) Fig. 2 Geometry of Q-P-T and Q&T steel specimens Fig. 3 Deformed shapes of (a) Q-P-T and (b) Q&T samples after Nakazima testing Fig. 4 Typical FLD showing the five main strain states of sheet forming Fig. 5 Engineering stress vs. engineering strain for (a) Q-P-T and (b) Q&T steel sheets at 0°, 90° and 45° to their rolling direction Fig. 6 True stress vs. true strain for (a) Q-P-T and (b) Q&T steel sheets at 0°, 90° and 45° to their rolling direction Fig. 7 Plots of true stress vs. true strain for (a, c, e) Q-P-T and (b, d, f) Q&T steel Fig. 8 Experimentally determined forming limit diagrams of: (a) Q-P-T steel, (b) Q&T steel sheets and (c) comparison of fitted FLDs for Q-P-T and Q&T steel Fig. 9 XRD spectra of Q&T and Q-P-T steel at different strain states for: (a) undeformed, (b) T-C, (c) P-S and (d) T-T FLD samples Fig. 10 (a) BF TEM micrograph and (b) DF image with SAED pattern of retained austenite in Q-P-T steel. (c) BF image and (d) DF image with SAED pattern of retained austenite in Q&T steel Fig. 11 (a) BF TEM micrograph and (b) DF image with SAED pattern of twinned martensite plates in Q-P-T steel Fig. 12 SEM images showing the fracture surfaces of (a) Q-P-T and (b) Q&T steels under tension-tension (T-T) strain conditions
23
Table 1 Geometry of Q-P-T and Q&T steel sheet specimens Size (mm) a b L t Counts
Specimen 1 80 20 180
2 100 40 180
3 120 60 180
4 140 80 180
3
3
3
3
5 160 100 180 1.8 3
6 180 120 180
7 180 140 180
8 180 160 180
9 180 180 180
3
3
3
3
Table 2 Mechanical properties of Q-P-T and Q&T steels obtained from uniaxial tensile tests Steel
YS/ UTS
Direction
YS (MPa)
UTS (MPa)
TE (%)
PSE (MPa·%)
( s / b )
0º 45 º 90 º 0º 45 º 90 º
1046 1037 1049 1278 1267 1216
1288 1268 1281 1387 1368 1299
16.9 16.4 16.1 10.9 10.5 9.8
21767 20795 20624 15118 14364 12730
0.8121 0.8178 0.8189 0.9214 0.9262 0.9361
Q-P-T
Q&T
Table 3 Formability parameters of Q-P-T and Q&T steels Steel Q-P-T
Q&T
Direction
u (%)
0º 45 º 90 º 0º 45 º 90 º
10.5 10.2 10.1 3.9 3.6 3.3
u (%) 10.3
3.6
n 0.1058 0.0923 0.0928 0.0468 0.0401 0.0371 24
n 0.0958
0.0410
K (MPa)
r
1812 1725 1750 1664 1607 1511
0.2406 0.2731 0.2998 0.1425 0.1793 0.1839
r 0.2717
0.1713
Table 4 Details of forming limit strains
Sample
Plane strain
Major strain
Minor strain
Major strain
Major strain
Minor strain
( 1 )
( 2)
( 1 )
( 1 )
( 2)
( 1 )
0.26 0.24
-0.09 -0.08
0.24 0.13
0.51 0.45
0.25 0.19
0.22 0.10
Q-P-T Q&T
Tension-tension strain
FLD0T
Tension-compression strain
Major strain
Table 5 Microstructure parameters of martensite and retained austenite in Q-P-T steel with different strain paths Sample
No.
M (×1014 m−2)
A (×1014 m−2)
Undeformed
0 1 2 3 1 2 3 1 2 3
6.59±0.23 5.96±0.14 6.37±0.09 6.56±0.23 5.99±0.18 6.27±0.17 6.53±0.21 5.93±0.13 6.35±0.19 6.57±0.27
11.62±0.83 26.29±0.21 33.12±0.32
(T-C)
(P-S)
(T-T)
25
26.32±0.21 33.52±0.06 26.44±0.26 33.66±0.64
VRA (%) 10.8 9.9 6.8