Relative Debugging for a Highly Parallel Hybrid Computer System Luiz DeRose, Andrew Gontarek, Aaron Vose, Robert Moench
David Abramson, Minh Ngoc Dinh, Chao Jin
Cray Inc. Cray Plaza, 380 Jackson St, Saint Paul, MN, United States
University of Queensland Brisbane, Queensland, Australia +61-7-336 56131
{ldr, andrewg, avose, rwm}@cray.com
{david.abramson, m.dinh1, c.jin}@uq.edu.au
ABSTRACT Relative debugging traces software errors by comparing two executions of a program concurrently - one code being a reference version and the other faulty. Relative debugging is particularly effective when code is migrated from one platform to another, and this is of significant interest for hybrid computer architectures containing CPUs accelerators or coprocessors. In this paper we extend relative debugging to support porting stencil computation on a hybrid computer. We describe a generic data model that allows programmers to examine the global state across different types of applications, including MPI/OpenMP, MPI/OpenACC, and UPC programs. We present case studies using a hybrid version of the ‘stellarator’ particle simulation DELTA5D, on Titan at ORNL, and the UPC version of Shallow Water Equations on Crystal, an internal supercomputer of Cray. These case studies used up to 5,120 GPUs and 32,768 CPU cores to illustrate that the debugger is effective and practical.
Categories and Subject Descriptors D.2.5 [Software Engineering]: Testing and Debugging – debugging aids, testing tools.
General Terms Design, Languages, Performance.
Keywords Parallel debugging; Hybrid Programming; Scalability
1. INTRODUCTION To take advantage of architectural innovation in current supercomputers, existing scientific applications are often translated into different programming models and languages. However, guaranteeing the correctness of converted programs is challenging, and finding errors can be difficult. A hybrid supercomputer containing heterogeneous processors and a deep memory hierarchy allows programmers to exploit multiple levels of parallelism. A variety of programming techniques, such as MPI [52], OpenMP [40], OpenACC [53], and PGAS (Partitioned Global Address Space) [6] languages, can be used to achieve increased performance at three different levels of parallelism: Permission to make digital or hard copies of all or part of this work for personal or classroom use is granted without fee provided that copies are not made or distributed for profit or commercial advantage and that copies bear this notice and the full citation on the first page. Copyrights for components of this work owned by others than ACM must be honored. Abstracting with credit is permitted. To copy otherwise, or republish, to post on servers or to redistribute to lists, requires prior specific permission and/or a fee. Request permissions from
[email protected]. SC '15, November 15-20, 2015, Austin, TX, USA © 2015 ACM. ISBN 978-1-4503-3723-6/15/11…$15.00 DOI: http://dx.doi.org/10.1145/2807591.2807605
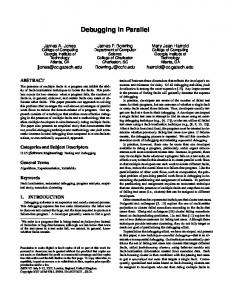
message passing, shared memory threads, and vectorization. Using multiple programming techniques within one program significantly complicates software development and portability, and correspondingly increases the chances of errors. It is critical to provide an efficient way to validate the correctness of computing results across different programming languages and to detect the root cause of any errors during program conversion. One simple but effective way of validating the correctness of the conversion is to compare the results of a ported version against those of the initial trusted version [43]. In order to achieve this, programmers often resort to executing printf and diff commands to detect the numerical errors. However, this ad-hoc approach is impractical in large-scale programs that decompose the data across a deep memory hierarchy for a number of reasons. First, comparing data between two programs that have different data partitioning schemes requires the programmer to fetch each piece of distributed data and to reconstruct the global data structure manually, as illustrated in Figure 1. This process is labor-intensive and error-prone. Second, IO commands like printf cannot handle the enormous parallelism and memory size of a hybrid supercomputer. Especially when comparing two large data sets, the ad-hoc method using printf and diff is extremely timeconsuming. Third, accessing data located on GPUs is difficult [39] and this exacerbates the complexity of reasoning about data that is decomposed on an accelerator-based cluster at runtime. Similarly, most existing debugging tools only allow programmers to select an individual thread, process or kernel before investigating errors. However, validating the global state of a hybrid program at runtime is rarely provided. Relative Debugging [14] assists a programmer to locate errors by observing a divergence in relevant data structures between two versions of the same program as they are executing. It was initially proposed to simplify parallelizing sequential codes [14][15]. Specifically, relative debugging releases programmers from managing the complicated control flow of a parallel program, but instead it allows them to focus on the incremental updates in key data structures. In this paper, we extend relative debugging for porting stencil computation on hybrid supercomputers. We argue that relative debugging is an effective way of validating the global state of large-scale hybrid programs. In addition, it helps programmers find faulty sections by narrowing a suspicious region of a large program to a manageable area using a divide and conquer strategy. Further, relative debugging allows a programmer to concentrate on where two related codes are producing different results without concern for the complexity of reconstructing decomposed data in scientific applications. It is effective for locating errors such as those caused by changing the runtime environment, for example, the number of processors in a largescale system, and switching between CPUs and GPUs.
This paper describes three significant innovations required for hybrid computing: • A generic data model for generalizing different partitioning schemes used in stencil computations at different levels of parallelism on hybrid machines; • Support for data comparison across a mix of programming models and languages: message passing, threading, and vectorization; and • A performance evaluation of data comparison methods and two optimizations that improve the speed of data comparison on a large-scale hybrid machine. This paper presents a relative debugger, called the Cray Comparative Debugger (CCDB), which allows a programmer to inspect the global state between (and across) different programming techniques, including hybrid MPI/OpenMP, MPI/OpenACC, and UPC [55], with a uniform method. CCDB allows programmers to compare a large amount of data, otherwise distributed across hybrid processors, by constructing a global view of data structures at runtime. We demonstrate the effectiveness of relative debugging by investigating bugs in some real world programs, such as a hybridized version of DELTA5D [44] running on Titan, a supercomputer at ORNL with 5,120 GPUs [54], and a UPC version of Shallow Water Equations [13] running on Crystal, a Cray internal supercomputer with 32,768 CPU cores. In addition, we evaluated CCDB’s performance with two large-scale experiments running on Titan and Crystal respectively to demonstrate that the techniques scale up and are practical for realworld large-scale applications. These case studies are the largest we have ever attempted, and also represent the widest range of programming systems, and illustrate the effectiveness of the new work discussed in this paper. The remainder of the paper is organized as follows. Section 2 presents our motivation. Section 3 discusses new features required for hybrid computing. Section 4 presents an enhanced global data model that generalizes different partitioning schemes. Section 5 discusses how to perform data comparison between programs written in different languages. Section 6 presents two optimizations to improve the efficiency of data comparison. Section 7 describes case studies and the performance evaluation of CCDB on Titan and Crystal. Section 8 discusses related work. Finally Section 9 presents our conclusion and future work.
physical processes affected the solution [31]. This method of detecting errors is so complicated that only experts who understand the physical processes can use it. To simplify validating the ported program, and to help a programmer find the root cause of any errors, relative debugging was proposed in the mid 1990s. Typically, the ported program and the original version compute the same set of data. Relative debugging assumes that both versions’ global state should be very similar at runtime. Therefore, verifying this invariance at runtime can assist programmers to locate errors efficiently [14][15]. Using declarative assertions, relative debugging automates comparing the suspect program’s runtime states to the reference program. An example of an assertion is illustrated as follows:
2. MOTIVATION
3. RELATIVE DEBUGGING FOR HYBRID PROGRAMS
A large number of hybrid supercomputers already contain accelerators such as NVIDIA’s GPGPU, and coprocessors such as Intel’s Xeon Phi. In order to take advantage of these, applications need to be ported to a new platform as quickly and cheaply as possible. A variety of programming abstractions are provided to address parallelism on a hybrid computer, with different trade-offs between performance and programming complexity. Programmers typically select one to meet different goals when porting code, such as pursuing better performance or achieving easier maintainability. However, verifying the correctness of the ported program is still challenging. For instance, S3D [30], a massively parallel DNS (Direct Numerical Simulation) solver developed at Sandia National Laboratories, was recently hybridized using MPI and OpenACC. However, testing and debugging was difficult [31]. S3D was first ported to OpenMP before it was translated to OpenACC, taking advantage of the common regions shared by both OpenMP and OpenACC. At each step, the revised code was verified with a series of physics-based comprehensive examinations. Using these physics-based tests, errors were found by observing how different
assert $ref::
[email protected]:65 = $sus::
[email protected]:68 In the above example, $ref and $sus are the process set of the reference version and suspect version respectively, while the assertion compares the value of large variable in “trusted.c” at line 65 with the value of super variable in “ported.c” at line 68. During a debugging session, a programmer can define as many assertions as necessary. In addition, the programmer can add new assertions iteratively to refine a suspect code region until it is small enough to inspect manually. Prior to this work, our implementations [14][26] did not support hybrid computers. In this paper, we investigate stencil computation to demonstrate the effectiveness of relative debugging for hybrid computing. Stencil computation represents a large fraction of scientific simulation, and is used in solving PDE (Partial Differential Equations), complex multigrid, and adaptive mesh refinement methods. It is found in weather and atmospheric simulations [32], fluid dynamics, simulations of chemical process [2]. Hybrid computers equipped with GPGPUs have been shown to execute stencil code efficiently [3][46]. The Global Matrix (A) 1 2 3 4
Initial Program
Data Decomposition at Runtime 1
2
3
4
! !
! !
Row-based partition
!!!! !!!!
a b c d
Ported Program
Column-based partition
diff ?
! !
a
! !
b
c
d
Figure 1. print+diff cannot compare distributed data sets.
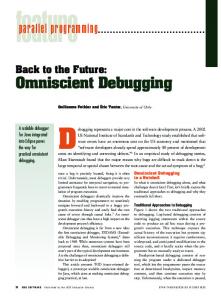
The data of a hybrid application is typically partitioned across two layers [51]: inter-process and intra-process. With the interprocess partition, the global data is decomposed across a number of processes residing on different compute nodes. With the intraprocess decomposition, each process’s data chunk is split between CPUs and accelerators and is shared by a group of threads, which are either CPU or GPU threads. Accordingly, a variety of datadecomposition methods are used in a mixed manner with different programming techniques for hybrid computing. For example, using MPI, programmers manually partition data across processes, while UPC decomposes the global data in a transparent manner. OpenMP supports directive-based parallelization using a group of shared-memory threads on the CPU, while OpenACC expects the compiler to identify code that can be accelerated with programmer specified directives and allows a programmer to move data between CPU memory and accelerator memory using directives. Figure 2 illustrates an example of a global matrix partitioned into 16 sub-arrays, which are processed by a set of specific processes, such as OpenMP, OpenACC or UPC processes.
follows. Let 𝑑𝑎𝑡𝑎[𝑑! , … , 𝑑! ] denote the shape of an array, in which k is the dimension count of the array and di is the size of the array’s i-th dimension, in which 1 ≤ 𝑖 ≤ 𝑘 . Function 𝒃𝒍𝒐𝒄𝒌𝒎𝒂𝒑(𝐴, 𝑚! , … , 𝑚! ) represents the decomposition geometry of a global array, denoted by A, in which mi is the number of partitions on the i-th dimension. The partition function decomposes the global array into blocks. Each block consists of a number of contiguous elements computed by an independent processing unit, such as a process, or a thread. In real world applications, the actual data partition includes its halo cells, which is denoted 𝒉𝒂𝒍𝒐(𝐴, 𝑔! , … , 𝑔! ) and gi is the halo’s depth on the i-th dimension. For instance, given the 2D array 𝐴 = 𝑑𝑎𝑡𝑎[16,32] shown in Figure 2, 𝒃𝒍𝒐𝒄𝒌𝒎𝒂𝒑(𝐴, 4,4) indicates that A is partitioned into 16 sub-arrays of 𝑑𝑎𝑡𝑎[4,8] using a block-block decomposition scheme, in which the halo cells for each sub-array is h= 𝒉𝒂𝒍𝒐(𝐴, 1,1). This model represents data partitions applied to different levels of parallelism, such as inter-process, interthread or inter-device. Recursively applying it can represent multiple-level data decomposition. The global array A=data[16,32] 32
Block-block based data decomposition
P4
P6
16
8
P15
4
max_cont_size = 8
Halo Cells
Flattened global array
4. A GENERIC DATA MODEL Stencil codes [33] typically compute a space and time discrete simulation that is represented using a matrix. During the simulation, each element updates its state according to its own state and its neighbors’ states in previous time steps. To parallelize the execution, the matrix is decomposed into a number of smaller chunks using grids. Each piece of partitioned data can then be processed using a thread or process. Computing the data points at the borders of each chunk requires the values of elements from its neighboring partitions, which are called halo cells [22]. This type of decomposition is typically a block-block based data distribution scheme [33][51], although other regular patterns are also possible.
4.1 Limitation of Previous Work Our previous work [35] The global array A=data[16,32] composes partitioned data only for MPI applications with simple cases, as illustrated in the figure on the right. Using a special declarative command, blockmap P1 P15 P0 [35], a data structure partitioned MPI Processes across MPI processes is collected by a client and forms a global state which can be compared to detect differences between two MPI programs (or an MPI program and a sequential one). Using blockmap, a programmer can express block and cyclic data distribution [28] across MPI processes, while the debugger uses it to construct a global view of the data at runtime. However, previous work did not handle halo cells that are widely used in real world applications, and it could not debug hybrid applications because it did not handle data partitioning between threads in shared memory and accelerators.
4.2 Generalizing Different Partition Schemes In this paper, we generalize our previous work for various partition schemes adopted in different programming methods for stencil computations. We define the generic data model as
Flattened P4
Flattened P6
CPU Threads
CPU Threads
OpenMP Process
UPC Process
Flattened P15
CPU Copy GPU Copy
Constructing the global array
Applying declarative assertions to hybrid applications must address several challenges. First, comparing two sets of online data should handle the different data partitioning schemes used at different levels of parallelism. Second, data comparison across different programming languages and models is required. Third, although applying declarative assertions to the small-scale execution of a suspect program can detect many errors, there are still critical bugs that only occur with the large-scale runs [25]. Therefore, an efficient data comparison solution that can handle a large amount of data is needed. To bridge the variety of data partitioning schemes used in practice at different levels of parallelism, we propose a generic data model for general stencil computations on a hybrid computer. Using this model, a global view of relevant data structures is automatically reconstructed across different types of applications at runtime. This enables a programmer to reason about a data set that is decomposed on a hybrid cluster from a global point of view without concern for the actual decomposition scheme. To support relative debugging with different programing techniques, we have extended our existing debug server architecture to provide decomposition-independent comparison across OpenACC, OpenMP, and UPC programs. Further, two performance optimizations have been applied to improve the efficiency of data comparison significantly. CCDB’s architecture, interface, and debugging methodology for hybrid computing are similar to our previous work [14][35], which are summarized in the Appendix.
OpenACC Process
The state of sub-array at runtime in different applications
Figure 2. Constructing a 2D global matrix for hybrid programs. 𝐶! = 𝑺𝒍𝒊𝒄𝒆𝑯𝒂𝒍𝒐𝑶𝒇𝒇 𝐶!! , ℎ , 1 ≤ 𝑗 ≤ 𝑛
(1)
𝐴 = 𝑪𝒐𝒏𝒄𝒂𝒕𝒆𝒏𝒂𝒕𝒆 𝑭𝒍𝒂𝒕𝒕𝒆𝒏 𝐶! , 1 ≤ 𝑗 ≤ 𝑛
(2)
𝑚𝑎𝑥_𝑐𝑜𝑛𝑡_𝑠𝑖𝑧𝑒 =
!! !!!! 𝑚! !!!
(3)
Reconstructing the original global data, we need to remove the halo cells to generate the original partitioned chunk without any halo boundaries and map each chunk into the global data structure. These two steps are achieved using re-composing algebra, as noted in Equation (1) ~ (3). Creating the global view for a multi-dimensional array requires concatenating all of its subarrays together in physical memory, which is always onedimensional. Given n sub-arrays with halo cells, denoted by ! ! 𝐶!! = 𝐴 𝑥 !! , … , 𝑥 ! ! (1 ≤ 𝑗 ≤ 𝑛) , each of them is flattened to form a one dimensional sub-array after removing its halo ! ! ! ! ! boundary, in which 𝑥′! = 𝑙′! : ℎ′! and 𝑙′! and ℎ′! are the lowest and ! highest rank of 𝐶′! on the i-th dimension respectively. Each sub!
!
array without halo boundaries is denoted by 𝐶! = 𝐴 𝑥! , … , 𝑥! , as !
!
!
illustrated in Equation (1), in which 𝑥! = 𝑙! : ℎ! . Using Equation (2), they are mapped back to the original global data. The process that flattens these sub-arrays and then concatenates them to form a one-dimensional global array is illustrated in Figure 2. In order to minimize the memory copy overhead of concatenating the flattened sub-arrays, Equation (3) decides the maximum continuous elements that can be copied each time. Finally, the flatted global array will be morphed to form the original multi-
dimensional matrix. In case that no halo cell is specified, only Equation (2) and (3) are required to construct the global array.
4.3 Decomposition-independent Comparison Large data sets are both too big to reassemble in a centralized manner, and are too large to compare sequentially. Thus, the generic data model described to date should facilitate data comparison in parallel. In order to compare two data sets that are decomposed using different partition schemes, we detect the maximum continuous elements between them, which are called basic comparison block (BCB), denoted as 𝐵𝐶𝐵 = 𝑑𝑎𝑡𝑎[𝑑!! , … , 𝑑!! ]. The partition schemes used in the reference program and suspect program are denoted by 𝑅 = 𝒃𝒍𝒐𝒄𝒌𝒎𝒂𝒑 (𝐴, 𝑚!! , … , 𝑚!! ) and S = 𝒃𝒍𝒐𝒄𝒌𝒎𝒂𝒑 (𝐴, 𝑚!! , … , 𝑚!! ) respectively. An overlap operation is applied to R and S to detect the maximal comparable sub-blocks. Specifically, the overlap operation computes the size of BCB’s every rank using Equation (4) for each dimension of the two different data decompositions. The Global Matrix (A) $suspect
$reference
!!!! !!!!
1 2 3 4
Basic Comparison Block (BCB) 1
Overlap(R,S)! 23
4
a b c d
a b c d
$reference
2
3
Control Flow Data Movement
4
Comparing BCBs pair by pair
$suspect a
b
c
CCDB Server
AIF Data
Data Decomposition at Runtime 1
The generic data model and decomposition-independent comparison can be realized in different ways. CCDB facilitates this function across MPI/OpenMP, MPI/OpenACC, and UPC programs by conducting comparison at the inter-process partition level. This converts the various data decomposition at different parallelism layers into a unified representation. CCDB servers restore the data decomposed by different data manipulation policies in a specific programming technique at runtime and locate the partitioned chunks assigned to each message passing process. For example, in OpenMP, the data processed by multiple threads using shared memory should be accessed only when its update is synchronized across all the threads. In OpenACC, an offloaded variable is dynamically copied between CPU and GPU during the execution of the code. Therefore, constructing the global data view for OpenACC processes must automatically detect where the targeted data resides and retrieve it from either the GPU memory, or CPU memory, without the user specifying the location for variables. Similarly, an array in UPC that is allocated dynamically requires to be tracked and located automatically for data comparison. Original Data
blockmap(A, 4, 4)
R = blockmap(A, 4, 0) S = blockmap(A, 0, 4)
5. DATA COMPARISON ACROSS DIFFERENT PROGRAMMING MODELS
MPI Code
CUDA-GDB
GDB
OpenMP Code
UPC Code
Mul$%threaded, debugging,
Tracking, dynamic,data,
CPU Code
GPU Code
Accessing,data,from,both,GPU, and,CPU,
d
Figure 3. Conducting an overlap operation to detect BCBs. 𝑑!! = 𝑔𝑟𝑒𝑎𝑡𝑒𝑠𝑡_𝑐𝑜𝑚𝑚𝑜𝑛_𝑑𝑖𝑣𝑖𝑠𝑜𝑟 𝑚!! , 𝑚!! ,1 ≤ 𝑖 ≤ 𝑘
(4)
Figure 3 illustrates an example of conducting an overlap operation to identify the sub-blocks that can be compared directly across a row-major decomposition and a column-major partition.
4.4 The Interface of Data Model Construction CCDB uses the size of the global data and its partitioning scheme to construct the global view. To identify them, CCDB provides two methods: automatic and semi-automatic. The automatic way is used for programing languages, such as UPC, in which data decomposition information can be detected. To distribute shared array variables, UPC maps array elements across different threads using affinity [57], which allows a programmer to describe different domain decompositions such as block and cyclic [28]. To reconstruct global data decomposed in UPC, CCDB retrieves affinity metadata, and automatically detects the partitioning scheme. Throughout the UPC debugging session, this (automatically created) partition scheme is linked to its variable symbol to reconstruct global-shared arrays for data comparison. In contrast, the semi-automatic way applies to programming techniques, such as MPI, that do not have the global data size and partition information. A programmer defines them explicitly using the blockmap construct. As we noted earlier, blockmap has been extended to support the generic data model with halo cells. Languages that manage the decomposition process make it easier for the programmer both during data construction and debugging. Whilst the semi-automatic method requires programmer intervention, it is necessary because the decomposition information is never represented declaratively, and is effectively coded in the way the program is written.
Previous work
New Contribution
Figure 4. CCDB server for cross-model data comparison.
5.1 Limitation of Previous Work Our previous work [35] only handled MPI applications, as shown in Figure 4. CCDB has been extended substantially to debug UPC programs, to provide multi-threaded debugging for OpenMP, and to control hybrid OpenACC programs. With the new extensions, shown in Figure 4, CCDB servers can cooperate with the client to enable data comparison across different types of hybrid applications.
5.2 OpenACC OpenACC hides the details of CUDA [39], like threads and blocks [50], from programmers by augmenting a sequential program with user specified directives. Programmers can specify the regions of an OpenACC program to be offloaded to the accelerator device, called compute regions, while the rest of the program is executed on the host CPU. The address spaces for the CPU and GPU codes are separated, and programmers can move an offloaded variable between the CPU and the GPU using OpenACC directives at runtime. However, accessing data residing on the GPU may incur a large overhead The CCDB server, which can only execute on the CPU cores, needs to retrieve offloaded data automatically from either the GPU memory, or CPU memory, in an OpenACC process, without users specifying the memory address. In addition, accessing the variables residing on the device should be done efficiently. As an extra complication, CPUs and GPUs may use different floatingpoint representations. Therefore, the floating-point numbers processed by both CPU and GPU cannot be bitwise compared due to inconsistent precision.
In order to resolve the above issues, a CCDB server uses an instance of CUDA-GDB to debug the OpenACC program as illustrated in Figure 4. As part of this work, we have improved the original version of NVIDIA CUDA-GDB to facilitate debugging OpenACC on Cray systems. We modified CUDA-GDB to move the data of a targeted GPU variable residing on the GPU device into the memory space of CUDA-GDB automatically, which is in the memory of the host. To enable comparing floating-point numbers across GPU and CPU, CCDB allows the programmer to set a tolerance threshold that is used to truncate the floating-point numbers to the same precision before they are compared. Using CUDA-GDB, the CCDB server can pause the execution of an OpenACC program at any line of interest within a compute region and subsequently access the data of a targeted variable residing on the GPU memory. This enhancement aids the client to construct the global view for data in both the CPU and GPU memories.
5.3 OpenMP OpenMP processes contain both sequential and parallel regions. To construct a global view of a given data structure, each debug server identifies the section of data to be compared. In case the data is located in a sequential region, it is straightforward, because data is always updated coherently and consistently by one thread. However, in a parallel region, a number of shared memory parallel threads execute independently. Before copying the shared data, CCDB needs to guarantee that each of the parallel threads pauses at the same breakpoint specified in the assertion. GDB provides multi-threaded debugging with two options: non-stop mode and all-stop mode. The non-stop mode allows other threads to continue running when one thread stops, while the all-stop mode pauses all threads at the same time. Combing the non-stop mode with GDB’s asynchronous command execution, the CCDB server can control all of the parallel threads to stop at the desired position before fetching the required data. This allows declarative assertions to work correctly with OpenMP processes.
5.4 UPC UPC requires the debugger to track the global data that is dynamically allocated in large-scale UPC programs. Both the global size and local size of each dynamic array are not provided by the UPC runtime. Therefore, CCDB must detect these sizes in an automatic manner, and retrieve the data in each UPC thread correctly. To address this issue, CCDB infers the size of the global array using the information provided by the UPC runtime, such as the number of UPC threads and the affinity data. In addition, CCDB expects the user to specify the type cast explicitly when inspecting a pointer variable. The debugger finalizes the global size of the (dynamically allocated) array by cross checking the user-provided information against CCDB’s calculation. To retrieve the local portion of a global shared array, CCDB detects the start address of the allocated block from the UPC runtime, and calculates the amount of data allocated to the corresponding UPC thread. With such enhancement, CCDB can construct the global data manipulated by UPC for comparison.
6. SCALABLE DATA COMPARISON Our previous work [16][35] implemented a hash-based method and a point-to-point (P2P) technique for comparing large data sets in pure MPI applications. These two methods avoid reassembling a global structure in the client, and distribute much of the comparison to the back-end servers [16][35]. They are inherently scalable because more resources are available to parallelize data comparison as the machine size increases. Specifically, the hashing scheme replaces each data structure with a hashed signature, which is much smaller than the original data,
and can be transferred back to the head node. Alternatively, the P2P technique allows debug servers to communicate data directly using TCP sockets, and compare without reassembling the global view on a single node. These two methods allow programmers to compare large data structures on supercomputers, and have been described elsewhere [16][35]. However, when they were modified to handle large-scale stencil computations, we found a number of assumptions in the implementation did not scale as well as expected.
6.1 Scalability Bottleneck of Previous Work Both the hash-based and P2P methods parallelize data comparison and reduce data traffic between the client and servers. To further improve scalability, we used the MRNet library [41] to facilitate client-server communication, which provides a hierarchical tree-based communication substrate. However, previous work created significant aggregation overheads and generated a large amount of unnecessary network traffic at scale. In addition, servers used in P2P comparison distributed socket information using Lustre, a distributed file system. On large-scale systems, this generated a large amount of concurrent small disk I/O operations that caused a significant overhead and slowed down the startup time significantly.
6.2 Optimizations Given two sets of partitioned data, CCDB first detects an appropriate granularity of data to compare. CCDB computes an overlap region using Equation (4) to detect BCB pairs that can be compared directly. When data is partitioned with halo cells, CCDB servers remove them from each data partition using Equation (1). For hashing, CCDB passes data to a hash function in parallel for each BCB in the back-end servers. The hash signatures are then compared sequentially in the client. The P2P technique, in contrast, communicates each BCB’s original data directly between CCDB servers, and the BCB pairs are compared in parallel as shown in Figure 13.
6.2.1 Scalable Collection of Comparison Results The hash signatures and the P2P comparison results are transferred to the client using MRNet’s data aggregation filter [41]. Each message processed by MRNet is either a hash signature or P2P result, which is attached with the relevant MPI process or thread group. Our previous work used a bitset to represent the process/thread set. Each bitset has a fixed size and maintains all processes/threads in the entire system (each local thread id is mapped to a global id). As messages are transferred along the MRNet communication tree, those with the same content merge their bitsets, as shown in Figure 5. MRNet Tree (fanout=64)
Bitset Merging 0" 0"
0" 1" 1" 0"
0" 0" 1" 0"
0"
0"
0" 0" 1" 0" 0"
0"
Topology-aware Range-set Concatenation 0"
0~63
64~127
0~127
0"
0~4095
MPI rank / thread id space
0"
0"
0"
63"
1"
1"
127" 64" 127"
1" 127" 127"
Figure 5. Range-set for scalable data aggregation. However, these two comparison methods have different data aggregation patterns. P2P results have only two possible outcomes: either same or different, which generate close-toperfect aggregation in most cases. In contrast, the hash signatures vary between the worst-case and best-case aggregation, depending on the application. A fixed-size bitset is not efficient for collecting
RangeSet Time / Bitset Time
results for large-scale data comparison, because it contains many unnecessary bits for both close-to-best and close-to-worst aggregations. Also, the merging overhead is significant. To address this issue, we implement range-set, which provides an adaptive solution for different aggregation scenarios and minimizes the aggregation overhead by taking advantage of the MRNet tree’s topology. A range-set consists of a series of ranges that are relevant to a single message. A range is denoted as 𝑟𝑎𝑛𝑔𝑒 = 𝑠𝑡𝑎𝑟𝑡, 𝑒𝑛𝑑 (𝑠𝑡𝑎𝑟𝑡 ≤ 𝑒𝑛𝑑), consisting of a set of contiguous MPI ranks or thread ids, which are relevant to an aggregated message, shown in Figure 5. In case start=end, only one process or thread is represented by a range. Each message is attached with a rangeset, instead of bitset. For perfect aggregation, all processes/threads in the entire space are represented using one range instead of one large bitset, all bits of which are ones. For the worst-case aggregation, each message is only attached 2 integers: start and end, instead of one large bitset, most bits of which are zeros. Merging ranges takes advantage of the tree’s topology. We utilize MRNet’s back-end attachment mode [8] to initialize a communication tree, which guarantees the MPI ranks are ordered sequentially across the leaf nodes. Therefore, the MPI rank / thread id space owned by any sub-tree on the same level has no intersection, as shown in Figure 5. When messages are transferred upstream, ranges from sibling communication nodes are concatenated in a sorted order. If two ranges are immediately adjacent to each other, they merge into one, shown in Figure 5. For the worst-case aggregation, no ranges are merged or concatenated. The best-case aggregation will generate one range at the root of the MRNet tree. We validated the overhead of range-set and bitset for both comparison methods on Crystal, the configuration of which is shown in Table 1, using up to 32,768 parallel processes. For the hashing method, each parallel process generated one signature and the identical degree of all signatures varies between 0%, which means all signatures are different, and 100%, which means all signatures are identical. For P2P, each process randomly created an outcome: true or false. Figure 6 illustrates the ratio of the result collection time using range-set vs. using bitset. After the number of comparison results is more than 2,048, range-set outperforms bitset significantly for both comparison scenarios. For P2P, rangeset consumes only 10% of the time used by bitset with 32,768 processes. For the hashing comparison method, range-set performs well as the identical degree varies. When less than 90% signatures are identical, collecting results using range-set is up to 10X more efficient than using bitset. 1.4
Hashing(100%) Hashing(90%) Hashing(50%) Hashing(10%) Hashing(0%) P2P
1.2 1 0.8 0.6 0.4
7. CASE STUDIES In this section, we demonstrate CCDB with two case studies using two supercomputers: Crystal and Titan [46], the configurations of which are listed in Table 1. First, we debug an implementation of the Shallow Water Equations (Shallow) when ported from sequential C to UPC. Using shallow, the performance of data comparison was evaluated on Crystal. This case study demonstrates the efficiency of constructing the global data view, the functionality of supporting comparison across different programming paradigms, and the efficiency of data comparison. Second, we locate errors in a large, real world, application (DELTA5D) using CCDB as it was ported from an MPI implementation to Titan with both MPI and OpenACC. The overhead of assertions was evaluated using DELTA5D on Titan with up to 5,120 GPUs. This case study demonstrates the efficiency of relative debugging on a large-scale hybrid supercomputer and its cross-model data comparison. • The Shallow Water Equations [13] abstracts a simple representation of the atmosphere, describing the motion of an incompressible fluid with a free surface. Both gravity waves and Rossby waves are covered. Shallow has been implemented in a range of languages for a variety of machines [19]. It is a simplified version of code found in weather prediction systems, such as WRF [32], but contains physics that is sufficiently real to demonstrate the debugging methodology used in CCDB. • DELTA5D [44] is a Monte Carlo particle simulation tool developed at Oak Ridge National Laboratory (ORNL). DELTA5D simulates a variety of stellarator transport phenomena by following groups of particles partitioned onto different processors in parallel. It solves four-coupled Hamiltonian guiding center equations for each particle, advancing them in both poloidal and toroidal angles in Boozer coordinates and the conjugate momenta. Table 1. Configuration of Titan and Crystal Config. Nodes#
0.2 0 1,024
CCDB client takes the following steps: 1) it collects servers’ socket information, such as hostname and port number, using MRNet; 2) the client swaps the information between two set of servers using MRNet broadcasting; 3) the client distributes two data decompositions, including the global data size and partition schemes, to all of the servers. Computing Equation (4) on the two decomposition schemes, each server identifies those BCBs that it contains. Combining the broadcasted socket information with its own BCBs, each server can detect its communication peers in the opposite server set. Finally, all of the socket connections required by P2P comparison are created in parallel. In comparison to our previous work, this enhancement saves more than 96% of the overhead to create socket connections for P2P. Specifically, creating 8,192 socket connections on Crystal takes less than 1 second, while creating 32,768 connections takes around 4 seconds. This overhead is amortized by subsequent comparisons.
2,048
4,096
8,192
16,384
The Number of Parallel Processes
32,768
Figure 6. Comparing overheads of range-set and bitset.
6.2.2 Creating Socket Connections for P2P P2P comparison requires point-to-point direct communication between debug servers attached to two separate programs. Our previous implementation wrote the information required to create socket connections to a Lustre file system. However, this method did not scale well and it took more than 22 seconds to create 8,192 socket connections on Crystal. To improve the performance,
Titan
18,688
Crystal
1,048
CPU GPU Memory 16-core AMD Interlagos NVIDIA Processor K20X GPUs ~ 700 TB Intel SB16, IV20, HW24, None ~ 140 TB HW32 Processors
7.1 Shallow Water Equations Shallow contains several key data structures such as p (i.e. pressure), u (i.e. zonal wind), v (i.e. meridional wind), and psi (i.e. velocity stream function) etc., each of which is a 2D array. In the ported UPC code, these data structures become global-shared arrays and their elements are accessed by parallel UPC threads.
Table 2. Outcomes Comparison of Shallow Water Equations Pot. Energy 30706.844 –nan
Kin. Energy Total Energy Pot. Enstrophy 46056.449 76763.297 3.367453e-16 –nan –nan –nan
Executing the ported UPC code with one thread produces results identical to the sequential version of Shallow. However, executing the same code with two or more threads generates incorrect output. After 150 cycles, various diagnostic quantities displayed by the diag function in the parallel execution were NANs, as illustrated in Table 2. To investigate the error, we compared the sequential execution with the parallel execution of two threads using assertions listed in Figure 7. #start the ported UPC code of Shallow Water Equations launch $a shallow launch $b{2} shallow #check initialization assert $a::psi@"sw.upc":69=$b::psi@"sw.upc":69 assert $a::u@"sw.upc":69=$b::u@"sw.upc":69 assert $a::v@"sw.upc":69=$b::v@"sw.upc":69 assert $a::p@"sw.upc":69=$b::p@"sw.upc":69 #because all energy values are wrong, check p assert $a::p@"sw.upc":88=$b::p@"sw.upc":88 # p is wrong, check its dependent variable dpdt assert $a::dpdt@"sw.upc":79=$b::dpdt@"sw.upc":79 # found difference in the first column of dpdt, so check cu, cv assert $a::cu@"sw.upc":78=$b::cu@"sw.upc":78 assert $a::cv@"sw.upc":78=$b::cv@"sw.upc":78
(1) (2) (3) (4)
(6) (7) (8)
The main function of Shallow and the dependency of investigated variables are illustrated in Figure 8. For the first time of re-execution, we executed assertions 1~5. Assertions 1~4 verify that the key data structures are initialized correctly, while assertion 5 validates if pressure (p) is computed correctly for each iteration. However, assertion 5 shows that p is incorrect after the first time step. On the second execution we added assertion 6 to verify p’s dependent variable dpdt. As expected, assertion 6 failed. On the third execution, we executed assertions 7 and 8 to examine variables cv and cu, both of which form dpdt. Assertions 7 and 8 passed, demonstrating that both cu and cv are correct. Using 3 re-executions and 8 assertions, we have narrowed down the suspect area to the function timetend. 1+
2+
main%func)on%
verified%variables%
3+
ini#alize(…)+
(1)~(4)+
psi,+u,+v,++p+
Suspect+area+
+for+(…)+{+//+loop+starts+ (7)~(8)+
calcuvzh+(…)++
diag+(…)+ tstep+(…)++
(5)+
cu,+++++++cv+
0metend+(…)++ (6)+
}+//loop+ends+
We measured the performance of assertions for both hashbased data comparison and P2P techniques when comparing two executions of the UPC version of Shallow on Crystal with an increasing number of parallel processes, as illustrated in Figure 9. During the experiments, Shallow computed 1,048,576 x N grids, in which N is the number of processes. Two debugging sessions of the UPC Shallow were launched with the same number of processes and an assertion was applied to compare the values of pressure (p) between them. Each assertion was performed twice, one with P2P and the other with hashing. The variable p contains 1M floating-points in each UPC process. With 32,768 processes, the total amount of data to be compared in one UPC program is 128GB. This is constructed as a weak-scaling experiment to examine the efficiency of data comparison techniques as the number of processes increases. 20
(5)
Figure 7. Assertions for UPC Shallow Water Equations.
Itera)on%of%Inspec)on%
7.1.1 Scalability of Data Comparison
dpdt+ p+
Figure 8. Debugging UPC Shallow Water Equations. Both cu and cv are global-shared arrays and they are computed (in function calcuvzh) before the time tendency function call (timetend). Interestingly, the values that mismatched changed in different runs, which suggested a synchronization failure. When the C code was translated into UPC, the programmer missed adding data dependencies between the function calls. To fix it, we placed one upc_barrier instruction after each function call (e.g. calcuvzh, timetend, and tstep). With this fix, the ported UPC code works correctly with two or more
Time (seconds)
Outcomes Sequential 2 Threads
threads. In addition, re-running CCDB again passed all the assertions.
15 10 Hashing−Total P2P−Total Hashing−Client (Model Construction+Comparison)
5 0 128
256
512
1,024
2,048
4,096
8,192
The Number of Parallel Processes
16,384
32,768
Figure 9. The scalability of data comparison. The time of executing a comparison was measured 3 times for each comparison method and the averaged values are presented. For the hash-based comparison, the latency measured includes: 1) retrieving the target data from GDB at servers, 2) applying a hash function to them, 3) transferring the hash signatures to the client, 4) reconstructing the received signatures with the global view, and 5) comparing them at client. With the P2P comparison, the examined time includes: 1) retrieving the target data at servers, 2) communicating the original data between servers and comparing them, and 3) collecting the compared results and mapping them into the global structure. The total time required by both hashing and P2P are almost flat as the number of processes increases from 128 to 32,768. The actual time for a debug server to hash the compared data or to perform P2P comparison is around 9 seconds. This is mostly the overhead for retrieving 1M floating-points using GDB/MI [24] and converting them to architecture independent format (AIF) [17]. Compared to the server time, the overhead at client and collecting comparison results using MRNet can almost be ignored. For hashing, the client consumes less than 0.1 seconds, which was mainly for constructing the generic data model and comparing signatures, as illustrated in Figure 9. The time consumed by hashing is almost double that of the P2P technique. This is because handling two program’s data at servers were performed sequentially for hashing. In contrast, using P2P, data in the two UPC programs were processed in parallel. To conclude, both methods produce reasonable execution times for comparing 256GB data (128GB per program) with 65,536 processes (32,768 processes per program). To the best of our knowledge, no other tools support validating global structures at such a scale.
7.2 DELTA5D The MPI implementation of DELTA5D has 10 Fortran source files, each of which contains several modules. After it was hybridized using OpenACC on Titan, the module heating_orbits, as illustrated in Figure 11, produced incorrect results.
Table 3. Outcomes Comparison of DELTA5D Key variable MPI/OpenACC MPI
num_left_Total
E_sum_Total 0.1596255E+02 0.1560372E+02
1951 1950
CCDB can be used to perform comparisons before entering an OpenACC compute region, which guarantees that the GPU memory has been initialized correctly, and after a compute region completes, to examine if the code that has been offloaded generates correct results. Below, we illustrate how we refined the area of suspect code in heating_orbits, which is in the Fortran source file energetic_mp.f. #start the MPI and hybrid MPI/OpenACC code of DELTA5D launch $a{5120} delta5d_res_acc --gpu --aprun-args="-N1" launch $b{5120} delta5d_res_mpi assert $a::E_sum_at_itime@"energetic_mp.f":1416 = $b::E_sum_at_itime@"energetic_mp.f":1416 assert $a::numleft_at_itime@"energetic_mp.f":1464 = $b::numleft_at_itime@"energetic_mp.f":1464 assert $a::index@"energetic_mp.f":1405 = $b::index@"energetic_mp.f":1405 assert $a::index@"energetic_mp.f":1349 = $b::index@"energetic_mp.f":1349 assert $a::iloss@"energetic_mp.f":1405 = $b::iloss@"energetic_mp.f":1405
(1) (2) (3) (4) (5)
Figure 10. Assertions for debugging DELTA5D. With the simulation of 5,120x10,240 particles running on 5,120 GPU nodes, after 1,000 time steps, heating_orbits module displayed incorrect results at the end of the module, as illustrated in Table 3. To investigate the error, we compared the incorrect execution to the original MPI execution launched with the same number of parallel processes. We executed assert commands listed in Figure 10, without using blockmap, because the data partition across both versions of DELTA5D is identical. The dependency of variables we investigated is shown in Figure 11. The heating_orbits module calculates the energetic particles lost on the outer surface of simulated orbits. Specifically, num_left_Total records the total number of lost particles across all MPI processes using a reduction operation applied to num_left, which is a local variable to keep the number of lost particles in each process. Similarly, E_sum_Total keeps the total energy for all of the lost particles, which is a collection of E_sum. We executed assert commands 1 and 2 to examine the values of num_left_at_itime and E_sum_at_itime, which respectively keep the local number of lost particles and energy for each time step. Both comparisons failed. Therefore, the errors are introduced before executing the MPI reduction operations. Itera$on.of.Inspec$on. hea$ng_orbits.
1,602(lines(
Variable.dependency.
3(
38(lines(
2( 1,405(lines(
1(
iloss&
compute®ion(1(
index& compute®ion(2(
E_sum_at_i6me& num_le1_at_i6me&
compute®ion(3( E_sum&
num_le1&
MPI(reduc4on( display(output(
E_sum_Total(((&num_le1_Total&
Figure 11. Debugging the heating_orbits module Each of E_sum_at_itime and num_left_at_itime contains the reduction result of an array within offloaded compute region 2 and 3 respectively, as shown in Figure 11. Both reductions rely on index, an integer array. We examined the value of index using
assertion 3 at the beginning of compute region 2. It confirmed that the value of index diverged after compute region 1. To examine whether compute region 1 creates any errors, we compared the values of index using assertion 4 before entering the region. It concluded that compute region 1 is incorrect. We realized that compute region 1 has race condition when updating iloss, which determined the branch of execution in that region and caused updating index incorrectly. This was confirmed using assert command 5 after compute region 1 completes. To locate the source of the race condition bug with this case study, we conducted 5 assertions with 3 iterations of inspection. Accordingly, the suspect area of heating_orbits codes was narrowed from 1,602 lines down to just 38 lines. Without using CCDB, we are unaware any other tool can provide a better solution. A recently proposed OpenACC debugging tool [49] allows comparing an OpenACC program with its sequential version at the granularity of a GPU kernel. The comparison is enabled through an enhanced compiler with adding extra source code directives and environment variables. However, this tool does not help DELTA5D case study because it cannot handle hybrid MPI/OpenACC programs. In comparison to this tool, using CCDB requires neither changes in the source code under debug and nor enhancements in compilers and runtime environments.
7.2.1 Overhead of Assertions We evaluated the overhead of performing an assertion across both MPI and hybrid DELTA5D on Titan. Two assertions were applied to two array variables respectively: phi_loss and num_left. The details of these two variables are listed in Table 4. They were compared rank-by-rank without using blockmap, because both versions of DELTA5D have the same number of processes with identical data partition. The amount of data maintained by these two variables is comparatively small. Therefore, executing the assert command to them reflects the overhead of performing an assertion instead of the cost of processing a large amount of data. Table 4. Compared variables Variable
Residence MPI
Hybrid
phi_loss
CPU
GPU
num_left
CPU
CPU
Comment An array of 10,240 integers uniformly partitioned across the processes. An array of 1,000 integers per process.
An assertion is executed using a dataflow graph composed by several debugging commands, including set breakpoint, continue, and compare, as illustrated in Figure 14. Normally, the time of executing a declarative assertion is dominated by waiting to catch the specified breakpoint, which depends on specific applications. Therefore, to evaluate the overhead of assertions, we measured the time consumed by each debugging commands, the total of which represents the overhead of executing an assertion. The latency for each command was measured 3 times and the averaged assertion time is illustrated in Figure 12. For hybrid DELTA5D, each Titan node was assigned one OpenACC process. For the MPI version, each MPI process used one CPU core and each Titan node was assigned to hold up to 16 MPI processes. During the experiment, each version of DELTA5D launched up to 5,120 parallel processes. The time of executing an assertion for both variables is between 0.05~0.11 seconds during the number of processes increases from 10 to 5,120. As illustrated in Figure 12, the latency of comparing a small amount of data for both variables increases slightly with the number of processes. However, it is sensitive to the back-end resource competition, which caused variations and even jitters around 80 processes. CCDB places the debug servers and MRNet communication processes on the same set of CPU cores allocated
for the MPI application. Therefore, the execution of MPI processes compete with CCDB at the back-end, which delays transferring the response messages for the continue command. Num_left is an array only residing on the CPU, the size of which in each process is fixed. Phi_loss was validated while residing on a GPU in the hybrid DELTA5D. It is a fixed size global data structure uniformly partitioned across all of the processes. Comparing phi_loss took less time than num_left on average for two reasons: 1) the size of phi_loss is smaller and 2) the latency of phi_loss’s continue command is lower because the execution of the OpenACC process on the GPU has less resource competition with the CCDB server on the CPU. 0.11 Assertion on phi_loss Assertion on num_left
Time (second)
0.1 0.09 0.08 0.07 0.06 0.05 0.04
10
20
40
80
160
320
640
The Number of Parallel Processes
1,280
2,560
5,120
Figure 12. The overhead of assertions.
8. RELATED WORK Many parallel debuggers do not provide an efficient way to verify the global state for a distributed stencil computation. Using TotalView [7] and Allinea DDT [5] to debug OpenMP and OpenACC programs, a user needs to select the thread, process and kernel of interest before exploring any suspect sub-structure. Although UPC provides the global address space to programmers, most UPC debugging tools, such as DDT [5], GDB-UPC [27] and Berkeley UPC [19], only support regular debugging tasks in a distributed view. Similarly, TotalView [7] can display UPC shared objects with both the thread ID and the pointer to the data segments that belong to that particular thread, while UPC-trace [56] can generate trace files and local memory reports. Verifying the global state to guarantee the correctness of parallel and distributed programs has been studied by several research projects. WiDS [1] and D3S [58] allow programmers to verify the correctness of distributed protocols by specifying predicates that are checked at runtime. When any mistake is detected, D3S can reproduce the state changes that lead to the bug, allowing the developer to investigate the root cause quickly. However, these two technologies cannot validate the large amount of numerical results produced by scientific computing at run time. TASS (the Toolkit for Accurate Scientific Software) [47] allows programmers to specify a collective assertion that is verified using symbolic execution and explicit state-enumeration techniques instead of realistic environment. Its effectiveness was demonstrated with limited scalability using 16 MPI processes. Model checking [21] has been applied to examine the nondeterminism problem in parallel computing. For instance, MPISpin [48] verifies the correctness of MPI protocol and UPC-SPIN [1] examines the inter-thread synchronization for UPC programs. However, model-checking methods are restricted by limited scalability and have limited support for realistic runtime environments. SESA [42] provides symbolic race checking for CUDA programs. Message checker [29] can automatically detect errors that occur with incorrect message passing. These verification tools are specific to guarantee the correctness of one programming technique and are not designed for applications with mixed multiple programming paradigms. In comparison to these methods, CCDB verifies the runtime state for hybrid programs
from a global point of view by taking advantage of the correctness of the same program’s different version. STAT (Stack Trace Analysis Tool) [20] compares the stack traces of identical parallel processes to detect errors. To assist MRNet’s data aggregation, STAT implements a hierarchical bitvector [25]. In contrast, CCDB has different aggregation requirement from STAT, which aims to improve the efficiency of aggregating identical content. CCDB’s range-set is adaptive for handling different aggregation patterns. Additionally, aggregation overhead is minimized by taking advantage of the tree topology Since relative debugging [14] was proposed, comparisonbased methods have been available in a number of parallel debuggers. However, p2d2 [45] and Wizard [23] only allow comparing a serial code with a parallel code. TotalView [7] provides limited comparison between two programs of the same scale with the identical data partition schemes. Our previous work, Guard [26][35], investigated validating the global state of MPI programs [35] and UPC programs [36] respectively, but could not handle any hybrid applications and data comparison across different types of applications. In this paper relative debugging has been extended significantly to facilitate data comparison across different programming techniques, such as UPC, hybrid MPI/OpenACC, and MPI/OpenMP programs, on hybrid machines. Specifically, we propose a generic data model that can reconstruct the global state for any stencil computations with halo cells and facilitate validating the numerical results across different levels of parallelism. In addition, the CCDB server can access data shared across OpenMP threads in a consistent manner using GDB multithreaded debugging. It also allows the declarative assertion to access the data in OpenACC processes regardless whether the variable is residing on the GPU memory or the CPU memory. With these significant enhancements, relative debugging is effective at finding errors when stencil codes are ported on hybrid supercomputers using these widely used programming methods. We also demonstrate the efficiency of two advanced data comparison schemes, which allows CCDB to detect bugs that only occur with a large-scale execution.
9. CONCLUSION AND FUTURE WORK High-end hybrid supercomputers pose a number of challenges for debugging applications. In order to improve the productivity of porting large-scale scientific applications to current high-end hybrid supercomputers, we have developed CCDB to provide a relative debugging strategy for stencil computation. In particular, CCDB helps users to verify the global state of stencil computations between a reference version and a suspect code across different types of applications, including MPI, hybrid MPI/OpenACC, MPI/OpenMP, and UPC programs. Two case studies were investigated to illustrate the effectiveness of using CCDB to detect real-world bugs and investigate their causes accordingly. A synchronization bug was fixed using CCDB during porting a sequential C code of the Shallow Water Equations to a UPC version; and hybridizing DELTA5D on Titan located a race condition bug within a compute region offloaded to the GPU using CCDB. Specifically, the bug in DELTA5D was investigated with an execution of more than 5,120 GPUs. The overhead and efficiency of CCDB’s data comparison methods have been examined on Titan and Crystal using large-scale real world applications. These case studies and experiments show that CCDB is scalable, incurs low overhead, and allows one to efficiently verify the global state for porting a large-scale stencil computation on hybrid supercomputers.
Presently, CCDB supports stencil computations with regular data partitions. In the future, we will improve it to construct the global view for irregular data partitions such as adaptive mesh refinement. The iterative process of refining a faulty area requires re-executing the application. Complementing CCDB with checkpointing techniques will make each re-execution to start from a verified state instead of the very beginning and accordingly decrease the time of each re-execution. CCDB will also be improved to handle the Intel Phi architecture. To improve the performance of the CCDB server, we will optimize the efficiency of fetching data from GDB and converting them into AIF.
10. ACKNOWLEDGMENTS This project is funded by the Australian Research Council under the Linkage grant scheme, and is supported by Cray Inc. This research used resources of the Oak Ridge Leadership Computing Facility at the Oak Ridge National Laboratory, which is supported by the Office of Science of the U.S. Department of Energy under Contract No. DE-AC05-00OR22725.
Appendix A. CCDB Architecture The CCDB architecture consists of one front-end client process running on the head-node, and multiple servers running on the compute nodes at the back-end, illustrated in Figure 13. CCDB has been implemented on Cray XE, XK, and XC supercomputers [10][11][12]. However, the design of CCDB is general and supports other type of supercomputers or hybrid clusters with minor extensions. Candidate$ApplicaAons:$ Pure$MPI$
MPI/OpenMP$
MPI/OpenACC$
UPC$
Suspect$
Reference$
Dataflow$graph$
P2P$Comparison$
Hash4based$Comparison$ Hash$Signatures$
MRNet$ CCDB$Server$
CUDA8GDB$ Compute$Node$
GPU$
CCDB$Server$
CUDA8GDB$ Compute$Node$
CPU$
CCDB allows a programmer to compare relevant data structures between two programs using two methods: 1) the compare command, and 2) the declarative assertion. The compare command fetches the values for both variables to be compared and display their difference to users. A user can place breakpoints, control the execution of both reference code and suspect code using commands like continue and step/next, and detect the difference in the relevant data structures with the compare command. An assertion automates the process of detecting divergences. A declarative assertion is executed using a data-flow graph, as illustrated in Figure 14, in which common tasks such as setting breakpoints, controlling process sets, and performing comparisons are managed automatically and conducted using a data-flow engine [26]. Multiple assertions can be grouped into one data-flow graph. A generic grammar for constructing assertions and blockmap is described in [9]. assert/R($ref::large)@trusted.c:65/=$S($sus::super)@ported.c:68/ $ref$
$sus$
breakpoint$ /
breakpoint$ /
con.nue$
con.nue$ catch/breakpoint/
read_var$ $$$
read_var$ $$$
Blockmap$ (R)/
Blockmap$ (S)/
Figure 14. The data-flow graph of a declarative assertion.
ComparaAve$asserAon$
$ref$
B. CCDB Interface
compare$
CCDB$Client$
Compare$cmd$
Using the Architecture Independent Format (AIF) [17], CCDB backend servers convert the native runtime data to a “normalized” format before conducting comparisons. To support hybrid machines and languages, AIF has been extended to maintain C, C++, UPC, Fortran, and OpenACC data types.
CCDB$Server$
GDB$ Compute$Node$
Ghost$Cells$
BCB$
$sus$
CCDB$Server$
GDB$ Compute$Node$
Hash$Signature$
Figure 13. The architecture of CCDB.
At the front-end, the CCDB client exposes a relative debugging interface that launches parallel applications onto the back-end, controls the execution of the programs remotely, and assists a programmer to compare relevant data structures across different types of applications. At the back-end, the CCDB server has a pluggable architecture that loads and deploys an appropriate debug controller according to the target application. For example, GDB [24] is used to control C, C++, Fortran, OpenMP, and UPC programs, while CUDA-GDB [38] is used to handle OpenACC. CCDB uses a MRNet communication tree [41] to connect the front-end client and a large number of back-end servers.
It is straightforward to compare two local variables. However, to compare a set of distributed data, blockmap is required to reconstruct the global view. For data that is decomposed using MPI, programmers can specify its blockmap function in the compare command or assertion. For a variable in a UPC program, programmers do not need to specify a blockmap. The default data comparison scheme fetches the original data for each variable and compares them at the CCDB client. However, this works only for small amounts of data. For comparing larger amounts of data, a user can select either hashing or P2P scheme to use. To compare floating-point numbers, users can set a tolerance threshold that allows CCDB to round them. This treats two floating-point values with slight differences as the same. Hashing is lightweight method to detect data divergence, while P2P incurs extra network traffic at backend servers.
C. CCDB Debugging Methodology A typical relative debugging cycle involves monitoring and comparing the key variables in the reference and suspect codes, and tracing them back to their points of definition to refine the suspect area. Using CCDB to locate errors normally consists of two stages. In the first stage, assertions are used to narrow a large suspect region down to a manageable area. After that, in the second stage, the compare command is adopted to interactively refine the faulty area. In a real debugging session, these two stages may be mixed with each other. The initial pass through of relative debugging includes the following steps: 1. Locate entry point into code: a user locates which data structure(s) need to be compared, and where to perform the
comparisons. The source code location (including source file and line number) should be identified in assertions. The initial location in which data deviations are first produced is typically from program output. 2. Define data decomposition schema: a user can specify how a key data structure is decomposed using a blockmap function when it is necessary. 3. Prepare and invoke executables: both the reference and suspect codes are executed using the launch command. 4. Run programs and observe data divergence: this step can be performed either with the compare command or assertions. Any data divergence found can be used to narrow down the scope of the error and the process iterates from step one until the error is located. Typically, diagnosing an error requires iterative inspection of a suspect variable’s dependent variables until the initial cause is found. Users add new assertions or compare commands iteratively to refine a suspect code region. Using a divide and conquer strategy, each iteration of inspection decreases the suspect area around 50%.
REFERENCES [1]
A. Ebnenasir, “UPC-SPIN: A Framework for the Model Checking of UPC Programs” the Fifth Conference on Partitioned Global Address Space Programming Models, Galveston Island, Texas, USA, 2011.
[2] A. Nakano, R.K. Kalia, K. i Nomura, A. Sharma, P. Vashishta, F. Shimojo, et al., “A Divide-andConquer/Cellular-Decomposition Framework for Million-toBillion Atom Simulations of Chemical Reactions”, Computational Materials Science, vol. 38, pp. 642-652, 2007.
[13] D. A. Randall, “The Shallow Water Equations”, Department of Atmospheric Science, Colorado State University, Fort Collins 2006. Retrieved from http://kiwi.atmos.colostate.edu/group/dave/pdf/ShallowWate r.pdf [14] D. Abramson, I. Foster, J. Michalakes, and R. Sosic, “Relative Debugging and its Application to the Development of Large Numerical Models”, in Proceedings of IEEE SuperComputing, 1995. [15] D. Abramson, I. Foster, J. Michalakes, and R. Sosic, “Relative Debugging - A New Methodology for Debugging Scientific Applications”, Comm. the ACM, vol. 39, pp. 6977, 1996. [16] D. Abramson, M. N. Dinh, D. Kurniawan, B. Moench, and L. DeRose, “Data Centric Highly Parallel Debugging”, in Proceedings of ACM International Symposium on High Performance Distributed Computing (HPDC) Chicago, Illinois, 2010, pp. 119-129. [17] D. Abramson, R. Sosic, and G. Watson, “Implementation Techniques for a Parallel Relative Debugger”, in Proceedings of Intl. Conference on Parallel Architectures and Compilation Techniques (PACT), USA, 1996. [18] D. Abramson, M. Dix, and P. Whiting, “A Study of the Shallow Water Equations on Various Parallel Architectures”, in Proceedings of 14th Australian Computer Science Conference, Sydney, 1991, pp. 1-12. [19] D. B. W. Chen, J. Duell, P. Husbands, C. Iancu, K. Yelick, “A Performance Analysis of the Berkeley UPC Compiler”, in Proceedings of the International Conference on Supercomputing (ICS), San Francisico, CA, USA, 2003.
[3] A. Nguyen, N. Satish, J. Chhugani, C. Kim, and P. Dubey, “3.5-D Blocking Optimization for Stencil Computations on Modern CPUs and GPUs”, in Proceeding of the Intl. Conf. on High Performance Computing (SC 2011), 2011.
[20] D.C. Arnold, D.H. Ahn, B.R. de Supinski, G.L. Lee, B.P. Miller, M.Schulz, “Stack Trace Analysis for Large Scale Debugging”, Proc. of 20th IEEE Intl. Parallel and Distributed Processing Symposium (IPDPS), 2007.
[4] A. Petitet, Block Cyclic Data Distribution, http://www.netlib.org/ utk/papers/scalapack/node8.html, 1995.
[21] E. Clarke, O. Grumberg and D. Long, “Verification tools for finite-state concurrent systems”, A Decade of Concurrency Reflections and Perspectives. Lecture Notes in Computer Science, 803, 1994.
[5] Allinea, Allinea DDT – A revolution in debugging, 2009. [6] C. Coarf, Y. Dotsenko, J. Mellor-Crummey, and et al. “An Evaluation of Global Address Space Languages: Co-Array Fortran and Unified Parallel C”, in Proceedings of the 10th ACM SIGPLAN symposium on Principles and practice of parallel programming, Illinois, USA, 2005, pp. 36-47. [7] C. Gottbrath, “Automation Assisted Debugging on the Cray with TotalView”, in Proceedings of Cray User Group, 2011. [8] C. Jin, D. Abramson, M. N. Dinh, A. Gontarek, B. Moench, and L. DeRose, “A Scalable Parallel Debugging Library with Pluggable Communication Protocols”, in Proceedings of 12th IEEE/ACM International Symposium on Cluster, Cloud, and Grid Computing (CCGrid), Ottawa, 2012. [9] Cray, Using the lgdb Comparative Debugging Feature. Cray Whitepaper. [10] Cray XC Systems, http://www.cray.com/Products/Computing/XC/ [11] Cray XE Systems, http://www.cray.com/Products/Computing/XE.aspx [12] Cray XK7 System, http://www.cray.com/Products/Computing/XK7.aspx
[22] F. B. Kjolstad and M. Snir, “Ghost Cell Pattern”, in Proceedings of the 2nd Annual Workshop on Parallel Programming Patterns (ParaPLoP'10), Arizona, 2010. [23] F. Manne and S. O. Andersen, “Automating the Debugging of Large Numerical Codes”, in Modern software tools for scientific computing, ed Cambridge, MA, USA: Birkhauser Boston Inc, 1997, pp. 339-352. [24] Free Software Foundation Inc. (2008, 15/01/2009). GDB: The GNU Project Debugger. Available: http://www.gnu.org/software/gdb/ [25] G. L. Lee, D. H. Ahn, D. C. Arnold, B. R. de Supinski, M. Legendre, B. P. Miller, M. Schulz, and B. Liblit, “Lessons Learned at 208K: Towards Debugging Millions of Cores”, Supercomputing 2008 (SC2008), Austin, TX, 2008. [26] G. R. Watson, “The Design and Implementation of a Parallel Relative Debugger”, Doctor of Philosophy Dotoral, Faculty of Information Technology, Monash University, Melbourne, 2000. [27] GNU UPC, Debugging with GDB UPC, http://www.gccupc.org/gdb-upc/debugging-with-gdb-upc
[28] H. Richardson, “High Performance Fortran: history, overview and current developments”, Thinking Machines Corporation 1996. [29] J. DeSouza, B. Kuhn, B. R. de Supinski, V. Samofalov, S. Zheltov, and S. Bratanov, “Automated, scalable debugging of MPI programs with Intel Message Checker”, in Proceedings of the 2nd international workshop on Software engineering for high performance computing system applications (SE-HPCS '05), 2005. [30] J.H. Chen, A. Choudhary, B. de Supinski, and et al., “Terascale direct numerical simulations of turbulent combustion using S3D”, Comput. Sci. Disc., vol. 2, 2009, p. 15001. [31] J. M. Levesque, R. Sankaran and R. Grout, “Hybridizing S3D into an exascale application using OpenACC: an approach for moving to multi-petaflops and beyond”, in Proceeding of the Intl. Conf. on High Performance Computing, Networking, Storage and Analysis (SC 2012).
International Conference for High Performance Computing, Networking, Storage and Analysis, 2014. [43] R. Jauregui and F. Silva, “Numerical Validation Methods”, Chapter 8 in Numerical Analysis - Theory and Application, ISBN 978-953-307-389-7, 2011. [44] R.H. Fowler, J.A. Rome, J.F. Lyon, Phys. Fluids 28, 338 (1985). [45] R. Hood and G. Jost, “Support for Debugging Automatically Parallelized Programs”, in Proceedings of 4th International Workshop of Automated Debugging, Munich, 2000. [46] A. Schäfer and D. Fey, “High Performance Stencil Code Algorithms for GPGPUs”, in Proceedings of the International Conference on Computational Science (ICCS 2011), 2011. [47] Stephen F. Siegel and Timothy K. Zirkel, “Collective assertions”, in Proceedings of the 12th International conference on Verification, model checking, and abstract interpretation (VMCAI'11), 2011.
[32] J. Michalakes, J. Hacker, R. Loft, M.O. McCracken, A. Snavely, and N.-l.J. Wright, “WRF Nature Run”, in Proceedings of High Performance Networking and Computing, 2007.
[48] Stephen F. Siegel, “Verifying Parallel Programs with MPISpin”, Recent Advances in Parallel Virtual Machine and Message Passing Interface, Lecture Notes in Computer Science Volume 4757, 2007, pp 13-14.
[33] K. Datta, M. Murphy, V. Volkov, S. Williams, J. Carter, L. Oliker, D. Patterson, J. Shalf, and K. Yelick, “Stencil Computation Optimization and Auto-tuning on State-of-theArt Multicore Architectures”, in Proceeding of the Intl. Conference on High Performance Computing, Networking, Storage and Analysis (SC 2008), 2008.
[49] S. Lee, D. Li, J. S. Vetter, “Interactive Program Debugging and Optimization for Directive-Based, Efficient GPU Computing”, in Proceedings of 28th IEEE International Parallel & Distributed Processing Symposium (IPDPS), Phoenix, 2014.
[34] M. N. Dinh, D. Abramson, D. Kurniawan, C. Jin, B. Moench, and L. DeRose, “Assertion based parallel debugging”, in Proceedings of 11th IEEE/ACM International Symposium on Cluster, Cloud, and Grid Computing (CCGrid), Newport Beach, California, 2011, pp. 63-72. [35] M. N. Dinh, D. Abramson, C. Jin, “Scalable Relative Debugging”, IEEE Transactions on Parallel and Distributed Systems (TPDS), Pages 740-749, Vol. 25 Issue 3, 2014. [36] M. N. Dinh, D. Abramson, C. Jin, L. DeRose, B. Moench, and A. Gontarek, “Supporting relative debugging for largescale UPC programs”, Proceedings of the 14th Annual International Conference on Computational Science (ICCS 2014), Pages 740-749, March 2014. [37] NASA Advanced Supercomputing Division, NAS Parallel Bench- marks, http://www.nas.nasa.gov/Resources/Software/npb.html, 2009. [38] NVIDIA Corporation. (2013, 10/03/2013). CUDA-GDB. Available: https://developer.nvidia.com/cuda-gdb [39] NVIDIA, CUDA, https://developer.nvidia.com/cuda-zone. [40] OpenMP Application Program Interface, Version 4.0, July 2013, http://openmp.org [41] P. C. Roth, D. C. Arnold, and B. P. Miller, “MRNet: A Software-Based, Multicast/Reduction Network for Scalable Tools”, in Proceeding of the Intl. Conf. on High Performance Computing (SC 2003), Phoenix, Arizona, November 2003. [42] P. Li, G. Li, and G. Gopalakrishnan, “Practical Symbolic Race Checking of GPU Programs”, in Proceedings of SC14:
[50] S. Lee, J. S. Vetter, “Early evaluation of directive-based GPU programming models for productive exascale computing”, in Proceeding of the Intl. Conference on High Performance Computing, Networking, Storage and Analysis (SC 2012), Utah, 2012. [51] T. Shimokawabe, Takayuki Aoki, and N. Onodera,“Highproductivity framework on GPU-rich supercomputers for operational weather prediction code ASUCA”, in Proceeding of the Intl. Conference on High Performance Computing, Networking, Storage and Analysis (SC 2014), 2014. [52] The Message Passing Interface (MPI) standard, http://www.mcs.anl.gov/research/projects/mpi/ [53] The OpenACC™ Application Programming Interface, Version 2.0, Jun. 2013, http://www.openacc-standard.org/ [54] Titan, http://www.olcf.ornl.gov/titan/ [55] Unified Parallel C, http://upc.gwu.edu/ [56] UPC Trace, Manual Reference Pages - UPC_TRACE, http://upc.lbl.gov/docs/user/upc_trace.html. [57] W. W. Carlson, J. M. Draper, D. E. Culler, K. and et al., Introduction to UPC and Language Specification, Center for Computing Sciences, Bowie, MD1999. [58] X. Liu, Z. Guo, X. Wang X, et al. D3S: debugging deployed distributed systems, in Proceedings of the 5th USENIX Symposium on Networked Systems Design and Implementation (NSDI’08), 2008. [59] X. Liu, W, Lin, A. Pan, et al. WiDS checker: combating bugs in distributed systems, in Proceedings of the 4th USENIX Symposium on Networked Systems Design and Implementation (NSDI’07), 2007.