JOURNAL OF MAGNETIC RESONANCE IMAGING 11:228 –231 (2000)
Technical Note
Resampling as a Cluster Validation Technique in fMRI R. Baumgartner, PhD, R. Somorjai, PhD,* R. Summers, MSc, W. Richter, PhD, L. Ryner, PhD, and M. Jarmasz, PhD Exploratory, data-driven analysis approaches such as cluster analysis, principal component analysis, independent component analysis, or neural network-based techniques are complementary to hypothesis-led methods. They may be considered as hypothesis generating methods. The representative time courses they produce may be viewed as alternative hypotheses to the null hypothesis, ie, “no activation.” We present here a resampling technique to validate the results of exploratory fuzzy clustering analysis. In this case an alternative hypothesis is represented by a cluster centroid. For both simulated and in vivo functional magnetic resonance imaging data, we show that by permutation-based resampling, statistical significance may be computed for each voxel belonging to a cluster of interest without parametric distributional assumptions. J. Magn. Reson. Imaging 2000;11:228 –231. © 2000 Wiley-Liss, Inc. Index terms: exploratory fuzzy clustering; resampling; fMRI
HARD AND FUZZY clustering analysis (HCA and FCA) (1– 6), principal component analysis (PCA) (7), independent component analysis (ICA) (8), and Kohonen maps (KM) (9,10) are data driven (exploratory) methods that were found useful in analyzing functional (f)MR images of the human brain. These techniques partition the fMRI data and yield representative time courses (TCs) with corresponding activation maps. Exploratory approaches may be viewed as hypothesis-generating procedures (11), in which the representative TC of a group of pixels may be considered as an alternative hypothesis to the null hypothesis, ie, no activation. Given such an alternative model, the question of statistical validation of the results arises. Such validation may be performed by resampling-based techniques (as also noted in refs. 8 and 5). Resampling techniques have been used in human brain mapping in positron emission tomography (PET; 12) and fMRI (13) in the context of hypothesis-led analysis. Recently, Griswold et al (14) used resampling for validation of the results from PCA. Here we investigate a permutation-based resampling technique to validate
Institute for Biodiagnostics, National Research Council Canada, Winnipeg, Manitoba, Canada, R3B 1Y6. *Address reprint requests to: R.S., Institute for Biodiagnostics, National Research Council of Canada, 435 Ellice Avenue, Winnipeg, Manitoba, R3B 1Y6 Canada. E-mail:
[email protected] Received July 15, 1999; Accepted October 13, 1999.
© 2000 Wiley-Liss, Inc.
the results of data-driven FCA in fMRI. The importance of using such a technique is that no parametric assumptions need to be made about the TCs’ distributional properties. The permutation based techniques are performed in several steps (15): a) a null hypothesis and an alternative are defined; b) a test statistic is chosen; c) the test statistic for the original labelling of the observations is computed; d) the labels are permuted (resampled), the test statistic is recomputed for the resampled labels—this process is repeated a prescribed number of times, and thus a distribution of the test statistic is generated; e) the statistical significance of the observed value of the test statistic is calculated, and the null hypothesis is accepted or rejected. In the technique presented here, the null vs. alternative corresponds to “no activation” vs. “activation.” The alternative hypothesis is represented by the relevant cluster centroid obtained from FCA. Pearson’s correlation coefficient between the cluster centroid and each TC belonging to the “activation” cluster was chosen as the test statistic. The distribution of the correlation coefficient was calculated by permuting the time point labels of the cluster centroid. The statistical significance determined from the generated distribution permits acceptance or refusal of the null hypothesis at a specified level of significance. MATERIALS AND METHODS Simulated fMRI Data The resampling method was first tested on simulated fMRI time series (16,17), for which in vivo data acquired under the null condition were combined with simulated activation. In vivo data were acquired on a GE 1.5 T Signa scanner with a variety of scanner and noise contributions (16) and with three different TRs (of 3500, 2500, and 1250 msec). The focal activated region was selected in the motor cortex, and a hemodynamic response was simulated as the combination of two gamma functions (18), with varying contrast-to-noise ratios (CNR ⫽ ⌬ S/noise, CNR ⫽ 1–10). In Vivo fMRI Data With Real Activation Paradigm Five fMRI data sets, from a time-resolved mental rotation study (D1) and from visual (M3, T1, T2) and motor
228
Resampling as a Cluster Validation Technique
229
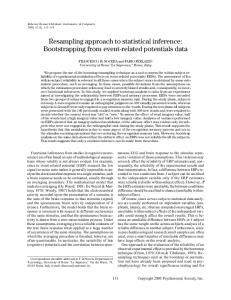
Figure 1. a: The membership map extracted by FCA overlaid on the T2* anatomy (visual stimulation, 20 slices, Nact ⫽ 315, four representative slices, which include the visual cortex, shown). b: The corresponding centroid considered as an alternative hypothesis for the cluster validation resampling technique. The arrows indicate the activated pixels TCs.
(M1, M2) activation, were analyzed with FCA, and the cluster identified as corresponding to the activation was validated by our resampling technique. Data Analysis Exploratory FCA, using EvIdent 5.00 (19), was carried out in two steps: 1. Preprocessing: To prevent clustering predominantly on noise, “noise” pixels were excluded by a new preselection method based on voxel TC selfsimilarity (19,20); (P ⫽ 0.01). Preselection also temporarily excludes voxel TCs that have a statistically significant (P ⫽ 0.01) trend. 2. FCA: FCA was performed on the remaining TCs. Representative TCs (cluster centroids) and activation maps were obtained. As FCA has already been described in detail elsewhere (21,22), we give in the Appendix only a short summary of the method. Confirmatory Stage (Cluster Validation): Resampling The cluster of interest was validated by a permutationbased resampling technique (15). For each TC belonging to a cluster: 1. The Pearson correlation coefficient (ccorig) between the cluster centroid and the actual TC was calculated. 2. The cluster centroid’s time-point labels were randomly permuted (Nperm ⫽ 10,000), and the correlation coefficient of the permuted centroid (ccperm) with the TC in question was computed. 3. For each TC in a cluster, the P value was computed as P ⫽ (Npass ⫹ 1)/Nperm,where Npass denotes the number of times that ccperm ⱖ ccorig.
4. A Bonferroni-corrected P value was calculated as PBONF ⫽ Nact P, where Nact is the number of activated voxels belonging to the cluster. RESULTS Simulated Data In simulated fMRI data, FCA reliably recognized the simulated “activation” region for CNR ⬎ 3 (20). The resampling procedure consistently yielded very low P values (P ⬍ 0.05, after Bonferroni correction for multiple comparison) for the “activation” cluster TCs for CNR ⬎ 3, and for all TR values. In Vivo Data A typical example of FCA obtained from visual stimulation is shown in Fig. 1 (data set T1). In Fig. 1a activation maps with the cluster centroid extracted (Fig. 1b) are displayed. FCA consistently identified the paradigm in all five in vivo data sets we have investigated. The individual error rates (P values) were very low, such that even the conservative Bonferroni correction yielded P values ⬍ 0.05. The results of exploratory FCA in the in vivo data are summarized in Table 1. We have also tested the “activation” cluster centroid against TCs belonging to a different cluster. None of the TCs from this different cluster correlated with the activation cluster centroid significantly (all corrected P values ⬎ 0.15.) DISCUSSION We used a permutation-based resampling technique to validate the results of exploratory fuzzy cluster analysis. The method has been tested both on simulated data
230
Baumgartner et al.
Table 1 In Vivo fMRI Data - Summary. The Results of the Exploratory FCA with the Data Description are Shown. Data set (no. of slices/no. of time points) D1 (4/88) M1 (5/50) M2 (8/50) M3 (1/35) T1 (20/140)
Sequence
Acquisition parameters (TR/TE/MA)
No. of activated voxels (Nact)
EPI EPI EPI FLASH EPI
480/15/64 3000/50/128 4000/43/128 60/42/128 4500/20/64
715 209 86 61 315
and on in vivo fMRI data with real paradigms. Thus, given an alternative hypothesis, represented by a temporal shape (cluster centroid), such a resampling technique may be used with confidence. Furthermore, a nonparametric statistical significance [P value, as used in human brain mapping (12,13)] may be assigned to each TC belonging to a particular cluster of interest. The statistical significance calculated may be a useful measure for comparing different types of (data- or hypothesis-driven) analysis methods used in fMRI (23). It should be kept in mind that the accuracy (resolution) of the P value obtainable is 1/Nperm. The method presented here combines exploratory and confirmatory statistical methods and may be used in fMRI trials in which very limited (or no) a priori knowledge about the hemodynamic response is available, eg, in clinical trials, investigation of epileptic seizures, sleep studies, identification of transient responses in fMRI (8), application of complicated cognitive paradigms, or time-resolved studies. Exploratory methods such as HCA, FCA, ICA, KM, etc. ought to be particularly useful in investigation of functional connectivity, ie, the co-activation of different brain regions (24). A similar technique to that presented here was suggested by Griswold et al (14), using PCs from PCA, to attribute scores to the observed TCs. It is important to note that any temporal shape of interest may be correlated against a particular TC. PCA is difficult to use in the presence of several sources of variance (signal sources), because it cannot in general meaningfully decompose the data. [The PCs obtained are orthogonal and difficult to interpret (8, 16)]. ICA relaxes this constraint, and the use of resampling for validating ICs is under investigation. The permutation-based technique as used in this contribution can be viewed as single cluster validation. The main drawback of resampling techniques is that they are very computationally intensive. Here, validation of the largest cluster (715 TCs) took several hours. However, computational efficiency was not a primary concern at this stage, and the resampling was implemented in Matlab, purely to show the feasibility of the approach. Much more efficient coding (eg, in C⫹⫹) will be implemented. We are currently also exploring the problem of statistically assessing between-cluster differences (15).
ACKNOWLEDGMENTS We thank colleagues who provided us with the data sets analyzed: Prof. E. Moser for sets M1, M2, and M3 and Prof. K. Thulborn for set T1.
REFERENCES 1. Scarth G, McIntyre M, Wowk B, Somorjai R. Detection of novelty in fMRI using fuzzy clustering (abstract). In: Proceedings of the ISMRM, Nice, France, 1995. p 238. 2. Jarmasz M, Somorjai R. Time to join! Cluster-merging in unsupervised fuzzy clustering of fMRI data (abstract). In: Proceedings of the ISMRM, Sydney, Australia, 1998. p 2068. 3. Baumgartner R, Windischberger C, Moser E. Quantification in fMRI: fuzzy clustering vs correlation analysis. Magn Reson Imaging 1998;16:115–125. 4. Golay X, Kollias S, Stoll G, Meier D, Valavanis A, Boesinger P. A new correlation based fuzzy logic clustering algorithm for fMRI. Magn Reson Med 1998;40:249 –260. 5. Goutte H, Toft P, Rostrup E, Nielsen F, Hansen L. On clustering fMRI time series. Neuroimage, 1999;9:298 –310. 6. Baune A, Sommer F, Erb M, et al. Dynamical cluster analysis of cortical fMRI activation. Neuroimage 1999;9:477– 489. 7. Friston K, Frith C, Liddle P, Frackowiak R. Functional connectivity: the principal component analysis of large (PET) data sets. J Cereb Blood Flow Metab 1993;13:5–14. 8. McKeown M, Makeig S, Brown G, et al. Analysis of fMRI data by blind separation into independent spatial components. Hum Brain Map 1998;6:160 –188. 9. Fischer H, Hennig J. Neural network based analysis of MR time series. Magn Reson Med 1999;41:124 –131. 10. Ngan S, Hu X. Analysis of fMRI data using self-organizing mapping with spatial connectivity. Magn Reson Med 1999;41:939 – 946. 11. Ford I. Some nonontological and functionally unconnected ways on current issues in the analysis of PET datasets. J Cereb Blood Flow Metab 1995; 5:371–378. 12. Holmes A, Blair R, Watson J, Ford I. Nonparametric analysis of statistic images from functional mapping experiments. J Cereb Blood Flow Metab 1996;16:7–22. 13. Bullmore E, Brammer M, Williams S, et al. Statistical methods of estimation and inference for fMRI analysis. Magn Reson Med 1996; 35:261–277. 14. Griswold M, Edelman R, Bly B. fMRI data reduction and significance testing without a-priori information (abstract). In: Proceedings of the ISMRM, Philadelphia, PA, 1999. p 1707. 15. Good P. Permutation tests. A practical guide to resampling methods for testing hypotheses. Springer Series in Statistics. New York: Springer; 1993. 16. Baumgartner R, Ryner L, Summers R, Jarmasz M, Somorjai R. Comparison of two exploratory data analysis methods for fMRI: fuzzy clustering vs. principal component analysis. Magn Reson Imaging 1999 (in press). 17. Baumgartner R, Ryner L, Summers R, Jarmasz M, Somorjai R. Simple resampling technique for cluster validation in fMRI. Neuroimage (Suppl) 1999;9:49. 18. Lange N, Zeger S. Non-linear Fourier time series analysis for human brain mapping by fMRI. Appl Statist 1997;46:1–29. 19. Somorjai R, Jarmasz M. Exploratory data analysis of fMRI images— philosophy, strategies, tools, and implementation. Neuroimage (Suppl) 1999;9:45. http://www.ibd.nrc.ca/informatics/evident. html 20. Somorjai R, Jarmasz M, Baumgartner R, Richter W. Exploratory analysis of fMRI images by fuzzy clustering: voxel preselection via “self-similarity.” Neuroimage (Suppl) 1999;9:46. 21. Bezdek J. Pattern recognition with fuzzy objective function algorithms. New York: Plenum Press; 1981. 22. Gordon H, Somorjai R. Fuzzy cluster analysis of molecular dynamic trajectories. Proteins 1992;14:249 –264. 23. Lange N, Strother S, Anderson J, et al. Plurality and resemblance in fMRI data analysis. Neuroimage 1999;9:282–303.
Resampling as a Cluster Validation Technique 24. Carpenter P, Just M. Modeling the mind: very high field functional magnetic resonance imaging activation during cognition. Top Magn Reson Imaging 1999;10:16 –36.
APPENDIX: FUZZY CLUSTERING ANALYSIS In fuzzy clustering the TCs are considered as points in T-dimensional space, where T is the number of time instances. Let X be the observed data set with n TCs. The TCs are to be assigned to one of the C cluster centers (representative TCs), which are represented by a matrix V(C,T). Furthermore, the C-partition X is represented by the matrix U(C,n). The members of U(C,n), uik are the membership values of the k-th pixel to the ith C
centroid 共 ¥ uik ⫽ 1, i⫽1
0 ⱕ uik ⬍ n兲.The matrices U and
V are determined by an enhanced version of the fuzzy C
231
means algorithm proposed by Bezdek (21), which minimizes the functional Jn ⫽
n
C
m 2 ¥ ¥ uik dik ,where dik is
k ⫽ 1i ⫽ 1
some distance measure of the k-th data point from the ith cluster centroid Jn is minimized by a two-stage Picard iteration, vi n
n
k⫽1
k⫽1
m m ⫽ ¥ uik xkjⲐ ¥ uik ,
C
uik ⫽ 1/ ¥ 共dikⲐdjk兲2Ⲑ共m ⫺ 1兲, and m ⬎ 1 i⫽1
is a parameter that controls the fuzziness of the clusters (we used m ⫽ 1.1). The iterations stop when the algorithm satisfies predetermined convergence criteria. In EvIdent the initial number of clusters is first set to be relatively large (typically 35). The final number of clusters is then determined by a data-driven, novel cluster merging algorithm (2).