ABSTRACT/Predictive models of wildlife-habitat relation- ships often have been developed without being tested The apparent classification accuracy of such ...
Resampling Methods for Evaluating Classification Accuracy of Wildlife Habitat Models DAVID L. VERBYLA* JOHN ,6.. LITVAITIS Department of Forest Resources University of New Hampshire Durham, NH 03824, USA
ABSTRACT/Predictive models of wildlife-habitat relationships often have been developed without being tested The apparent classification accuracy of such models can be op-
The increased involvement of wildlife biologists in habitat inventory, impact assessment, and land-use planning has generated a need for accurate models of wildlife-habitat relationships (Berry 1986). As a result, several modeling techniques have been developed, including the US Fish and Wildlife Service's habitat suitability index models (Fish and Wildlife Service 1981) and more rigorous statistical models (Capen 1981). During the development of a statistical model, a biologist measures many variables that are potentially important to the target species and then applies some procedure (e.g., discriminant analysis or logistic regression) to build a model that predicts the presence or absence of the target species. This method of model construction has been widely applied by wildlife biologists (Verner and others 1986). However, the problems of misleading statistical models also have been recognized (Verbyla 1986, Rexstad and others 1988). For example, if many predictor variables are measured and utilized in the model, spurious sample relationships may occur, especially if the sample size is small (e.g., Magnusson 1983, Verbyla 1986). Because of this, multivariate statistical models may predict well when applied to the data that were used in developing the model, but predict poorly if they are tested with an independent data set. This does not mean that wildlife biologists should abandon multivariate statistics. However, these models should be used cautiously and tested thoroughly. The most rigorous test of a statistical model is to KEY WORDS: Bootstrap; Cross-validation; Discriminant analysis; Habitat modeling; Resampling methods
*Author to whom correspondence should be addressed.
Environmental Management Vol 13, No 6, pp 783-787
timistically biased and misleading. Data rasampling methods exist that yield a more realistic estimate of model classification accuracy These methods are simple and require no new sample data. We illustrate these methods (cross-validation. jackknife resampling, and bootstrap resampling) with computer simulation to demonstrate the increase in precision of the estimate. The bootstrap method is then applied to field data as a technique for model comparison We recommend that biologists use some resampling procedure to evaluate wildlife habitat models prior to field evaluation.
apply an independent data set to the model (field validation). For example, a biologist may sample in two study areas or spend the first field season collecting data to construct the model (training set) and a second field season collecting similar data in another location to test the model (validation set). However, such a validation is sometimes not practical because of cost or time constraints. A complement to field validation is to use a procedure that resamples the data set used to develop the model. Because these resampling procedures require no new data, they are relatively inexpensive and a biologist can use these techniques to assess a model's accuracy (under model conditions) and then decide if the model is worthy of field validation. In some instances, a resampling procedure may be the only practical method available to evaluate a model, such as in exploring species-habitat relationships during unusual climate conditions. The objectives of this article are to: (1) describe several resampling methods that can be applied to habitat models, (2) use a computer simulation to illustrate how these methods can be used to evaluate classification accuracy, and (3) demonstrate the application of these methods to field data. Resampling Methods
Suppose a wildlife biologist wants to predict the presence or absence of a rare species from habitat measurements. Access to areas where the species occurs is difficult, and therefore only 30 sample sites are established within the study area. Ten habitat variables are measured at each site (e.g., canopy closure and understory density). The species is found on 15 of the 30 sites. Using all habitat measurements, the biologist develops a linear discriminant model that correctly
9 1989 Springer-Verlag New York Inc
784
D.L. Verbyla and J. A. Litvaitis
classifies the presence or absence of the species at 25 of the 30 sample sites (83% classification accuracy). Is the model useful? A resampling procedure can help answer this question. Such procedures are summarized below.
Resubstitution The resubstitution method is simply testing the model's predictive ability by using the sample cases that were used to develop the model. In the above example, resubstitution was used to estimate the classification accuracy of the model (83%) by comparing actual group membership to predicted group membership. However, resubstitution produces an optimistically biased estimate of the model's true classification accuracy, especially if many predictor variables are used in relation to sample cases (Verbyla 1986, Williams and Titus 1988).
Cross-validation An alternative to resubstitution is to randomly partition sample cases into two subsamples, using one subsample to develop the model and the other subsample to estimate dassification accuracy (Lachenbruch and Mickey 1968). The subsamples may be of equal size or the training subsample may contain a larger portion of the original data set (e.g., 75%, Capen and others 1986). Because the second subsample is not used in developing the model, it can provide a nearly unbiased estimate of classification accuracy. However, there are two problems with this approach. First, because the model is developed with only a portion of the original sample, model degrees of freedom are sacrificed. This may result in less reliable estimates of model coefficients and a decrease in statistical significance (Morrison 1984). Second, the estimate of model classification accuracy will not be very precise (have a large variance) because only one estimate of accuracy is made.
2. Develop the model with the remaining subsamples. 3. Estimate the classification accuracy of the model by testing the model with the vth-exduded subsample cases.
4. Return the excluded subsample, increment v by 1, and repeat the procedure. Steps 1 - 4 are repeated until all subsarnples have been excluded and used to estimate model dassification accuracy. The estimate of model accuracy is the mean of estimates obtained from step 3. Because the estimate of classification accuracy is based upon ten estimates rather than just one, tenfold validation produces a more precise estimate of classification accuracy than cross validation.
Jackknife Resampling A more precise estimate of classification accuracy than those described above can be computed by the jackknife procedure (also known as N-fold cross-validation) introduced by Tukey (1958). Using this procedure, the original sample is partitioned into N subsamples (where N = the number of sample cases in the original data sample), and computed as follows: I. Exclude the first sample case from the development of the model. 2. Develop the model with the remaining sample cases,
3. Test the model with the excluded sample case. The test result will be 0 or 100% correct classification. 4. Return the excluded sample case to the original sample, and repeat the process by excluding the next sample from the development of the model. The estimate of classification accuracy is then computed as the mean of estimates from step 3. The precision of this estimate will be greater than the estimate calculated by the tenfold procedure. Also, because only one case is excluded from model development, the number of degrees of freedom is one less than the original sample.
Bootstrap Resampling Ten-fold Validation The problems of unreliable model coefficients, decreased statistical significance, and low precision of a classification accuracy estimate resulting from sacriricing sample cases for validation are less severe with a 10-fold cross-validation. Using this procedure, the original data set is randomly partitioned into ten nearly equal-sized subsamples. Then the following is done: 1. Exclude the vth subsample for model validation, initially v = 1.
The jackknife procedure is resampling without replacement (no sample case is repeated in any subsample). The randomized bootstrap is resampling with replacement (Efron 1983, Jain and others 1987, Krebs 1989). It produces the most precise estimate of classification accuracy, but also requires the most computer processing time. The randomized bootstrap procedure is as follows: 1. Randomly sample with replacement N cases from the original sample (where N = the number of sample cases in the original data set). Sampling with
Classification Accuracy of Habitat Models
replacement indicates that a sample case may be used once, twice, several times, or not at all in the bootstrap sample. Develop the model with the random sample. 2. Test the model with all original sample cases that were not used for model development. 3. Repeat steps 1 and 2 a large number of times (e.g. 200-1000). Classification accuracy of the model is then estimated as the weighted mean of the estimates from step 2.
785
0.06
00S-
//~
0 04-
Z 0
0 03-
0.02
-
C o m p u t e r Simulation
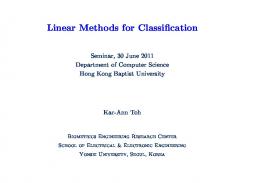
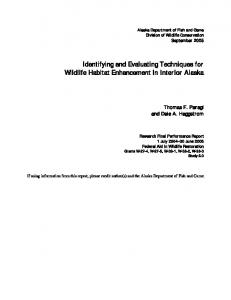
We performed a computer simulation to illustrate the described resampling methods. Our example uses a model developed with discriminant function analysis; however, these resampling methods can be applied to almost any statistical predictive model (e.g., multiple linear regression, classification tree analysis, etc.). Thirty sample cases with ten predictor variables were generated with univariate normal distributions and equal variances (assumptions of linear discriminant analysis). Species presence or absence was randomly assigned to each sample case. A linear discriminant model was then developed using the 30 sample cases. Because the presence or absence of the target species was assigned randomly, the expected classification accuracy of the model was 50% (no better than flipping a coin). The simulation was repeated 1000 times. In reality the biologist does this once. The resubstitution method consistently produced biased estimates of the model's accuracy (Figure 1). The other methods produced nearly unbiased estimates of model classification accuracy (Figure 2). The randomized bootstrap procedure produced the most precise estimate of classification accuracy. This is not unexpected because this technique resarnples the data set with replacement; therefore, .these samples frequently will contain less variation than the samples obtained by other resampling procedures.
001-
StO 6~ 0
~176176,b 2'o 3'o 4'o
7o 8'o r ,do
PERCENTOF CASESCORRECTLYCLASSIFIED
Figure 1. Smoothed frequency distribution (N = 1000) of resubstitution method of estimating model classification accuracy.
0 06"
0 05" WF~ C~s-Vd~ 0 04 -
TenFm C~O.-Vs~n
2: O 03"
2
0 02-
o o,-
g
,,~
o,oo, ,~ 2;~ ~ ,~ 5~ 6b 7~ a'o ,~ ,d0 PERCENT OF CASES CORRECTLY CLASSIFIED
Figure 2. Smoothed frequency distribution (N = 1000) of tenfold cross-validation,jackknife resampling, and bootstrap resampling estimates of model classification accuracy.
Application to Field Data We next demonstrate the application of the bootstrap technique to the development of a model describing snowshoe hare (Lepus americanus) habitat. A detailed description of the data used in this example is provided by Litvaitis and others (1985). Briefly, hares were captured on a 7 x 7 grid with traps spaced at 100-m intervals. At each trap site, 17 habitat variables were sampled within a 15-m radius or derived by an aggregation of sampled variables. These variables described the topographic slope and aspect, overstory,
understory, ground vegetation, lateral foliage density, and the relative abundance of forage at each site. During a 11-day period, 54 captures of hares were recorded at 28 of the 49 trap sites. We then used these data to predict the presence or absence of snowshoe hares based upon habitat characteristics. During model development, we intentionally did not apply any data screening procedures (e.g., examination of correlation among variables) and disregarded the sug-
786
D.L. Verbyla and J. A. Litvaitis
gestions of Williams and Titus (1988) on the ratio of variables to sample size. As a result, this demonstration may be considered a "worst-case scenerio." Stepwise linear discriminant analysis was used to construct two models of hare habitat. In the first modal, the F value to enter a predictor variables was set at 1.0 (default option). The resultant model (model A) was composed of nine predictor variables and correctly classified 88% of the sample cases. In the second model, we applied a more conservative approach and set the probability of the F statistic to enter at ~0.05. The model (model B) was composed of two variables and correcdy dassified 76% of the sample cases. Model A seemed to be more accurate; however, this may have been a result of overfitdng the model with too many predictor variables. We then conducted bootstrap resampling of both models. The resampling classification accurracy of both models was similar (model A: 69%, model B: 72%). Based on these results, only model B should be considered for field validation (if 70% classification accuracy is acceptable). If the two models were validated instead of first applying some resampling procedure, much time and effort would be wasted making the additional field measurements for the nine-variable model. The bootstrap resampling technique can be easily programmed (Appendix 1). This resampling technique can be applied to any Statistical predictive model [e.g., logistic regression (Efron 1986), multiple linear regression (Picard and Cook 1984), classification tree analysis (Breiman and others 1984), etc.]. However, these techniques do not eliminate the need for sound experimental design while collecting and analyzing field data, or field validation of the model using an independent data set.
Acknowledgments We thankJ. P. Barrett, J. A. Bissonette, A. L. Foote, J. Kadlec, M. Keller, M.L. Morrison, R.A. Riggs, H. C. Romesburg, D. L. Stauffer, J. T. Taylor, and K. Titus for helpful comments on early drafts of this manuscript. This is scientific contribution No. 1614 of the New Hampshire Agricultural Experiment Station.
Literature Cited Breiman, L., J. H. Friedman, R. A. Olshen, and C.J. Stone. 1984. Classificationand regression trees. Wadsworth, Inc. Belmont, California. 358 pp. Berry, K. H. 1986. Introduction: development, testing, and application of wildlife-habitat models. Pages 3-4 /n J. Verner, M. L Morrison, and C.J. Ralph (eds.), Wildlife
2000: Modeling habitat relationships of terrestrial vertebrates. University of WisconsinPress, Madison, Wisconsin. Capen, D. E. (eel.). 1981. The use of multivariate statistics in studies of wildlifehabitat. US Forest Service General Technical Report RM-87. Rocky Mountain Experiment Station, Fort Collins, Colorado. 249 pp. Capen, D.E., J.w. Fenwick, D.B. Inldey, and A.C. Boymon. 1986. Pages 171-175 inJ. Verner, M. L. Morrison, C.J. Ralph (eds.), Wildlife 2000: Modeling habitat relationships of terrestrial vertebrates. University of Wisconsin Press, Madison, Wisconsin. Efron, B. 1983. Estimating the error rate of a prediction rule: Improvement on crosswalidation.Journal of the American Stat/st/cd Assoc/at/gn78:316-331. Efron, B. 1986. How biased is the apparent error rate of a prediction rule? Journa/of the American StatisticalAssociation 81:461-470. Fish and Wildlife Service 1981. Standards for the development of suitability index models. Ecological Services Manual 103. US Fish and WildlifeService, Divisionof Ecological Services, Washington, DC. 68 pp. Jain, A.K., R.C. Dubes, and C.C. Chen. 1987. Bootstrap techniques for error estimation. IEEE Transactions of Pattern Ana/ys/s9:628-633. Krebs, C.J. 1989. Ecological methodology. Harper & Row, New York. 654 pp. Lachenbroch, P. A., and M. R. Mickey, 1968. Estimation of error rates in discriminant analysis.Technometrics10:1-11. Litvaitis, J. A., J. A. Sherbume, and J. A. Bissonette. 1985. Influence of understory characteristics on snowshoe hare habitat use and density. Journal of Wildlife Management 49:866-873. Magnusson, W.E. 1983. Use of discriminant function to characterize ruffed grouse drumming sites in Georgia: A critique.Journal of Wildlife Management47:1151-1152. Morrison, M.L. 1984. Influence of sample size on discriminant function analysis of habitat use by birds. Journal of Field Ornithology 55:330-335. Picard, R. P., and R. D. Cook. 1984. Cross-validationof regression models.Journal of the American StatisticalAssociation 79:575-583. Rexstad, E. A., D. D. Miller, C. H. Flather, E. M. Anderson, J. W. Hupp, and D. R. Anderson. 1988. Questionable multivariate statisticalinference in wildlifehabitat and community studies.Journal of Wildlife Management 52:794-798. Tukey, J. 1958. Bias and confidence in not quite large samples. Annal~ of Mathematical Science29:614. Verbyla, D.L. 1986. Potential prediction bias in regression and discriminant analysis. CanadianJournal of Forest Research 16:1255-1257. Verner, J., M.L. Morrison, and C.J. Ralph (eds.). 1986. Wildlife 2000: Modeling habitat relationships of terrestrial vertebrates. University of Wisconsin Press, Madison, Wisconsin. 470 pp. Williams,B. K., and IL Titus. 1988. Assessment of sampling stability in ecologicalapplications of discriminant analysis. Ecology 69:1275-1285.
Appendix FORTRAN subroutine for bootstrap resampling. Subroutines DEVELOP and CLASSIFY must be supplied by the user and depend on the statistical classifier being used. Comments: *Subroutine for bootstrap validation Dave Verbyta 603-862-3498 *Matrices defined: * ORIGINAL--Matrix of original sample cases * DEVELOP--Matrix of randomly selected cases for model development * VALIDATE--Matrix of cases not used for model development c234567 SUBROUTINE BOOTSTRAP IMPLICIT NONE INTEGER NSAMPLE,NVARS,NBOOT PARAMETER(NSAMPLE = 49,NVARS = 10,NBOOT = 200) COMMON/ARRAYS/ORIGINAL,DEVELOP,VALIDATE,COEFF,ESTIMATE, & N_ESTIMATE,PICKED INTEGER TRIAL, CASE,I,ISEED,COL,NCASES REAL ORIGINAL(NSAMPLE,NVARS),DEVELOP(NSAMPLE,NVARS), & VALIDATE(NSAMPLE, NVARS),COUNT,CORRECT,ESTIMATE(NBOOT) & N - - ESTIMATE(N Boo'r),COEFF(NVARS),CLASS LOGICAL PICKED(NSAMPLE) ....... Initialize seed for random number generator.*..................... ISEED = SECNDS(0 0) * 10000 ....... Start bootstap trials...................................... DO TRIAL = 1 ,NBOOT C----Initialize array of cases picked for model development: 1 DO CASE= 1,NSAMPLE PICKED(CASE) = FALSE END DO C . . . . . Randomly select cases from original sample for model development DO CASE = 1,NSAMPLE I=RAN(ISEED) * NSAMPLE + ltRandom number 1 to NSAMPLE DO COL = 1 ,NVARS DEVELOP(CASE,COL) = ORIGINAL(I,COL) END DO PICKED(I)= TRUE !The ith case is recorded as being picked for model development END DO C. . . . . Develop the model on the selected cases CALL DEVELOP(COEFF,DEVELOP,NSAMPLE,NVARS) C . . . . Validate the model on cases not used for model development COUNT=O DO CASE = 1 ,NSAMPLE IF(PICKED(CASE EQ FALSE )THEN ! Case was not picked for model development COUNT=COUNT + 1 DO COL= 1,NVARS VALIDATE(COUNT,COL) = ORIGINAL(CASE,COL) END DO END IF END DO IF(COUNT EQ O)GOTO 1 IAII cases were selected for model development, none for validation CALL CLASSIFY(COEFF,DEVELOP,COU NT, NVARS,CORRECT) ESTIMATE(TRIAL) = CORRECT N_ESTIMATE(TRIAL) = COUNT END DO ! End of bootstrap trials C . . . . . -Compute estimate of classification accuracy as weighted mean of estimates CORRECT = 0 0 NCASES = 0 0 DO I= 1,NBOOT CORRECT=CORRECT + ESTIMATE(I) NCASES=NCASES + N_ESTIMATE(I) END DO CLASS=CORRECT/NCASES * 100 0 WRITE (.,.)c Bootstrap estimate of model classification accuracy = ', CLASS RETURN END