www.nature.com/scientificreports
OPEN
Received: 10 April 2017 Accepted: 14 August 2017 Published: xx xx xxxx
Revealing the mystery of metabolic adaptations using a genome scale model of Leishmania infantum Abhishek Subramanian1,2 & Ram Rup Sarkar1,2 Human macrophage phagolysosome and sandfly midgut provide antagonistic ecological niches for Leishmania parasites to survive and proliferate. Parasites optimize their metabolism to utilize the available inadequate resources by adapting to those environments. Lately, a number of metabolomics studies have revived the interest to understand metabolic strategies utilized by the Leishmania parasite for optimal survival within its hosts. For the first time, we propose a reconstructed genome-scale metabolic model for Leishmania infantum JPCM5, the analyses of which not only captures observations reported by metabolomics studies in other Leishmania species but also divulges novel features of the L. infantum metabolome. Our results indicate that Leishmania metabolism is organized in such a way that the parasite can select appropriate alternatives to compensate for limited external substrates. A dynamic non-essential amino acid motif exists within the network that promotes a restricted redistribution of resources to yield required essential metabolites. Further, subcellular compartments regulate this metabolic re-routing by reinforcing the physiological coupling of specific reactions. This unique metabolic organization is robust against accidental errors and provides a wide array of choices for the parasite to achieve optimal survival. Leishmaniasis is a complex, widespread neglected tropical disease in humans caused by Leishmania protozoan parasites, spread through infected female sandfly bites. There are around 1 million cases reported for cutaneous leishmaniasis in the last 5 years and between 200,000 to 400,000 infected cases reported annually for the deadlier clinical manifestation, visceral leishmaniasis1. The long-standing association with hosts has equipped the parasite with unique metabolic features that support their existence within the hosts2. Mechanisms of metabolic adaptation of the Leishmania parasite to a variety of external metabolite sources and their stage-specific utilization has been a recurring question3, 4. Recent13C-isotope-labelled tracing studies in L. mexicana indicate that glucose and amino acids, like aspartate, alanine, proline and glutamate, are catabolized through common metabolic routes employed by both the promastigote and amastigote stages of the parasite and propose stage-specific flux changes of pathways that are hard-wired to the differentiation signals within the parasite5, 6. The common metabolic routes specify the use of a core set of enzymes within L. mexicana metabolism that can metabolize different sources in both stages. The knowledge of these core metabolic routes and enzymes is still incomplete in other Leishmania species. Furthermore, the causal reasons for the choice of specific metabolites and their metabolic routes to satisfy the cellular demand of the parasite are still debated upon. One of the speculated reasons is that the differentiation of promastigote to amastigote brings about a lower uptake of non-essential amino acids, higher fatty acid uptake and hypoxic environment in amastigote metabolism as compared to the promastigote stages, that constrains the choice of metabolic routes5, 6; although the intrinsic adaptation of the metabolic network structure to the environment is less discussed. Also, the metabolic enzyme repertoire across developmental stages in Leishmania (DNA microarrays in L. major and mass-spectrometry based quantitative proteomics in L. infantum) has been speculated to be constitutively expressed7, 8, raising the question of how the flux changes between metabolic states for the two stages might be achieved. This is also supported by the observations from whole genome comparisons of codon usage among different species of Leishmania, which outline very few differences within metabolic genes between the species9. All the above observations motivated us to investigate the role of the underlying metabolic network structure in metabolic adaptation of L. infantum to the host environment.
1
Chemical Engineering and Process Development, CSIR-National Chemical Laboratory, Pune, Maharashtra, India. Academy of Scientific & Innovative Research (AcSIR), CSIR-NCL Campus, Pune, India. Correspondence and requests for materials should be addressed to R.R.S. (email:
[email protected])
2
SCIENtIfIC REPOrtS | 7: 10262 | DOI:10.1038/s41598-017-10743-x
1
www.nature.com/scientificreports/ Genome-scale metabolic models of eukaryotic parasites provide a comprehensive overview of metabolic pathways and attempt to understand the stage-specific nature of parasite metabolism10–13. No genome-scale metabolic reconstruction is available for Leishmania infantum till date. For the first time, we propose a new manually reconstructed genome-scale metabolic network model (iAS556) for the species Leishmania infantum JPCM5 (a well characterized L. infantum strain), consisting of 1260 reactions and 1160 metabolites (see Supplementary Data S1, S2, Methods, and Sections 1, 2 of Supplementary Information). We hypothesize that the underlying reaction stoichiometry and reversibility present within the L. infantum metabolic network are adequate to explain these specific route selections, which remain conserved across developmental stages; although, the corresponding flux changes are strong-armed by constraints on uptake of environmental metabolites. Auxiliary to the hypothesis, analyses of the proposed L. infantum genome-scale constraint-based model reveals the simplicity of metabolome organization within Leishmania and its utility to achieve complex metabolic phenotype traits for optimal usage/ synthesis of essential metabolites under varying environments. Related to this, the factors that govern metabolome organization and their effects on distribution of metabolites are also unknown. Our results suggest that the coupling of specific reactions for reasons of mass, redox and energy balance, driven by subcellular compartmentalization of enzymes might be the most vital component for appropriate distribution of metabolites within the network. This organization ensures unaltered production of biomass metabolites despite random changes occurring within the parasite metabolome.
Results
Formulation of Leishmania-specific metabolic demand reaction. A Leishmania-specific metabolic
demand reaction was formulated using relative signal intensities per cell protein of metabolites normalized to the sum intensity of the total metabolite pool reported for log phase L. donovani promastigotes averaged for 3–6 days of in vitro growth14. In this experiment14, an untargeted metabolomics approach was used to obtain detailed information of the metabolite changes occurring within different developmental stages of promastigote under defined media conditions. Further, promastigotes were collected from days 3 to 6 of in vitro growth representing the whole procyclic to metacyclic transition of the parasite and was analyzed using liquid chromatography-mass spectrometry (LC-MS). Results from this study were applied to represent the total metabolite pool within the parasite for the given time span of growth. The signal intensity per cell protein of each metabolite averaged for 3–6 days was normalized to total metabolite signal intensity per cell protein (eq. 1). The normalized intensities thus, represents the probable fraction of each metabolite available in the total metabolite pool (expressed as total metabolite signal intensity per cell protein) that can be used for generating unit biomass in the given growth phase. Available fraction of metabolite Signal intensity per cell protein of metabolite in promastigote(averaged for 3−6 days) = Total metabolite signal intensity per cell protein
(1)
This available fraction represents the coefficient of that metabolite in the metabolic demand reaction (see Section 3, Supplementary Information for details). Previous genome-scale reconstruction studies in other parasites have used biochemical data from distant organisms for creation of the metabolic demand11, 12. As the metabolic demand reaction of L. infantum could not be completely established based on available literature, and L. donovani being evolutionary related to L. infantum9, as a proof of concept, the formulated metabolic demand reaction can be applied to L. infantum. Similar usage of metabolomics data for formulation of objective function was also considered in the L. infantum energy metabolic network15, which gave comparable results with experiments. Similarly, the results in this study indicate that the formulated metabolic demand reaction can capture the essential, realistic distribution of fluxes within the iAS556 metabolic network. Furthermore, a recent study16 demonstrates that, between the L. infantum and L. donovani species, the ratio of membrane phospholipids known to be produced by the parasite (considered within the metabolic demand reaction) [Phosphatidylcholine (PC): Phosphatidylethanolamine (PE): Phosphatidylinositol (PI)] remains similar across the two species in both stages; supporting the use of the metabolic demand reaction curated from L. donovani data in simulating the phenotypes of L. infantum.
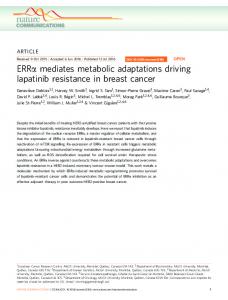
Prediction of stage-specific metabolic routes for catabolism of major carbon sources. Previous studies characterize a low uptake of non-essential amino acids, fatty acid uptake to compensate for the scarcity of glucose, reduced secretion of overflow metabolites, a hypoxic and acidic environment as factors governing the metabolic state within the infective amastigote stage of the parasite5, 17. Also, the possible strategic routes to utilize a variety of carbon sources within the two stages, were also demonstrated5. Given these boundary (exchange) constraints (Section 4 of Supplementary Information), we asked the question whether the present constraint-based model demonstrates similar metabolic routes in the L. infantum network or not. Re-creating the above-mentioned scenarios, the fate of different carbon resources between promastigote and amastigote metabolic states was predicted (see Methods) and compared (Fig. 1A, Supplementary Table S1). The predicted reaction steady state fluxes represent the stoichiometrically adjusted percentage conversion of a given substrate (fate) into a subsequent product. For example, glucose is entirely converted to glucose-6-phosphate (same stoichiometry). Hence, flux of glucokinase is equal to flux through glucose uptake and represents a 100% conversion of total input glucose into glucose-6-phosphate. With sufficient availability (promastigote), glucose was largely driven towards optimal production of overflow metabolites (2.34%), adenosine monophosphate (AMP) formation (2.34%), phospholipids (20.2%), glutamate (23.7%), aspartate (23.7%), alanine (23.7%) and mannan (3.9%); further, characterized by NAD redox coupling occurring between glycolysis and succinate fermentation, entry of pyruvate, succinate and glutamate into the tricarboxylic acid cycle (TCA), and regeneration of NAD reducing SCIENtIfIC REPOrtS | 7: 10262 | DOI:10.1038/s41598-017-10743-x
2
www.nature.com/scientificreports/
Figure 1. Fate of environmental metabolites within the L. infantum iAS556 metabolic network. (A) Metabolic utilization of carbon sources in developmental stages of Leishmania infantum – Each color in the heatmap indicates the percentage utilization of a given input metabolite (X-axis) for formation of a given internal metabolite when optimized for the metabolic demand reaction. The metabolic demand reaction represents a drain (overall net conversion) of precursor metabolites at their relative stoichiometry. In this case, the chosen metabolites represent the metabolites that form biomass. It is also important to note that only metabolites produced by the parasite are included within the metabolic demand reaction. (B) Comparison between promastigote and amastigote stages as given in the metabolomics experiment, where 13C isotope enrichment of each metabolite was expressed in mole percentage & normalized to glucose-6-phosphate for parasites grown on 13C labeled glucose5 and reaction fluxes (normalized to hexokinase/glucose uptake) as predicted for the glucose-only situation from the model. Blue colored bars indicate the promastigote metabolic state and red colored indicate the amastigote state. The metabolites in the X-axis and the order in which they are arranged, were taken from the aforementioned 13C isotope enrichment experiment performed in L. mexicana5. The details of comparisons of flux-profiles between experiment and predicted in both the stages is given in Section 5, Supplementary Information.
SCIENtIfIC REPOrtS | 7: 10262 | DOI:10.1038/s41598-017-10743-x
3
www.nature.com/scientificreports/ equivalents from C4-dicarboxylic acids by oxidative phosphorylation6. In the amastigote, which experiences a decrease in glucose uptake, the quantity of glycolytic flux is largely compromised. The preference of glucose utilization is relatively more towards AMP formation (4.41%) and mannan synthesis (7.36%) when compared with the sufficient glucose situation. The remaining glucose is utilized towards alanine formation (45%) and phospholipid formation (38.27%), whereas asparagine, tyrosine and isoleucine are utilized for formation of glutamate, glutamine and proline. As opposed to glucose, majority of alanine was utilized for satisfying the cellular demand; some of it (6.05%) was converted to pyruvate, which was either utilized for CO2 fixation within glycosome or secreted as overflow in both abundant and constrained scenarios. Similarly, environmental aspartate in the promastigote is consumed and transaminated into glutamate (96.83%) and oxaloacetate in cytoplasm6. Oxaloacetate forms malate, which enters mitochondria as fumarate, ultimately forming alanine (56.69%). In the amastigote, aspartate uptake reduces despite being catabolized via a similar route, the only difference being the sole formation of alanine (47.83%). Sufficient environmental glutamate is used for synthesis of glutamine (14.72%) via glycosomal GMP synthase, synthesis of proline (44.74%), aspartate by reverse de-amination of glutamate (14.72%), and glutamylcysteine to form trypanothione. In the amastigote, reduced glutamate uptake coerces its utilization into cellular metabolic demand and not as a precursor. Proline uptake (AA in Fig. 1, see Methods) is preferred as the sole carbon source to produce glutamate, in order to satisfy the metabolic demand in absence of environmental glutamate (5.14%). Serine, lysine, phenylalanine and valine (AA in Fig. 1) neither catabolize to give any intermediates nor are used as precursors and are directly utilized for biomass5. Under hypoxic conditions (amastigote condition), as biomass formation is sub-optimal, their utilization into biomass decreases. Glycine was produced solely from threonine. Leucine and isoleucine, both are utilized for provision of reduced FAD within mitochondrion. In the process, isoleucine converts into glutamate. As glutamate uptake largely reduces in amastigote, formation of glutamate and proline is largely compensated by isoleucine and leucine. Fatty acids are preferred only under glucose deficient conditions (amastigote metabolic state) and primarily provide acetyl-coA to pyruvate dehydrogenase complex18, thereby eventually forming glutamate. All the aforementioned predictions have also been experimentally observed from metabolomics studies5. In addition to the above carbon sources, the utilization of amino sugars (N-acetyl glucosamine) and mannose was also investigated. N-acetyl glucosamine is exclusively utilized under intracellular glucose-deficient, hypoxic conditions. N-acetyl glucosamine and mannose, both are utilized for provision of fructose-6-phosphate, which enters into mitochondria via succinate formation to produce alanine (98.3% and 87.76%, respectively). The uptake rates of both these sugars were predicted to decrease under hypoxic conditions of the amastigote; although, they do compensate the scarcity of glucose required for production of non-essential amino acids and mannan4, 19. In addition, mannose also forms mannan (4.89%) and compensates the reduction in glucose uptake within the amastigote. To further support the accuracy of model predictions, experimentally observed knockout phenotypes were compared with model-predicted phenotypes. 81% known phenotypes in promastigote and 84% known phenotypes in amastigote situations were accurately predicted from the model (Section 6 of Supplementary Information). The stage-specific comparison between promastigote and amastigote flux-profiles as predicted by the model and13C isotope enrichment of metabolites, for the glucose-only situation is given in Fig. 1B. It is important to note that, as there was no such targeted13C metabolomics study available for L. infantum JPCM5 and because the metabolic microenvironment experienced by different Leishmania species is rather similar4, the predicted reaction fluxes were compared with the 13C isotope enrichment of metabolites reported in the metabolomics study available for L. mexicana. Normalization was performed for percentage values of fluxes and experimentally available 13C isotope enrichment in a 0 to 1 scale, where 1 represents the highest normalized percentage flux value/isotope enrichment in mole percent and 0 the lowest. From Fig. 1B, it is clear that amastigotes demonstrate a lower synthesis of majority metabolites from glucose as compared to promastigotes owing to the reduced glucose uptake, in both experiments and model. Mannan production during the amastigote stage is larger than the promastigote in our L. infantum model, as compared to L. mexicana. The upregulation of mannan synthesis in amastigote was also observed in previous studies4. A slight upregulation of the pentose-phosphate shunt was observed in the L. infantum amastigote indicating its role in satisfying the requirement of AMP under a reduced glucose uptake. It can also be observed that similar metabolites are produced from glucose in both L. infantum and L. mexicana but with significant quantitative differences in both stages. The quantitative differences observed between the predicted reaction steady state fluxes in L. infantum JPCM5 and the13C isotope enrichment of metabolites available for L. mexicana might be due to – a) species-specific genes unique to L. mexicana or L. infantum. For example, metabolites of the incomplete urea cycle, are largely independent of glucose utilization and are optimally produced from different carbon sources like arginine for utilization into the metabolic demand within the L. infantum network which might not be the case in L. mexicana, due to differences in underlying network structure, b) multiple subcellular locations of different enzymes that might lead to alternative paths for distribution of intermediate metabolites produced from glucose within the pathways of glycolysis, pentose-phosphate-pathway and non-essential amino acid synthesis unique to the L. infantum JPCM5 metabolic network, and/or, c) metabolic demand being different between L. infantum and L. mexicana, leads to an increased drain of intermediate metabolites like non-essential amino acids into the L. infantum metabolic demand as compared to L. mexicana. The aforementioned reasons are only suggestive of the possibilities underlying the observed differences. Further inferences based on comparison of flux profiles in the two species can only be performed from an evolutionary perspective, given the degree of evolutionary divergence between L. infantum and L. mexicana, and the relatedness of L. mexicana with the Sauroleishmania20, which can be addressed in a future work.
Dynamic role of the non-essential amino acid motif in metabolic flux re-organizations. The observation of glucose being primarily diverted towards alanine under glucose-deficient conditions specifies that glucose can be substituted by a variety of other carbon sources to fulfill metabolite requirements other than SCIENtIfIC REPOrtS | 7: 10262 | DOI:10.1038/s41598-017-10743-x
4
www.nature.com/scientificreports/
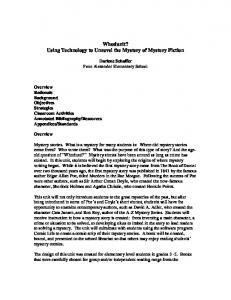
Figure 2. Sensitivity of flux towards synthesis of internal metabolites to specific input metabolite uptakes – Each bar in the plot represents the maximum flux through the synthesis of specific internal metabolites due to specific input metabolites, each synthesis considered as a separate metabolite drain (objective function) in the model. Four different scenarios were considered for optimizing the considered objective functions (synthesis of each separate output metabolite) namely, (A) only one given input at a time; (B) two inputs given at a time, glucose being fixed and a variable second input; (C) two inputs given at a time, one being isoleucine, which is kept fixed and a variable second input; and (D) Three inputs given at a time, glucose, tyrosine are fixed and a variable third input. The details of the designed methodology are further explained in Methods section.
alanine. The foremost question here is how this substitution can be achieved? To answer this, we introduce the notion of a “non-essential amino acid motif ”, which re-routes different metabolic inputs towards specific outputs under absence of preferred carbon sources, via implicit non-essential amino acid inter-conversions. The motif comprises of glutamate dehydrogenase, aspartate aminotransferase, tyrosine catabolic pathways, proline biosynthesis, glutamine biosynthesis, incomplete urea cycle, glycolytic and succinate fermentation pathways. To investigate their functionality, a sensitivity analysis was performed to understand the effect of glucose and uptakes of all amino acids, while optimizing for the formation of glutamate, alanine, aspartate, glutamine, proline, glycine, myoinositol and mannan, the formation of each considered as a separate objective function (see Methods). Apparent optimal production of each amino acid due to self-uptake was not included in analysis. Further, the metabolic demand reaction was constrained to zero flux in each case. Alanine is formed from a variety of resources and hence, tends to be an important overflow metabolite21, 22. Asparagine and aspartate, each of them when singly present in the environment can sub-optimally produce alanine (Fig. 2A). Presence of environmental glucose, isoleucine and tyrosine along with asparagine or aspartate amplifies production of alanine. Alanine is also produced when both proline and glucose are present in the environment, or when glutamate, glucose and tyrosine are made available. Glucose and tyrosine provide excess glutamate (Fig. 2B). Aspartate is optimally formed from asparagine, but sub-optimally formed from environmental proline and glucose or glutamate, glucose and tyrosine combinations. Similarly, glutamine is strictly formed when asparagine, aspartate and proline are part of the environment. Aspartate and isoleucine in the environment amplify flux towards production of glutamate, glutamine and proline (Fig. 2C). Glucose and tyrosine increase flux through proline degradation and glutamate formation, thereby producing excess glutamine (Fig. 2D). Glutamate biosynthesis follows the same route as glutamine. Proline, like any other non-essential amino acid is formed primarily from environmental asparagine and aspartate. Glutamate uptake from environment can also supplement glucose and tyrosine to form proline. The choice of various input metabolite combinations to produce a precise repertoire of outputs is largely governed by their ability to generate internal glutamate as a precursor. The importance of glutamate has also been previously discussed in the context of energy metabolism15. Also, these metabolite utilizations are typically due to presence of a redox and energy balance between the reactions utilizing these metabolic precursors. Environmental glucose and phosphatidic acid are catabolized through linear pathways for synthesis of mannan and phospholipids, respectively; although it is dependent on the non-essential amino acid motif via argininosuccinate synthetase for provision of ATP. Model-based knockout of argininosuccinate synthetase also predicts a lethal phenotype suggestive of its essential requirement (Section 6 of Supplementary Information). This further provides a novel insight into the possible essential role of argininosuccinate synthetase within the glycosome23.
Subcellular compartmentalization induces metabolite flux dependencies between distinct reactions. The utility and catabolism of environmental metabolites through defined metabolic routes is largely SCIENtIfIC REPOrtS | 7: 10262 | DOI:10.1038/s41598-017-10743-x
5
www.nature.com/scientificreports/
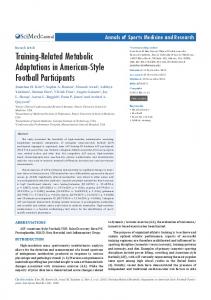
Figure 3. Comparison of flux profiles. (A) Normal (with glycosome) scenario. Red colored box indicates the glycosome. (B) Perturbed (without glycosome) scenario – the reactions take place in cytoplasm (represented as a bounded white space). While arrows indicate conversions from one metabolite to another, the colors indicate the mass balance of redox equivalents between a set of reactions. Grey colored arrows indicate complete blockage of reactions that were present in the actual normal scenario. The cases where redox balance is maintained within more than one reaction, are indicated by combination of colored arrows, as shown in the bottom of the figure. influenced by coupling between pathways for regaining electrons through reducing equivalents, ATP, small molecules, ions and other cofactors lost by one pathway from another pathway8, 24. The underlying network structure and its flux adaptation to the external sources are largely dictated by these dependencies. Intracellular boundaries created by subcellular compartments further reinforce these flux couplings25, 26. Glycosome and mitochondrion together harbor around 20% of metabolic enzymes (Section 2 of Supplementary Information) that produce biomass metabolites. Formations of only few metabolites, like sterol and membrane lipids (around 4%), are restricted within the endoplasmic reticulum. Comparing scenarios for the presence and absence of the glycosome and mitochondrion, effect on pairing of reactions based on mass balance was studied. Simulations were performed in both the model-presumed promastigote and amastigote conditions for both the normal (subcellular compartment present) and perturbed (subcellular compartment absent) scenarios (Supplementary Tables S2 and S3). Glucose is catabolized for AMP synthesis, diversion into TCA for non-essential amino acid synthesis via succinate fermentation, myo-inositol and mannan formation (Fig. 3A). Given the absence of glycolytic regulation machinery in Trypanosomatids27, glycosomes supervise this utilization of glucose towards appropriate outputs by promoting redox coupling between upper and lower part of glycolysis via NAD, glycosomal trypanothione reductase and pentose phosphate shunt via NADP, and cytosolic glutamate dehydrogenase with proline biosynthesis again via NADP, in glucose sufficient conditions. This dictates the use of precise combinations of external metabolites and their directed catabolism towards various internal metabolites via the non-essential amino acid motif. The glycosome also restricts the exchange of ATP/ADP and NAD/NADH generated from glycosomal reactions into the cytoplasm, thus, creating a balance between them28. This balance is maintained by upper and lower part of glycolysis, argininosuccinate synthetase, and nucleotide salvage pathways within the glycosome. The above-mentioned reactions are coupled even in deficient glucose conditions (amastigote), although the drain of glucose into succinate fermentation for formation of alanine is largely compromised. This is compensated by the NAD redox coupling between succinate fermentation and glycosomal fatty acid β-oxidation, governed by the presence of glycosome. The specificity of fatty acids as preferred carbon sources only in deficient glucose conditions is thus regulated by the glycosome. Removal of glycosome (Fig. 3B) gives rise to a distinct flux profile under glucose-deficient conditions when compared with normal flux scenarios (P