ReVis: Reverse Engineering by Clustering and Visual Object Classification
Aaron J. Quigleyρ ρ )
Margot Postemaρρ
Department of Computer Science And Software Engineering University of Newcastle Callaghan NSW 2308
[email protected]
Abstract This paper presents the framework of a scale-oriented scheme for the presentation and classification of reverse engineered sections of procedural code into objects. The aim is to develop an extensible system framework, which allows the output from a suite of data analysis tools to be visually presented to a user. The relationship between the analysis and visualisation is a progressive cycle, where each time through the cycle the overall quality of the classified objects improves. This framework supports two distinct methods of information feedback from the visualisation to the analysis suite. The two feedback loops aim to increase both the ease of understanding for the reverse engineer and the quality of the resultant objects. As the analyst views the visualisation the perceived view of the relationships exhibited in the system may be modified, removed or added to. This results in a change to the underlying graph or the clustering of that graph, which must be addressed in the visual presentation of the information using a variety of techniques to maintain the users ‘mental map’, or understanding each time through the cycle. Keywords: Software Visualisation, Clustering, Object Discovery, Reverse Engineering
1. Introduction Reverse engineering of extremely large software systems is a very difficult task where source code is usually the only available information. Legacy systems have previously been written procedurally and then heavily modified through maintenance. The understanding of these systems is challenging and due to their long life they need to be reengineered sooner or later. The current trend is to reverse engineer these systems by design discovery.
ρρ )
Heinz Schmidtρρ
School of Computer Science And Software Engineering Monash University Caulfield Vic 3145 {Margot.Postema,hws}@csse.monash.edu.au
One method used in forward engineering is to use these designs incorporating an object-oriented schema. Analysis of procedural source code for object discovery can involve clustering techniques [5, 6, 7]. Clustering techniques group together related functions and variables exhibiting relationships such as function uses variable, function updates variable, function calls function etc. However, these clusters representing potential objects are often too large, and not representative of classes in an object-oriented paradigm. The notion of objects and message-sends between them is difficult to discern from procedural code. Software visualisation takes advantage of the processing speed and graphical capabilities of computers to visually represent large amounts of information about software, which a user can then interpret. The key idea in visualisation is that the user’s perceptual abilities can be used to understand information. A user can often understand a clear textual description of a small amount of information, for example a small program. However, when dealing with large amounts of quantitative or relational information, a vast amount of text quickly becomes cumbersome. Using visualisation techniques, humans can perceive higher levels of information than in text alone (more abstract). ReVis aims to increase the amount of information that can be effectively presented and reduce the cognitive effort needed to understand that information. “Visualisation is essential for understanding architectural structures. The power and usability of a graphical tool, can often determine whether the architectural extractor is successful”[1]. The nature of software reverse engineering or program analysis necessitates handling large amounts of relational
data. The problem for a visualisation tool is to automatically create a visual representation that can be easily navigated and viewed on multiple levels of detail as needed [21]. Any graphical presentation of information is hindered by the bureaucratic debris in a computer display e.g. scrollbars, buttons, menus etc.; this is clearly the case in the generation of any software visualisation as, “if a picture isn’t worth a thousand words, the hell with it” [2]. In this paper we present a framework called ReVis which supports object classification through analysis and visualisation. Section 2 presents the background on reverse engineering and visualisation. Section 3 provides on overview of the ReVis framework, which integrates analysis and visualisation in a progressive cycle. By the use of various visualisation methods, the mental map or understanding is preserved when moving from cluster graph to cluster graph, each time through the refinement cycle. Section 4 introduces the object classification and analysis of a software system. Section 5 discusses component graphs. Section 6 describes a scale-oriented visualisation for the presentation and multi-level viewing of a cluster graph. Section 7 describes the work to date on components of this framework, conclusions and an outline of future work on ReVis.
2. Background Reverse engineering of a software system ideally includes the process of recovering system design. After the design is discovered, different approaches are then used to facilitate program understanding and design transformations, which can apply in the forward engineering phase of software reengineering. Software documents, usually in the form of source code, are input and parsed, prior to storage in repositories. Extracted information is then passed to browsers, where views of abstract syntax trees, graphs, call graphs, interfaces, documentation and reports occur. Ideally, reverse engineering of software should recover system design, in the form of higher level abstractions, and objects from source code. However, large systems are often difficult to analyse, and the abstraction process cannot be fully automated. Object discovery from procedural code can be based on clustering techniques of routines that share data [5]. Objects are collections of related data and behaviour, and can be discovered from procedural languages by grouping related data and functions that use or manipulate these. A candidate object may be defined as a set of related
routines (representing methods or behaviour of the objects), data types (representing the states of the objects) and data items (representing instances of the objects class) [6]. In reality, for reasons such as program efficiency, or lazy maintenance, this is not the case. Hence the idealistic and simplistic view of a candidate object is somewhat fuzzy and requires human intervention. Automatic analysis of any information can remove a lot of tedium and rote processing for a reverse engineer. Visualisation is one technique to put the user back into the process of both the understanding of the architecture and the underlying relationships in a software system. Using visualisation to understand a system is based on the fact that the user's perceptual abilities cannot yet by fully understood or automated. The aim of software visualisation is to produce a graphical representation of the software, i.e. a picture, which conveys a lot of the details the reverse engineer in interested in. One way to view a software system is in terms of its minimal units i.e. functions, variables, methods, objects etc., or even those units grouped, along with their interrelationships[19]. This view of the software describes a graph, and now the problem in creating a picture, of a graph, is to assign a location for the node and a route for the edge. This is the classical graph drawing problem. This problem has been researched since graphics workstations were introduced in the 1980s; see, for example [3,4,11,12,14,22]. Relationships within software, either static or dynamic, along with the elements of the software, can be expressed in graph terms. This lends itself as a very good model for the representation of information. A good visual representation of these graphs can effectively convey information and hence understanding to the user but a poor representation can confuse or worse, mislead [2]. The challenge in graph drawing is to develop methods that produce quality information layout. The quality of a layout can be measured in some concrete terms such as node separateness, edge length, and uniformity of edge length, straight edge connections and edge crossings. These terms describe a variety of aesthetics in graph drawing; an arbitrary layout can be measured in terms of how well the model and algorithm draw the graph according to a set of aesthetics. These aesthetics are not mutual exclusive and are sometimes in direct conflict. A graph drawing algorithm cannot be expected to satisfy all of the aesthetics, as a result a representative set of aesthetics for the problem at hand are chosen which can then be used to determine the quality of a graph drawing[24]. Some of the aesthetics
used include: • Edges should not cross when drawn. • Edges should be drawn as straight-lines. • Minimization of the area of the drawing. • Low variance of edge lengths. • Good angular resolution. The scale of creating a large software visualisation introduces other, non-functional, requirements for a graph drawing method that although not related to the quality of the output, must be considered. Some of these include: • Speed of the method. • Computational complexity. • Ability to scale for larger layouts. • Reduction of visual complexity. Other software visualisation systems that deal with large data sets employ various techniques such as, a large virtual canvas (scrolling & zooming), information mural [20], fisheye view [13] and logical frames with trails [11] to aid the user in viewing and exploring the information presented. However, the complexity and size of the data sets generated from a software clustering analysis means any visualisation tool is limited in its ability to present an overall picture of the information. As in clustering, a visualisation system must balance the loss of precision in presenting more abstract representations with the realization that a clearer more abstract representation will allow greater insight into the overall structure of the information. The computational cost of any layout method is directly measurable. Other, more abstract measures, such as how much information is conveyed, how fast the diagram presents a piece of information are more difficult to measure and are the subject of considerable HCI study [3,17,18,24]. The development of the ReVis framework will allow for this and other such measures to be assessed on reverse engineering projects. One of the envisaged novel aspects of the visualisation part of ReVis is dealing with the so-called “Mental Map problem”[23]. When visually exploring a large data space it is common for users to get lost in the quantity, their relative position and current state of the layout. Research into addressing the first two questions has been ongoing and a variety of techniques such as animation, smooth change, trails, shading, fading etc. are used to help retain the users current model of understanding, or mental map [4,11,13]. Addressing the issue of preserving the mental map when the underlying graph and its associated clustering in theoretic or geometric terms can change each time through the feedback cycle, is crucial to ensure the Visualisation aids in understanding and doesn’t confuse or worse mislead the Reverse Engineer.
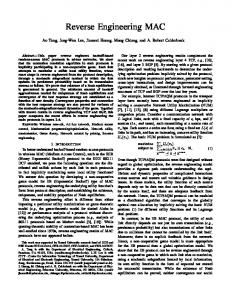
3. Framework for ReVis The ReVis framework consists of a data source being passed into an analysis phase, and subsequently visualized. The visualisation provides a different view and offers insight into understanding of the analysed data. From here, input can be made to the analysis stage and the process continues in a cyclic manner until a satisfactory output is obtained. Figure 1 demonstrates this framework where the engineer obtains understanding from the visualisation and inputs changes to the analysis. The figure also shows an additional loop from visualisation directly to analysis supporting automation.
Figure 1. ReVis framework
Each time through the cycle in ReVis the graph is drawn and a space decomposition tree is generated. This decomposition tree serves three purposes; firstly it is used by a new Force Directed Algorithm to cycle back to a new drawing with a lower energy level. This cycle is the progressive improvement of the layout. Secondly, the decomposition tree is used to visualize the large data set at a high level of abstraction, this can be rendered in less time and with less visual complexity. This is a hierarchical or multi-level visualisation. And, thirdly the hierarchical decomposition tree along with the geometric information of the layout, node and edge positions can be fed back to the analysis suite and used for both a graph theoretic cluster analysis and geometric cluster analysis. Since the decomposition tree partitions the graph, this means a graph theoretic measure can be applied. Likewise, the tree creates geometric clusters, which can be measured and classified. In the software reverse engineering domain, the data source represents parsing of source code, and the analysis is a partial form of clustering techniques discussed below. The analysis uses weights for relationships between variables and functions of the parsed source code. This is used to generate weighted graphs, which are fed forward
to the visualisation stage. The engineer can view the graphs in the space decomposition trees and gain understanding of the analysis. Additionally the engineer can explore inside clusters, as well as zoom out to a hierarchical view. Using human expertise and domain knowledge, changes can be made to the weights, subsequently invoking changes to further analysis. Output from this further analysis is fed back into the visualisation and a new view of the cluster graphs is generated. The change of the view requires careful consideration to allow the engineer to retain the ‘mental map’. Techniques such as animation, fading, shading are used to help retain understanding. The view can additionally be returned to the previous one, and then moved forward again to the current. Not only does this assist in understanding for the engineer, but gives control for decisions made. Thus, it can be seen if the changes fed back to the analysis resulted in a better or worse view. The engineer then has the option to keep or discard these changes and make subsequent ones. The tuning cycle continues until a satisfactory output is obtained. Forward engineering to object-oriented code can then proceed. In the following sections the elements of this framework are described in more detail.
4. Cluster Graph Generation As previously mentioned in Section 2, objects are collections of related data and behaviour. Object-like features can be discovered from procedural languages such as C, by grouping together related data and functions that use or manipulate these. Candidate objects can be defined as sets of related routines, data types and data items.
Internal connectivity of sub-graphs [8] assists in identifying separate objects within large clusters. This object identification method exploits the properties of a bipartite, describing global variable usage. The graph is a variable-reference graph, and is a partial view of an entity-entity interconnection graph depicting used-within dependencies. A variable-reference graph only records global variable usage. Isolated sub-graphs of the variablereference graph are associated with objects in an objectoriented design. Undesired links between subgraphs of the variable-reference graph occur due to the presence of routines accessing data structures of more than one object. Unfortunately, as mentioned above, methods linking more than one object can generate objects that are too big. Further, interleaved code [10] can hinder discrete object identification. Extending the variable-reference graph, a variable-typefunction graph [9] is a weighted graph where a node is a global variable or a function, and an edge connecting two nodes, represents a relationship. The weight of the edge represents a degree of correlation between nodes, and is the sum of the weights of the relations existing between them. An object is an optimized cluster of relations, which uses a measure of internal connectivity on a subgraph. The internal connectivity can be defined as the sum of weights of internal edges divided by the sum of weights of internal and external edges. Clusters are obtained by including external edges to a subgraph until the internal connectivity of the new subgraph does not decrease [9]. This method overcomes previous earlier limitations as weak relations linking two objects are ignored.
Clustering techniques [5] are used to discover objects in procedural code. Ideally these should find disjoint sets of related data and functions. However, in reality this is not the case, and links between objects are difficult to identify, resulting in clusters that are “too big” and representing more than one object. Two clustering methods introduced by Lui and Wilde [6] are globals based and types based object finder. The first method identifies objects based on links between routines and global data. The second method is based on relationships between data types and routines using them as formal parameters or return values. These clustering algorithms used in reverse engineering for object discovery from procedural code, do not identify links between objects, thus clustering these into large objects.
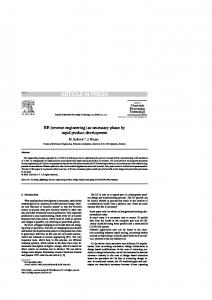
Figure 2. Potential object clusters
Figure 2 shows an example of potential object clusters. Subgraph 1 is linked through a relationship to subgraph 2. However this link is identified as a weak link and the two subgraphs become potential objects.
Stronger links between subgraphs would however cluster them into objects that are considered to be too large.
with the ability for the visualisation to explore inside the clusters.
5. Component Graphs
One method for visualizing a component graph is the modified hierarchical force-directed method [21]. This method uses the physical analogy of the graph as a system of bodies with forces acting between and across the bodies [3, 4, 12]. Generally such methods consist of two parts; the model which is, a system of forces and the algorithm, which provides a way to reach an equilibrium state for the system of forces. For the ReVis framework, this system of specifying specific forces, will allow the different types of relationships recognized from the analysis component to be visually expressed in different ways, resulting in a customised layout.
The clustered graphs provide the basis for component graphs in which three aspects of large software systems are separated: 1. Architectural definition 2. Interface definition 3. Function definition The graph representation for architectural definitions has been developed in a parallel European Australian collaborative project [25,26] with a view to distributed systems. We distinguish socalled kens, i.e. disjoint regions or protection domaines for multi-threaded control with their own supporting objects. Communication connectionns between gates are via distinguished interface objects called gates. From the cluster graphs of the previous section, kens are computed as a higher-level clustering using a similar clustering algorithm now identifying weaker coupling and applying heuristics. For example the fact the kens partition a distributed object space and thus do not share subkens (subcomponents) but may share references to common external gates is used to give ken sharing a stronger coupling weight than gate sharing. The resulting graphs are used alongside UML presentations of semantic relationships discovered as a result of the two-level clustering. Such relationship include class uses class, class has attribute, class has method etc. as part of interface definition and the functional graphs representing semantic relationships from which cluster graphs were computed in the first place. It should be noted that any of these graphs are in general cyclic. Only if we restrict the presentation to one particular semantic relationship, such as inheritance for example, will the resulting graphs be constrained to acyclic graphs, or in some cases like the ken-owns-ken relationship to a tree structure.
6. Component Graph Layout In strict terms, a clustering algorithm produces a partitioning of the data set which describe average objects, so that the objects within a cluster are close, based on some similarity measure. Once the clustering or analysis has taken place, the Visualisation component of ReVis must generate a graphical representation. In the first instance, the clusters can be thought of simply a group of nodes. At this stage, all that is required is a higher order visual representation of this grouping along
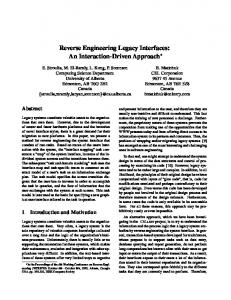
Figure 3. Space decomposition, improved layout performance and visual abstraction The basic difference between any two force directed methods is in how it describes the model (i.e. sees the physical world) and the algorithm it uses to reach an equilibrium state. All force directed algorithms move the system from state to state, with the goal of approaching equilibrium with each transition. Since this is a simulation mechanism, how many iterations required to bring the system to, or close to, equilibrium cannot be determined a priori, in general this is approximated. Empirical evidence has shown that when using this method the resulting graph drawing can be good. Various algorithms based on simulated annealing, parallel processing, constraint satisfaction [14] and electrical/spring forces [11] have been developed. The simplest method is based on a spring/electrical force model. Edges in the graph are modeled as springs, which obey Hooke’s law and which have a natural length luv. All nodes repel each other; this is modeled as an electrical repulsion, which follows the inverse square law. The
overall force on any node V can be described as
particle comparison or a particle to sub-tree (cell) must be computed.
7. Conclusions and Future Work F (v) =
∑f
uv
+
( u ,v )∈E
∑g
uv
The ReVis framework presented in this paper incorporates a data source passed to an analysis stage. Outputs from data analysis are fed into a visualisation tool, supporting clustering and decomposition techniques. From here understanding can be obtained, and changes made back to the analysis stage. The cyclic process of analysis and visualisation continues until a satisfactory output is achieved.
( u ,v )∈V ×V
d
Center of mass
L Figure 4. Using a tree structure to determine measure of closeness
6.1 The Scale Problem 2
The complexity of this method is O(n ), due to the node to node force calculation for electrical repulsion. The high computational cost of previous force directed methods, have limited their use to the drawing of relatively small graphs. Hierarchical schemes that take advantage of the fact that particles interact strongly with nearest neighbours but less detailed information is needed for large range interactions. Barnes and Hut introduced the notion of recursive space decomposition, where a tree is built for each new step in the simulation [16]. The tree structure is used in a systematic way to determine if a particle to subtree comparison for the force calculation is sufficient based on some distance measure. Developing the measure of distance in abstract terms rather than absolute distances allowed Barnes & Hut to rigorously prove an O(NlogN) complexity. The process of building such a regular space decomposition tree is described in [15]. When determining the forces, a mathematical measure of whether to use a particle to
This framework can be used for reverse engineering of software, which aims at discovering objects from procedural code. Clustering techniques are used for object discovery, along with visualisation to offer better understanding of the underlying data source. By placing the reverse engineer in the loop (i.e. analysis-> visualisation; visualisation -> analysis), the underlying results are improved. Currently the ReVis framework presented in this paper includes data analysis of software source code, incorporating partial clustering techniques, where related functions and variables are group into subgraphs. Coincidental and spurious connections link these subgraphs which can be fed to the visualisation stage. Visualisation techniques demonstrate space trees decomposition and hierarchical views. These two stages of the framework will be associated together by putting the engineer into the loop. The benefit of this approach is that the results will be improved over automated techniques, which can only cluster data into potential objects where weak links can be easily identified. Stronger links tend to cluster subgraphs into too large objects in fully automated methods. Human intervention is a necessary requirement for improved object discovery from procedural software source.
References [1] M.N. Armstrong and C. Trudeau. Evaluating Architectural Extractors. Fifth Working Conference on Reverse Engineering. pp. 30-39, 1998. [2] E. R. Tufte, Visual Explanations, Graphics Press 1997. [3] T. Fruchterman and E. Reingold, “Graph Drawing by Force-Directed Placement”, Software Practice and Experience vol, no. 11, pp1129-1164, 1991 [4] Giuseppe Di Battista, Peter Eades et al, “Graph Drawing, algorithms for visualisation of graphs”, Prentice Hall 1999. [5] D. Hutchens and V. Basili. System structure analysis: clustering with data bindings. In IEEE Transactions on
[6]
[7]
[8]
[9]
[10]
[11]
[12] [13]
[14]
[15] [16] [17] [18]
[19]
[20]
[21]
[22] [23]
Software Engineering, Volume SE-11, pp. 749-757, August 1995. S. Lui and N. Wilde. Identifying objects in conventional procedural language: An example of data design recovery. In Proc. International Conference on Software Maintenance, pp. 266-271, 1990. R. Ogando, S. Yau, S. Lui and N. Wilde. An object finder for program understanding in software maintenance. Journal of Software Maintenance: Research and Practice, 6, pp. 261-283. 1994. G. Canfora and A. Cimitile. An improved algorithm for identifying objects in code. In Software – Pract6ice and Experience, Volume 26, pp. 25-48. January 1996. Y. Jin, S. Mah and G. Shin. Deriving an object model from procedural programs. In C. Mingins, R. Duke and B. Meyer (Eds), Technology of Object-Oriented Languages and Systems Tools 25, pp. 233-241. Monash Printing Services, Australia, 1997. S. Rugaber, K Stirewalt and L.M. Wills. The interleaving problem in program understanding. In L. Wills, P. Newcomb and E. Chikofsky, editors, Second Working Conference on Reverse Engineering, IEEE Computer Society Press, Canada, p. 166-175, 1995. M. Huang, P. Eades and J. Wang, On-line Animated Visualisation of Huge Graphs using a Modified Spring Algorithm, Journal of Visual Languages and Computing, p.623-645, 1998 P. Eades , A Heuristic for graph drawing, Congresses Numerantium, p 149-160, 1984 M. Storey and H. Muller, Graph Layout Adjustment Strategies, pp. 487-499, in Proceedings Symposium on Graph Drawing, Springer Verlag 1995. W. He & K. Marriott, Constrained Graph Layout, Proceedings Graph Drawing 1996, vol. 1190, pp. 217-232, Springer-Verlag, 1997 S. Pfalzner & P. Gibbon, Many-Body Tree Methods in Physics, Cambridge University Press 1996. J. Barnes & P. Hut, A hierarchical O(N log N) forcecalculation algorithm, p.446-449, Nature 1986 A. Csinger, The Psychology of Visualisation, Department of Computer Science, British Columbia, 1992 C. G. Healey, Choosing Effective Colours for Data Visualisation, Department of Computer Science, British Columbia, 1992 D. Jerding, J. Stasko and, T. Ball. Visualizing Interactions in Program Executions, Proceedings of the 19th International Conference on Software Engineering, pp. 360-370, May 1997. Y. Chen & G. Fowler et al, Ciao: A graphical Navigator for Software and Document Repositories, pp. 66-75, WCRE 1995 A. Quigley and P. Eades, ProVEDA: A scheme for Progressive Visualisation and Exploratory Data Analysis of Clusters. In Proceedings of 3rd Software Visualisation Workshop 1999 Q.W. Feng., Algorithms for drawing clustered graphs, PhD thesis, The University of Newcastle, Australia, 1997 K. Misue, P. Eades et al, Layout Adjustment and the Mental Map, Journal of Visual Languages and Computing, pp. 183-210, 1995
[24] H. Purchase, Which aesthetic has the greatest effect on human understanding? In. G. di Battista, editor, Graph Drawing Proceedings, Springer Verlag, 1997 [25] B Kramer, M Papazoglou and H Schmidt: Information Systems Interoperability, Advanced Software Development Series, Research Studies Press Ltd, Taunton Sommerset England, 1-331, 331pp. [26] Meyer, Mingins, Schmidt: Providing Trusted Components to the Industry, IEEE Computer 5/1998, pp. 104-105 [27] Schmidt, "Compatibility of interoperable objects", in: B. Kraemer, M. Papazoglou, H. Schmidt (eds) Information Systems Interoperability Research Studies Press, 1998 [28] Postema and Schmidt: "Reverse Engineering and Abstraction of Legacy Systems” Informatica: An International Journal of Computing and Informatics, 1998