lem of the robustness of the ASR in real{life (as opposed to laboratory) .... important obstacles on the way to wider deployment of speech enabled products. ..... for additive noise removal 56], RASTA was applied to a domain linear{like for small ...... Assuming that f(xjS) is a multivariate Gaussian p.d.f., f(xpjS) as a marginal ...
University of She�eld Department of Computer Science Speech and Hearing Research Group
ROBUST AUTOMATIC SPEECH RECOGNITION WITH UNRELIABLE DATA
Progress report #2 : months 1 { 12
Ljubomir Josifovski
February 1999
Abstract Theoretical and practical issues of some of the problems in robust automatic speech recognition (ASR) and some of the techniques that address them are presented in this report. The problem of the robustness of the ASR in real{life (as opposed to laboratory) conditions is paramount to the widespread deployment of speech enabled products. The report reviews techniques used so far for robust ASR, ranging from simple spectrum subtraction to various types of model adaptation. A possible connection of robust ASR with the computational auditory scene analysis (CASA), methods for local Signal{to{Noise Ratio (SNR) estimation and classi cation/scoring with on{line adapted statistical models is discussed. The main focus is on the techniques that would allow for incorporation of CASA and local SNR estimates (used as methods for speech/non{speech separation) into the present prevailing stochastic pattern matching paradigms { Hidden Markov models (HMM) and arti cial neural networks (ANN). This is referred to as a classi cation with unreliable (both missing and/or uncertain) data throughout the report. The major di�erence compared with other known methods is the assumption that (a) parts of the spectra remain (relatively) una�ected by the noise; (b) they can be identi ed; (c) they are su�cient for automatic speech recognition. Research done so far, other activities in connection with the postgraduate studies (research training program, departmental and other seminars) and activities planned for the next six months are outlined at the end of the report. In the Appendix, the derivations for the multidimensional integral of the sigmoid function are given.
Contents 1 Introduction 2 Review of robust ASR techniques
2.1 Speech enhancement . . . . . . . . . . . . . . 2.1.1 Spectral subtraction . . . . . . . . . . 2.1.2 Noisy { to { clean mapping . . . . . . 2.1.3 Noise masking . . . . . . . . . . . . . 2.2 Robust features . . . . . . . . . . . . . . . . . 2.2.1 Perceptual linear prediction . . . . . . 2.2.2 Relative spectra . . . . . . . . . . . . 2.2.3 Cepstrum mean normalization . . . . 2.2.4 Spectral peaks . . . . . . . . . . . . . 2.2.5 Modulation spectrogram . . . . . . . . 2.3 Model adaptation . . . . . . . . . . . . . . . . 2.3.1 HMM decomposition . . . . . . . . . . 2.3.2 Parallel model combination . . . . . . 2.3.3 Wiener ltering . . . . . . . . . . . . . 2.3.4 Speaker adaptation . . . . . . . . . . . 2.3.5 Maximum likelihood linear regression 2.3.6 Maximum a posterior probability . . . 2.3.7 Minimum classi cation error . . . . .
. . . . . . . . . . . . . . . . . .
. . . . . . . . . . . . . . . . . .
. . . . . . . . . . . . . . . . . .
. . . . . . . . . . . . . . . . . .
. . . . . . . . . . . . . . . . . .
. . . . . . . . . . . . . . . . . .
. . . . . . . . . . . . . . . . . .
. . . . . . . . . . . . . . . . . .
. . . . . . . . . . . . . . . . . .
. . . . . . . . . . . . . . . . . .
. . . . . . . . . . . . . . . . . .
. . . . . . . . . . . . . . . . . .
. . . . . . . . . . . . . . . . . .
3.1 Motivation . . . . . . . . . . . . . . . . . . . . . . . . . . . . . 3.2 Separation/identi cation of reliable/unreliable regions . . . . . 3.2.1 Computational auditory scene analysis . . . . . . . . . . 3.2.2 Local Signal { to { Noise ratio estimation for separation 3.2.3 Spectral subtraction for separation . . . . . . . . . . . . 3.2.4 Blind source separation . . . . . . . . . . . . . . . . . . 3.3 Classi cation with missing and unreliable data for robust ASR 3.3.1 Review of techniques for classi cation with missing data 3.3.2 Recognition with missing data . . . . . . . . . . . . . . 3.3.3 Classi cation with missing data using class imputation . 3.3.4 Class imputation within the HMM framework . . . . . .
. . . . . . . . . . .
. . . . . . . . . . .
. . . . . . . . . . .
. . . . . . . . . . .
. . . . . . . . . . .
. . . . . . . . . . .
. . . . . . . . . . .
. . . . . . . . . . .
. . . . . . . . . . .
. . . . . . . . . . .
3 Automatic speech recognition with missing data
I
. . . . . . . . . . . . . . . . . .
. . . . . . . . . . . . . . . . . .
. . . . . . . . . . . . . . . . . .
. . . . . . . . . . . . . . . . . .
. . . . . . . . . . . . . . . . . .
. . . . . . . . . . . . . . . . . .
. . . . . . . . . . . . . . . . . .
1 4
6 6 6 6 7 7 7 8 8 8 9 9 9 10 10 11 11 11
13 13 14 15 19 21 21 21 21 25 26 26
3.3.5 3.3.6 3.3.7 3.3.8 3.3.9 3.3.10 3.3.11 3.3.12
Class imputation with arti cial neural networks as posterior estimators . Incorporating additional knowledge in the classi cation . . . . . . . . . . Classi cation with missing data using missing data imputation . . . . . . Local data imputation . . . . . . . . . . . . . . . . . . . . . . . . . . . . . Global data imputation . . . . . . . . . . . . . . . . . . . . . . . . . . . . Classi cation with uncertain data using class imputation . . . . . . . . . Class imputation with uncertain data within HMM framework . . . . . . Class imputation with uncertain data using arti cial neural network as a posterior estimator . . . . . . . . . . . . . . . . . . . . . . . . . . . . . . . 3.3.13 Learning with missing and unreliable data . . . . . . . . . . . . . . . . . . 3.3.14 Multistream approach to ASR . . . . . . . . . . . . . . . . . . . . . . . .
4 5 6 A
Research done so far Other Activities Plan for the next 6 months Calculating the multidimensional integral of the sigmoid function
A.1 The analytic solution of the multidimensional sigmoid integral . . . . . . . . . . . A.2 Computing the approximation of the analytic solution . . . . . . . . . . . . . . .
Bibliography
29 34 34 35 37 38 38 39 40 41
43 44 46 47 47 51
53
II
Chapter 1
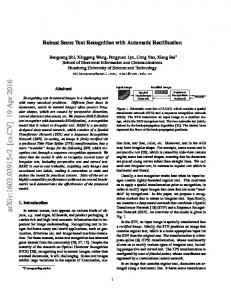
Introduction Current Automatic Speech Recognition (ASR) systems perform acceptably in controlled environments [6] [62] [87]. The performance is good enough to be deployed in commercial products. However, used in noisy conditions, their performance deteriorates rapidly to a point where they are unusable in practice [1]. We refer to this as a problem of robustness of the ASR systems. Compared to the human performance in less then ideal conditions, ASR systems perform order of magnitude worse, even when specially adapted cope with that particular kind of degradation (see Figures 1.2 to 1.5 for recent comparison on various corpora and types of speech shown of Figure 1.1) [66]. Also, current systems are usable only on speech which is generated for machine recognition, rather than for listeners. Applications like recognition of spontaneous speech in spoken dialog systems (especially over the phone), recording legal proceedings, taking minutes of meetings or recognition/transcription of broadcast news [93] are still too hard. The performances cited in literature vary from 2% word error rate (WER) for airplane travel system with medium vocabulary to 50% WER for large vocabulary dialog system [21]. Human WER on similar spontaneous speech is around 4%. It seems that the problem of robustness is one of the important obstacles on the way to wider deployment of speech enabled products. It is well known that humans can cope with unnatural and unseen degradations without prior training or adaptation. They can ignore broad range of degradations and deletions in time and frequency domain, while still taking into account whatever information or cues are left for the recognition. Humans are capable of utilizing the partial information left in the degraded speech [3]. This is exactly the capability that \missing data" approach tries to model. Although we refer to this approach as to a \missing data" approach, more appropriate name may be \recognition with uncertain data". Because (as described further in the report) the case when the data is completely unobserved (and thus missing) may be considered as a special, limiting case of classi cation with uncertain data, with the level of uncertainty being in nite. As redundancy in speech is the natural way for the human speech production/perception to combat the degradations during the transition of the information through the channel, one can hope that developing techniques that take advantage of redundancy would be bene cial. The outline of this report is as follows. Chapter 2 is review of the other approaches to the problem of robustness in ASR taken so far. In chapter 3 the original motivations and the structure of a ASR system operating under assumptions that the data is missing or uncertain are lied down. Specially, section 3.2 discusses the problem of sound sources separation from 1
Figure 1.1: Six talker{independent speech recognition corpora used to compare humans and machines (reproduced from [66]).
Figure 1.2: Human and machine error rates for connected digits and isolated alphabet letters (reproduced from [66]).
Figure 1.3: Performance of humans and of a HMM recognizer with noise compensation for Wall Street Journal sentences with additive automobile noise (reproduced from [66]). 2
Figure 1.4: WER for humans and a HMM recognizer on phrases extracted from spontaneous telephone conversations in the credit card speech corpus (reproduced from [66]).
Figure 1.5: Human and machine error rates with multiple microphones for the NAB corpus (reproduced from [66]).
the mixture. The subsection 3.2.1 shows how computational auditory scene analysis (CASA) can tackle this problem. Subsection 3.2.2 outlines some of the techniques for local Signal{to{ Noise Ratio (SNR) estimation that can be used as an (computationally cheap) alternative to CASA methods. Section 3.3 lays down the work done so far in the framework of \missing data" (and not only for robust ASR). Chapter 4 presents the work I've done so far in the past twelve months. Chapter 5 lists various activities I've been involved in as part of the PhD studies at the Department of Computer Science at University of She�eld. The plan for the future research is outlined in Chapter 6.
3
Chapter 2
Review of robust ASR techniques The conventional view on the problem of robustness in ASR is that performance degradation in ASR systems is due to the di�erences between the speech signal they receive on input (when employed in a real-life application) and the speech signal/data used for training (estimation) of the parameters of their models during system construction [48] [38]. This is commonly referred to as a \mismatch between training and testing conditions" view to the problem. Usually, the training conditions are: clean speech (we'll see later that these need not be always the case) and speech gathered from di�erent speakers, with di�erent genders, speaking rates, dialects etc. [94] [88] [95] [20]. This approach to the robustness implies that if the type of mismatch is known in advance, the ASR system can be designed and trained to perform acceptably on such speech. However, so many factors in uence variability, and they are interdependent in ways, that one can not hope that it's possible to put together enormous amounts of data that would re ect all possible combinations of sources of mismatch. Even if possible, deriving models from such heterogeneous data would probably lead to at models with poor discrimination that would perform badly in every particular, concrete conditions [63]. Some common reasons for mismatch between training and testing speech signal are considered to be: � contamination with noise (additive, convolutional, reverberation); � speaking style (Lombard e�ect, speaking rate); � inter speaker variations (voice quality, pitch, gender, dialect); � task/context (dialogue, dictation, conversation). Additive noise usually results from a microphone picking other sound sources in addition to the speech that is to be recognized. These are sounds generated by the o�ce equipment, coming from the tra�c on the street, etc. The human auditory system is so robust to this degradation that humans aren't aware of it most of the time. Additive noise is additive to the speech signal in the time domain. Convolutional noise results from imperfect processing of the speech signal by the audio equipment (the microphone, analog to digital converter, etc.) in the process of its conversion to digital form. Convolutional noise is multiplicative to the speech signal in frequency domain. In a typical environment, the microphone picks up not only the actual speech, but also 4
copies of the speech that bounced o� the walls and arrived at the microphone with some latency and distorted. This is known as reverberation. The Lombard e�ect [58][59] refers to a change in the speaking style when the speaker is in a noisy environment. The speaker articulates her/his speech in such a way that it is more noiserobust for human perception. Therefore, this a�ects all information extracted from the speech signal (speech features) used by the present ASR systems at a great extent, devastating it's performance. It's not simply a matter of speaking loudly and/or slowly. Making more vocal e�ort changes articulation style in a complex way. The Lombard e�ect also makes data-gathering for robust ASR di�cult: speech produced in a truly noisy environment will be signi cantly di�erent from speech produced in quiet, with noise added on later. Additionally, the speaking rates of the speakers vary not only in response to the acoustic environment, but also because of a number of other factors. The voice quality, gender, age, dialect are another source of variation in the speech that ASR systems have to take into account. For all present systems there usually exists a small category of speakers for whom (due to di�erent factors) the system exhibits exceptionally high WER (the so called \sheep & goats" phenomena). As speech researchers have found, by trying to apply ASR systems trained on read speech to the task of ASR of spontaneous speech, there is a di�erence in the articulation of the speech and the vocabulary of the speaker depending on the task that is to be accomplished. Continuous read speech (e.g. dictation), speech in the dialogue and conversational speech all make a di�erence for the present recognizers. If the problem of robustness in ASR systems is to be considered as a mismatch between the training and testing conditions, the solution would be to nd a way to reduce it. Common approaches are [48]: � speech signal \enhancement"; � using robust features; � model alteration/adaptation. Another view of the taxonomy of mismatch reduction is that the mismatch can be considered to happen (and one might attempt to reduce it accordingly) in the signal space (\enhance" speech), in the feature space (apply such feature extraction/transformation that would wipe the variability present in the signal space out of the feature space), and in the model space (change model parameters to take variability present in the model space into account) [38]. This taxonomy arises from the architecture of the present ASR systems, where the recognition happens in two independent stages. In the rst one, the information content of the speech signal is reduced by some transformation in a way intended to preserve information considered to be \important" for the recognition, and discard the rest of it. The result of the transformation is a feature vector. In the second stage, the whole feature vector space is searched for the most probable sequence of speech units that might have resulted in the observed sequence of feature vectors under some constraints. The constraints are statistical models with parameters trained on a large corpus (hundreds of hours) of speech and language data (texts totaling billions of words) during the ASR system construction. Therefore, there are three spaces (signal, feature and model space) where mismatch occurs, and can be reduced. 5
2.1 Speech enhancement Techniques from this class are mainly used to reduce the mismatch between training and testing conditions that are due to the noise. Most of them originate from attempts to improve speech intelligibility. Therefore, another problem is introduced: the \enhanced" or \cleaned" (because they mostly deal with noise attenuation) speech maybe more intelligible to the humans, but not to the ASR systems. However, speech enhancement might be particularly attractive in a situation where other system components are not possible to be changed [99].
2.1.1 Spectral subtraction
Spectral subtraction is an e�ective way for \cleaning" the speech from the additive noise. The prerequisite is that noise spectra can be estimated. This is usually done by detecting the latest non-speech region and estimating the noise spectra there. Thus, the underlying assumption is that the noise will not change signi cantly during this short period of time. The problem of ending with negative spectra can be solved by non-linear subtraction [122] [69] [68] [82] [118]. Still, one of the main problems of the method is introduction of the so-called \musical tones" in the speech signal. One way to reduce this unwanted e�ect is to median smooth the signal after the subtraction [65]. It has also been successfully integrated into the Parallel Model Combination (PMC) framework [36]. The gains of the method tend to decrease at lower SNRs, and occasionally fricatives and plosives may disappear from the signal after the subtraction.
2.1.2 Noisy { to { clean mapping
Another idea is to nd some kind of mapping between the noisy and clean speech or the features derived from them. Thus, applying this transformation to the noisy speech would yield clean speech or parameters as like the one of clean speech. In order to estimate the mapping, both versions of the signal - clean and noisy are necessary. Various types of mappings may be considered: various types of linear regression [82], non-linear estimators such as multi-layer perceptrons (MLP) [82] [44], etc. The process of nding the appropriate mapping is by minimizing some error function - typically the mean square error (MSE). The drawback is that the e�ectiveness depends on the type of noise that the mapping was derived from. So, while on the same type of noise the mapping should yield good results, for di�erent types of noise the result is unpredictable. An iterative process (using Wiener lter) for maximization of posterior probability (MAP) was used for all{pole model in [61].
2.1.3 Noise masking
Noise masking is another technique, somewhat similar to spectral subtraction, for enhancing the speech quality. It's inspired by a known e�ect in the auditory system that a signal can \mask" the neighboring signal in the adjacent frequency bands, if the di�erence between the signal levels is su�ciently high. The masked signal is not perceived. It is believed that this maybe one of the methods for noise suppression that human auditory system uses to enhance the local SNR. The idea is to detect the frequency bends where the energy is below certain threshold and thus is believed to belong to the noise, and replace this value by the value of the mask for the
6
subsequent processing (as opposed to subtraction of the noise level with spectral subtraction) [29]. This operation would decrease variability due to noise. Variant of this scheme in [57] (of some interest to us because it tackles uncertainty using what in this paper is referred to as the \missing data" approach) integrates over the possible values of the signal below the noise mask. However, comparison with previous related approaches shows performance deterioration at high SNR levels [114]. This scheme has also been used with parallel model combination (PMC) as an alternative to spectral subtraction [31]. As with spectral subtraction, the performance of the method drops signi cantly for SNRs below 10dB, probably due to poor disriminability once lots of HMM means and observations are \masked" [29].
2.2 Robust features Usage of robust features refers to applying a transformation in the rst stage of processing of the speech signal that would (hopefully) result in somewhat \similar" feature vectors both with speech used for training and speech that is to be recognized [96]. This would be possible regardless of the source of the variability. Because the feature vectors won't di�er greatly, the subsequent processing will be the same in both cases. Robust distance measures may be also employed, as the feature vectors will be \similar", but not the \same". The distance measure is very important in the systems based on template matching via dynamic time warping (DTW). It has been shown that using autocorrelation of the signal instead of the signal itself gives signi cant performance gain [53]. This has been applied together with a distance measure operating in the cepstral domain. Another possibility is incorporation of the dynamic features (derivatives) in the input to the system [50] [113].
2.2.1 Perceptual linear prediction
A special form of linear predictive (LP) analysis (all pole modeling of the power spectrum) known as Perceptual LP (PLP) [51] has shown to be e�ective in obtaining noise resistant features. The technique incorporates several well known properties of the human hearing. The critical band analysis is followed by equal loudness pre{emphasis (according to the equal loudness curve) and intensity { loudness conversion before the LP coe�cients are computed. It has been shown that PLP of lower order performs same or better then \ordinary" LP of much higher order.
2.2.2 Relative spectra
For dealing with slowly varying additive and convolutional noise, a method known as representative relative spectra (RASTA) [52] was shown to be e�ective. The idea is to suppress any components in the speech that change more slowly or quickly then the \typical" range of speech change. As PLP, it's also inspired by human audition { human perception tends to respond to a changes of the value of the input, and not the absolute value of the input itself. It's used in conjunction with PLP. The spectral components that are obtained through the lter bank are compressed and ltered (the trajectory over time of the lter bank output is itself ltered) to suppress constant factors in each of them. The last step is all pole model estimation as with PLP. The basic technique, so called lin-log RASTA, operates in log-spectral domain. Filtering 7
the constant/slowly varying components in this domain e�ectively subtracts from the signal the noise convolutional in time domain. However, the noise additive in time domain is not taken care of. As it was shown that high pass ltering the envelope of the bands can be e�ective for additive noise removal [56], RASTA was applied to a domain linear{like for small spectral values and logarithmic{like for large spectral values in order to take care of both kind of noise: convolutional as well as additive. This variant is known as J-RASTA.
2.2.3 Cepstrum mean normalization
Similar e�ect of removing the slow variations out of cepstral features can be accomplished via cepstrum mean normalization (CMN) technique. It simply means calculating the mean of the cepstral features over a word or sentence of speech, and removing (subtracting) the value out of the features. An alternate strategy is to employ speech/noise detector and calculate the mean only over the noisy parts. The subtraction in log-frequency domain removes the e�ect of convolutional noise on the signal. For example, this can be the in uence of the microphone. The technique is easy to implement, very useful and e�ective [105]. Extension of the technique, segmental cepstrum mean normalization (SCMN) incorporates estimation of the variance (in addition to the mean) of each feature and subsequent division of the di�erence between the feature and the mean by the estimated variance [119]. Both RASTA and (S)CMN are also interesting that in essence they allow for comparison of the current features with features from several hundreds of milliseconds ago, thus incorporating information from longer time intervals [84].
2.2.4 Spectral peaks
Most of the methods have implicit or explicit assumption that the noise is additive or, at most, convolutional. However, for much more distorted speech, so called sine { wave speech (SWS), it has been shown that spectral peaks may be features of choice (probably in combination with another features type) for robust speech recognition [7]. SWS is speech produced by time { varying sinusoids to mimic the amplitude and frequency variation of the rst three formants. Some tests on the Resource Management (RM) corpus showed improvement when peaks were used in recognition, regardless if used during the training. Decrease of WER on a discrete { word recognition task was also reported when position and motion of the dominant spectral peaks were incorporated into a conventional Hidden Markov Model (HMM) based system [106]. The system detects peaks on the outputs of auditory lters with automatic gain control (AGC), groups them together into threads and smooth the trajectory by tting it into a second order polynomial. Again, peaks (and their derivatives) are used together with other features (cepstrum coe�cients and their derivatives). Spectral peaks should be particularly robust to additive noise in the log domain, since log(a + b) � log(maxfa; bg).
2.2.5 Modulation spectrogram
Recently features that make use of temporal information in the speech signal that appears as amplitude modulation from 2 to 16 Hz in the subbands after the auditory lter bank were proposed [60]. The so{called modulation spectrogram displays the amplitude modulations at 8
rates from 0 Hz to 8 Hz (with a peak sensitivity at 4 Hz) of the outputs of a auditory lter bank with AGC and peak enhancement mechanism. Improvement was shown on reverbant speech.
2.3 Model adaptation This approach tries to model the mismatch between the training and the testing conditions in the models space. The mismatch itself maybe statistically modeled, and then incorporated it into the recognition process. If the mismatch is due to noise, the noise may be modeled the same way as the speech is. One can make full use of the statistical knowledge about the noise source, without assumptions about the type of noise (additive or convolutional). Because noise model is independent of the speech models, speech models need not be inferred again when the noise source changes. This approach ts well the HMM based systems.
2.3.1 HMM decomposition
In the decomposition of HMMs both clean speech and the noise are separately modeled as a sequence of HMM states. The models for speech and noise are combined in the single model, that allows for transition from the speech states to the noise states and vice versa. During the recognition time, the standard algorithm (Viterbi or forward { backward) searches for the most probable path into the expanded space [115]. The same approach may be used not only for speech and noise, but also for recognition of any two concurrent signals [116]. The drawback of the technique is the computational cost of the search through the expanded state space. Next, in the pre{processing stage, the noise model must be trained, and then updated as it changes. Some of the drawbacks are addressed in the improvements of the technique, where a single global noise model is introduced and more compact representation, i.e. mel{frequency cepstrum coe�cients instead of lterbank, is used [40].
2.3.2 Parallel model combination
Further modi cation and improvement of the technique is known as parallel model combination (PMC) [41] [42] or composition of HMMs [70]. The novelty is to modify the parameters of the clean speech models in such a way so to compensate for the noise in the noisy speech, before the actual recognition. Therefore, there is no expansion of the search space. Only o�{line modi cation of the speech models is required once the noise model has been estimated. The same framework can be used for compensation of \simple" dynamic cepstral features [41] [43] as well as more general case of dynamic cepstral features calculated by regression of any length [123]. Good results have been shown for SNR down to 6dB on a NOISEX-92 database. The method has also been applied in the case where there is an assumption that both the training and the testing data are noisy (opposed to the conventional approach where clean training and noisy testing data is assumed) with di�erent types of noise [72]. Compensation techniques may be extended to cope with several sources of mismatch (background { additive noise, channel compensation, speaker stress) using the same general idea [39]. Another extension deals with compensation for reverbant speech by adding a acoustical transfer function that is inferred from the data [107]. 9
Figure 2.1: Results of the Isolated Digit experiments for various noise robust techniques (reproduced from [29]).
2.3.3 Wiener ltering
The adaptation of the cepstral means using Wiener lters was shown to be somewhat less e�ective then PMC in [117]. However, on the task of isolated words recognition it was reported to achieve results slightly better then PMC [29]. See Figure 2.1 for performance comparison of various robust ASR techniques on the isolated digits task. The e�ect of using cepstral time features together with Wiener lters for adaptation of the models was compared to delta features and PMC in [118]. The results (on the same noise database) were similar to those for PMC.
2.3.4 Speaker adaptation
Mismatch between training and testing conditions because of speaker variability, task variability and other factors that are hard to isolate and exactly model (unlike variability due to noise in the channel) has to be modeled in somewhat more \general" way [37] [63]. Of course, this does not mean that modeling the channel variability this way too is not possible. For speaker adaptation, i.e. modi cation of the models to model a particular speaker better, there are various techniques that make use of speaker dependent (SD) data and adapt the speaker independent (SI) models using small amounts of SD data. In general, there are three 10
strategies for adaptation [125]: batch, where a limited amount of SD data is collected rst and system is adapted next; incremental, where unsupervised adaptation is performed every sentence and the adapted system is used for the next sentence; instantaneous, where the data that is to be recognized is used to to perform the adaptation. The criterion that is optimized (minimized/maximized) may be maximum likelihood (ML), maximum a posterior probability (MAP), the minimal classi cation error (MCE), canonical correlation [124], generalized likelihood ratio test for minimization of the classi cation error for worst case mismatch [78], etc.
2.3.5 Maximum likelihood linear regression
In the ML framework the parameters of the SI models are transformed to SD models in a way to achieve maximum likelihood with the new models on the SD data. The transformations usually are linear regression [97] [4] [77] [104]. In [126] the source of variability is separated into acoustic and phone { speci c and each variation source is modeled by a linear transformation derived form data optimizing for maximum likelihood of the models on the SD data. Instead of using only the model with the highest likelihood, iterative improvement may be performed starting with the weighted sum of the N{best models using some con dence measures [74].
2.3.6 Maximum a posterior probability
The Bayesian framework o�ers a way to incorporate the newly acquired speci c data into the existing models in optimal manner. This is done by optimizing the parameters for maximum a posterior probability (MAP). For HMM based systems, the classical expectation { maximization (EM) algorithms, the forward { backward algorithm and segmental k{means algorithm have been derived [46]. The MAP{based adaptation has been applied to a number of applications like HMM codebook reestimation [103], supervised and unsupervised adaptation [75], in combination with mapping to a new speaker's space [28], for smoothing of the new HMM parameters after the mapping from SI to SD domain [19], etc. In [92] MAP smoothing follows MLLR mapping from N-\closest" training speakers space to the test speakers space.
2.3.7 Minimum classi cation error
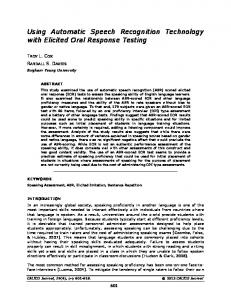
Another approach for model adaptation is to adapt models in a way to minimize the classi cation/recognition error directly [73] [81]. The MCE approach is discriminative training that takes into account all the models and spaces them in the model space in a way that maximizes the distance/minimizes the confusion (classi cation error) between them. In [73] a combination of MAP adaptation followed by MCE was found to perform best on open data when the number of training sentences was small. Combination of ML+MCE performed better then MAP+MCE on closed data as the amount of data increased. This is probably due to over-tuning to the small amount of adaptation data with MCE. It's interesting that for open data, as the amount of data increased, the performance of all four adaptation techniques: ML alone, MAP alone, ML+MCE, and MAP+MCE leveled up (see Figure 2.2).
11
Figure 2.2: \ML+MCE" vs. \MAP+MCE" (reproduced from [73]).
12
Chapter 3
Automatic speech recognition with missing data 3.1 Motivation The problem of sensory occlusion is inherent to any system that attempts to adapt to its environment. There is little doubt that auditory occlusion is handled continually and e�ciently by human audition on several levels. Occlusion of the target source by other sources occurs almost all of the time and listeners deal with it routinely. They also achieve order of magnitude better results then ASR systems on arti cially occluded, band{limited speech. It has been also found that in the early stages of human processing more intense sounds dominate the neural temporal ring rate response, e�ectively making the weaker sounds unavailable for the subsequent stages of the audition. However, it has been demonstrated that the highly redundant nature of speech combats this problem successfully. The main characteristic of the the missing data approach to robust ASR (and the di�erence compared with other known methods) are the following assumptions: � parts of the spectra remain (relatively) una�ected by the noise; � they can be identi ed; � they contain su�cient quantity of information for ASR to be performed. If these assumptions hold, and it is possible to engineer techniques that would produce results (under this assumptions), we'd expect a recognizer that would show graceful performance degradation in case of SNR degradation. So, the two subproblems akin to the application of missing data techniques to robust ASR are: identi cation of the missing or assessment of the unreliable parts of the signal; subsequent classi cation when some components of the observation vector are not observed, or incorporation of the degree of reliability of the observations (if one available) within the classi cation/decision framework. We'll refer to the rst problem as the problem of nding the \mask" of the missing (or present) data. We'll refer to the second problem as the problem of classi cation with missing data. 13
Threshold [dB] Clean 1 97 5 97 9 97 15 97
Global SNR [dB] 20 15 10 5 81 78 79 77 84 74 77 74 93 83 75 78 97 93 84 74
0 69 77 74 74
-5 57 73 78 74
Table 3.1: Accuracy in [%] on clean speech for various \ideal masks". Threshold [dB] Clean 1 97 3 97 5 97 10 97
Global SNR [dB] 20 15 10 5 81 79 79 76 76 75 74 73 62 69 74 69 45 50 61 52
0 69 70 71 56
-5 56 60 62 50
Table 3.2: Accuracy in [%] on noisy speech for various \ideal masks". Classi cation under the same assumptions, but without explicit present/missing separation is also possible. We could try all possible masks, for all possible frames (mask changes each frame), and then use the one that maximizes some criteria, for example the likelihood of the data given the sequence of HMM states. This would require a massive search, and there is a problem that a norm of the likelihood decreases proportionally with the increase of the number of components, but no missing/present separation a-priori is needed. And if we could do full search, the result would be optimal with the respect to the chosen criteria. However, this search seems practically impossible because there are 2#features � #frames combinations.
3.2 Separation/identi cation of reliable/unreliable regions The rst task in the proposed, missing data based general recognition architecture, is to separate speech and non{speech regions. We believe that the way humans do this is by auditory scene analysis (ASA). In analogy with this, computational ASA (CASA) should be able to perform this task. Alternatively, for reasons of computational complexity mainly, we also advocate usage of other schemes (local SNR estimation, spectral subtraction) which would yield to good enough separation for practical application of the proposed architecture for ASR. Table 3.1 and Figure 3.1 show the performance of missing data classi cation on clean speech using class imputation technique (see Subsection 3.3.3) with masks set in a such a way that only the points (in the time { frequency plane) which di�er less then 1, 5, 9 and 13dB (in absolute value) from the corresponding points in the clean speech are retained. The rest are considered to be missing. The task is recognition of TIDIGITS digit strings at various global SNR levels. The noise is Lynx noise, and global SNR ranges from 20dB to -5dB. The column \Clean" contains the results obtained on clean speech. There are 12 digit models, each containing 8 states with mixture 14
Accuracy on clean speech with various ideal masks 100 90 80
Accuracy [%]
70 60 50 40
threshold 1 dB threshold 5 dB threshold 9 dB threshold 15 dB
30 20 10 0 -5
0
5
10 15 Global SNR [dB]
20
Clean
Figure 3.1: Accuracy in [%] on clean speech with various \ideal masks". of 7 diagonal Gaussians per state. Models were obtained with HTK Toolkit. The features used are auditory spectrograms, time { frequency representation comparable to ordinary short{term spectrum. Table 3.2 and Figure 3.2 show the accuracy of the missing data classi cation using the noisy speech for recognition with ideal mask. Because the mask is obtained by comparison of the clean and noisy speech, this is not a full{ own ASR experiment. The aim of this experiment is to shown that our initial assumptions that some parts of the spectra remain su�ciently unchanged, and that ASR is possible using only these parts. Another conclusion that can be drawn is that for recognition of occluded noisy speech there is a tradeo� between the number of points taken into account (being \present") and the ones disregarded (being \messing"). That is, lower the threshold, lower the number of present points, but they are more accurate; higher the threshold, more points are present (taken into account during the classi cation), but they are less accurate (di�er more) compared to the clean speech case.
3.2.1 Computational auditory scene analysis
Computational auditory scene analysis (CASA) deals with computational techniques and implementations for auditory scene analysis (ASA). ASA is concerned with the human ability to segregate/decompose mixtures of sounds that enter our ears into their corresponding constituents originating from the same sources. All of the systems for CASA built so far are inspired by the 15
Accuracy on noisy speech with various ideal masks 100 90 80
Accuracy [%]
70 60 50 40
threshold 1 dB threshold 3 dB threshold 5 dB threshold 10 dB
30 20 10 0 -5
0
5
10 15 Global SNR [dB]
20
Clean
Figure 3.2: Accuracy in [%] on noisy speech with various \ideal masks". framework sketched in [14]. The fact that human speech recognition is remarkably robust makes CASA interesting to ASR researchers. The CASA may act as a preprocessor that would separate the speech that is to be fed to an ASR system from noise. Also, ways for incorporation of the knowledge gained from human audition into robust ASR systems should be sought (the \speech is produced to be heard/recognized" theme). One of the virtues of human ASA is that natural speech signals that have undergone spectro{ temporal occlusions remain remarkably intelligible to humans. Low and high pass ltering [3], band pass ltering, chopping the sound in time domain, etc. have little impact on human recognition. Also, measuring the ring rate and temporal response pattern of the neurons in auditory system it has been found that locally more intense sound components dominate the neural response (the \capture" e�ect). Therefore, weaker sounds are e�ectively masked and thus non{existent for the further stages of speech processing. So, it must be that human audition includes techniques that enable humans to cope with missing data, that occurs naturally and all of the time during the hearing [83]. This observation coincides with the highly redundant nature of speech. In fact, several types of masking have been identi ed experimentally: masking occurring when the masks frequency is close to the frequency of the signal; \central" masking occurring when the signal and the mask are presented to di�erent ears (both presented at the same time in both cases); forward and backward masking occurring when the mask is presented prior or after the signal. The similar problem of occlusion in vision has received some attention [2]. Example of visual occlusion is shown on Figure 3.3. The link between missing data techniques and CASA is that one can assume that given the additive nature of sound, after the allocation of energy in the mixture to particular sources, 16
Figure 3.3: Visual occlusion { see Figure 3.5 for a hint (reproduced from [25]). \holes" will occur in the time { frequency plane sound representation. See Figure 3.4 for example of grouping, segregation and the resulting representation of the speech afterwards, as a result of CASA. The classi cation in the next step has to be therefore performed with evidence that is incomplete (due to the \holes" in representation where sounds other then speech to be recognized were dominant). In [10] a simple CASA utilizing the harmonicity cue was used for separation, and subsequently a matched classi er was selected to perform the classi cation. Alternatives to the CASA plus classi cation with missing data approach are HMM decomposition [115] and parallel model combination [42] (used in context of ASR) where disturbance of every point in the time { frequency plain is taken in account via a probabilistic model of the noise source (essentially the disturbance itself). However, ASA gives us evidence that recognition (at least for humans) is possible when parts of the spectrum are missing (i.e. are dominated by other sources), probably due to highly redundant nature of speech.
CASA systems Several systems for CASA have been built so far [120][24][16][17][35]. In [120] separation of two simultaneous speakers was attempted using the estimated pitch period of the voices and seven state Markov models (corresponding to silence, periodic, non{ periodic, onset, o�set, increasing and decreasing periodicity) for estimation of the power spectrum. In [24] and [16] a architecture known as \bottom{up" or \data{driven" approach is utilized. The speech signal separation is performed in four main steps. In the rst step, the signal is broken in frequency bands according to some model of auditory periphery. Also, some low{ 17
Figure 3.4: The time { frequency { ring rate representation of an utterance mixed with arti cial siren (top); symbolic auditory time { frequency representation produced by [16] (middle); time { frequency representation after grouping and removal of the siren (bottom) (reproduced from [23]). 18
Figure 3.5: Visual occlusion with a hint { compare to Figure 3.3 (reproduced from [25]). level features or \maps" of features like cues for harmonicity, onset etc. are calculated. In the second step discrete objects are created according to the principle of local coherence of low{level features. These object are basic \auditory elements". In the third step, the \auditory elements" are grouped together and marked as coming from a single source on the basis of the Bregman's grouping principles like harmonicity, common amplitude modulation (AM), common frequency modulation (FM), onset and o�set synchrony, continuity, etc. [14]. This is the crucial step that is performed by CASA systems. In the fourth step the internal representation of the groups is converted into some form convenient for assessment of the systems quality. Usually, resynthesis of the sources is performed. In [35] a \prediction { driven" approach is utilized. The system segregates the sounds on the basis of \explaining" the predictions generated by the \internal model" with the acoustic features. This is essentially a search for the most probable hypothesis in the space of possible hypothesis { explanations of the observed evidence. Check Figure 3.5 and compare to Figure 3.3 for analogous example for the case of visual occlusion. Another idea for sound segregation is to employ relatively independent but cooperating agents, specialists for particular task [90]. Agents are created and destroyed by the supervisory agency according to the residual energy in the signal.
3.2.2 Local Signal { to { Noise ratio estimation for separation
The aim of this class of algorithms is estimation of the noise given the mixture of signal and noise. They di�er from most of the speech enhancement algorithms in that they don't assume stationary noise. Therefore, no explicit speech/silence detection is attempted. We're going to 19
pay attention only to algorithms that make use of one sound stream. There are also algorithms that make use of several simultaneous recordings (from several microphones). The Martins's algorithm [71] uses the minimal values of the smoothed power estimate of the speech plus noise mixture to estimate the noise power spectrum. The power is estimated over a rectangular window, and then smoothed by simple rst order recursive formula. Next, the time window of approximately 0.625 sec is divided to few smaller windows, and minima of the smoothed spectrum in each of the windows is determined. If the sequence of the windows minimas monotonically increases, then it is assumed that the noise increases rapidly and the minima of the last window is taken to be the estimate of the noise power. Otherwise, the minimum value of all windows minimas is taken as an estimate of the noise power. It's multiplied by an overestimation factor (from 1.3 to 2, depending on the length of the windows used for power estimation and minima calculation), and is bounded from above by the power of the speech plus noise mixture. The estimator is biased when there is no speech present. Hirsch and Enhrichter [55] propose two algorithms for noise estimation. Both operate on the outputs of the lter bank, in the frequency domain. The rst one calculates weighted rst order average () for each channel separately, on a per{sample basis. When the energy in some channel exceeds a certain threshold (the threshold set to be the last computed average scaled by an overestimation factor of 1.5 to 2.5), it's considered that a speech segment starts there and the recursive computation is stopped. The calculated average so far is taken to be the value of the noise energy at that moment. The second algorithm, also reported in [54], is based on computing the histogram (with roughly 40 bins) of the energy in each subband over a 400ms time window. The values above the threshold are not take into account - they are considered to belong to speech, not noise. The histogram is computed using the values below threshold for each channel separately. The maximum of the distribution is taken to be the value of the noise energy in a particular channel. On the task of noise estimation, the histogram based algorithm shows smaller relative error. Both algorithms have been applied in the context of nonlinear spectral subtraction as preprocessor to an ASR system. The task was isolated word recognition of speech mixed with noise at di�erent SNR levels. Signi cant improvements have been reported, compared to unmodi ed baseline ASR system. The algorithms were augmented by a stochastic speech/pause detector used to adjust the overestimation factor, set to 1 on speech segments and 3 on pauses. A variant of the histogram algorithm is detection of two bumps (modes) in the histogram and estimation of the SNR as proportional to their distance (unpublished). A simulation [79] of the performance of the above algorithms on the task of estimating the noise given the mixture of clean speech and slowly amplitude{modulated noise showed that all perform bad with rapidly increasing noise and better with decreasing noise. In the latter case, the Martin's algorithm performed better then Hirsch's threshold algorithm (the rst one) at SNRs close to zero. All techniques that estimate the noise, take care to bound the noise estimate below the value of the signal plus noise mixture (after multiplication by the overestimation factor). However, when used in context of a system which can perform the classi cation with incomplete data: � the negative spectrum (physically impossible) should be treated as missing; � we can set a threshold (usually 0dB SNR if the features are in log energy domain) and 20
discard features (treat them as missing) where noise is stronger then the speech. In this sense, the local SNR estimation techniques can be used for speech separation.
3.2.3 Spectral subtraction for separation
All techniques for spectral subtraction use noise estimate to obtain the \clean" speech from the mixture (see subtraction 2.1.1 for review). There is always possibility of overestimating the noise and ending with negative spectra for the clean speech which is physically impossible. Therefore, various techniques for non{linear spectral subtraction are employed. However, used in a context of system which can classify or score the incomplete feature vectors, such ad{hoc solutions are not necessary. The negative spectra can be treated as missing and disregarded during the classi cation. This approach was applied in a context of robust speaker recognition in a system with missing data capable classi cator [30]. In this sense, the standard spectral subtraction techniques can be used for separation.
3.2.4 Blind source separation
The problem of blind source separation originally comes form the signal processing eld. It's postulated as the problem of separation (recovery) of the signals produced by several sources from their linear mixture, using higher{order statistics (moments). It's closely related the problem of blind deconvolution, which is of reversing the e�ect of an unknown lter. In blind source separation we typically have N receivers picking up the linear mixture of the N source signals. Recently, the problem was considered from an information theory approach, using maximal transfer of information as a criterion for inference of the parameters of connectionist statistical model [8]. The reported experimental results are encouraging. Latter, the same approach was extended for the case where the sources may have been delayed with respect to each{other [109]. In our case we have the degenerate problem, since only one microphone picks up the mixture we want to separate. It remains to be investigated if blind source separation can be used as a preprocessor for missing data based ASR system.
3.3 Classi cation with missing and unreliable data for robust ASR Missing data techniques for robust ASR have to take into account that the features are going to be only partly observed. Therefore, the models trained on full data should be adapted on frame{by{frame basis (on{line) during the recognition to take into account that only partial, not full, feature vector is available.
3.3.1 Review of techniques for classi cation with missing data
The missing data approach has already been utilized for ASR. In [85][23][22][49] [86] several techniques are discussed for dealing with the problems of missing data approach in the framework of HMM{based ASR system: missing data imputation, class probability imputation, Bayesian optimal classi cation, etc. Results have been reported for (modi ed) HMM{based system, on 21
Figure 3.6: Performance for various missing data strategies { the best one (marked vii) uses 64 channel lterbank output, 5-mix Gaussian mixture models and spectral peaks (reproduced from [85]). a non{trivial RM task with global SNR of 18dB and helicopter (Lynx) noise from NOISEX-92 database (Figure 3.6) [85]. Grateful decrease of performance with up to 80% of the data missing was also reported for random deletion patterns on clean speech (Figure 3.7). The problems with non{random missing data patterns are tied to assumption of diagonal covariance matrixes and independence of the features. This assumption is no longer valid in frequency domain, where the missing data can be identi ed. Therefore, some form of decorrelation has to be sought. Alternatives may include using a global covariance (non{diagonal) matrix, using spectral peaks as features [7] or some form of decorrelation that does not smear the components missing in frequency domain over all features/coe�cients that are used for classi cation. Filtering in log frequency domain maybe used for this purpose [89]. The experiments with low and high{pass ltering (see Figures 3.8) suggest gradual decrease in the performance for missing data based recognizer [67]. Even more, provided that: � it's known in advance what's going to be missing, so the models can be adapted correspondingly (in this case the low and high frequency lter were used, with known cut{o� frequencies); � that there is no contextual information which humans can make use of, and machines can't (in this case nonsense CVC syllables ware used). Under these conditions, performance decrease curves for humans and missing data based recognizer are parallel in shape. It should be taken into account that the human performance is for much harder task of nonsense syllables recognition, while machine recognition is for digits recognition task (perplexity of 6900 vs. 10). In the framework of \unreliable observations" formant features were incorporated successfully into a conventional HMM{based ASR system and decrease of the WER was reported in [45]. Missing feature compensation was also used e�ectively for classi cation after spectral subtraction, 22
Figure 3.7: ASR performance on clean data with random deletions over frequency and time for three data imputation methods and for marginals (class imputation) (reproduced from [85]).
Figure 3.8: Low and high{pass ltering results(reproduced from [66]). to deal in optimal way with the the problem of negative spectra [30]. The task was speaker veri cation in a noisy environment. Although in [2] the problem of missing and unreliable features in vision is investigated, it is relevant for the application of the missing data techniques in speech domain also. The problems of classi cation with missing and unreliable features are postulated. Closed solution for the problem of classi cation with missing data when probability densities are inferred using radial basis function (RBF) network and the missing values are unbounded is given. Closed solution for RBF networks in the case of classi cation with unreliable data contaminated with zero mean, normally distributed noise is also given. The experiments show clear advantage of using the exact solutions (in the case of RBF networks) over the ad{hoc solutions like using the mean values of the missing features or even Monte Carlo sampling for posterior probability density function (p.d.f.) approximated with multilayer perceptron (MLP) and assuming uniform input 23
distribution. The drawback for the application of the RBF based solution in the ASR domain is that the ASR connectionist systems typically use multilayer perceptron (MLP) (instead of RBF network) to infer the class a posterior distributions [101][100]. One solution to the problem of classi cation with missing and unreliable data when the a posterior probability density function is approximated by arbitrary feed{forward network is derived in [112]. The input distribution is approximated using Parzen windows [32]. Another approximation is that the outputs of the networks are constant over the region of the integration over the \width" (variance) of the Gaussians. analytic solution to the missing data integral can be obtained under these assumptions. Comparison of the performance with the solution using RBF networks (method suggested in [2]) shows very similar results (reproduced on Figure 3.10). The drawback for application in the speech domain is that the classi cation approximation calculation goes through all patterns of the training data set (maybe hundreds of thousands for speech training databases) for every pattern with missing features that is to be classi ed. However, the solution does not depend on the number of missing values in the feature vector. The formulas for training the feed{forward networks with back{propagation of error in presence of unknown inputs are also derived. In [15] two approaches to robustness are investigated in the context of a HMM system: � mean value masking { Gaussians that have means smaller then a threshold are considered sensitive to noise and prevented from scoring very low probability scores; � dimensionality reduction { Gaussians with means smaller then a threshold are ignored. The second technique is reported to give better results. It's equivalent to putting a default missing data mask to every Gaussian in the mixture. Interestingly, the rst technique has motivation similar to [26]: preventing extremely low scores. For sonorant sounds, results similar to PMC without utilizing explicit noise model were reported. Since the scores are used in the Viterbi search, an extremely low score for some state would automatically discriminate against all paths that pass through that state. The model that owns the state would then loose regardless of the scores of the other states, since that particular state scored extremely low. In order to control the damage, an acoustic back{o� scheme is devised in [26]: the state distribution is bounded by how low it can score. There is a certain analogy with the multigram language models, where certain probability mass is reserved for the typles never seen in the training data. Assigning probability zero to the unseen typles would rule out any possibility of recognition, regardless how big the acoustic evidence for recognition is. This is also connected with the well known problem of \outliers" in statistics. This problem occurs when the data sample from which the distributions are inferred (learned) is not representative enough. Therefore, points that were very rare in the training sample will score extremely low probabilities. Di�erence of many orders of magnitude between the \ordinary" points and \outliers" in the data space maybe poor model of the real world. Again, ad{hoc schemes for damage control have to be sought. Reserving certain probability mass for low{frequency points (and thus establishing a lower bound for the probability of the \outlier") is one common technique. Experimental results in [26] show big improvement when used in a context of arti cially induced \disturbance" of the coordinates. However, we were not been able to get any improvement when performing acoustic back{o� on the top of class imputation with missing data (subsection 3.3.3). 24
Missing data maybe reconstructed independently of the speech recognizer [98][34]. Once reconstructed, now complete data can be fed to the recognizer which need not be changed at all. This approach is very attractive, and it has already been tried (see section 2.1 on speech enhancement) The di�erence is that the same techniques that are largely used for recognition (like clustering and modeling the data distributions as mixtures of Gaussians) are now used for reconstruction of the missing features. In [98] the input data is clustered, and the cluster with maximum score for the present data is used for lling in the missing values. Another technique used is a priori correlations between the missing features and the most highly correlated present features. The correlations were derived form the uncorrupted speech database. In [34] the global data distribution is estimated, and the means and the covariances of the distribution are used for prediction of missing values given the present ones.
3.3.2 Recognition with missing data
There are two strategies for classi cation with missing data: � classi cation using the models and the present data (and maybe same additional knowledge about the missing data { we'll refer to this approach as to \class imputation"; � data imputation (completion, \prediction" of the missing values) using the models and the present data and subsequent classi cation using the whole data vector. Both approaches use the same information { the models inferred during the training and data present, and therefore, there is no inherent advantage of using either of them over the other one. However, other factors may give advantage to one or the other. Furthermore, the assessment on the unreliable portions of the data and subsequent classi cation can be approached two ways: � using the missing { present paradigm, i.e. \hard" separation in all{or{nothing manner; � using some measure of reliability of the observations and incorporating it into the classi cation. In the rst approach, some of the CASA systems (subsection 3.2.1) or some local SNR estimation technique (subsection 3.2.2) will be used to separate the noise and the speech, thus leaving holes in the speech spectra. The advantage of this approach is greater simplicity The second approach tries to avoid hard decision of partitioning the data from the speech signal into present{missing, in all{or{nothing fashion. Instead, some measure in reliability is sought. The drawback is that we have additional problem of how to measure the degree of reliability of the features and incorporate this into the recognizer. At present, it's not clear if treating the data as unreliable, instead of missing would yield any improvement. First experiments (compare \ss adaptive + MUP" with the other two techniques on Figure 3.9) show that the performance is the same. Table 3.3 and Figure 3.9 show the performance of various techniques used so far. The experiment assesses the accuracy of the recognition on strings of digits on the TIDIGITS database using di�erent missing data techniques. The noise is Lynx noise. Speech and noise is mixed at various global SNR levels, from 20dB to -5dB. The column \Clean" contains the results obtained 25
on clean speech. There are 12 digit models, each containing 8 states with mixture of 7 diagonal Gaussians per state. Models were obtained with HTK Toolkit. The features used are auditory spectrograms, time{frequency representation comparable to ordinary short{term spectrum. Global SNR [dB] Clean 20 15 10 5 unadapted system 97 71 58 39 22 ss + MD 97 94 90 76 48 ss adaptive + AI 94 96 92 80 58 ss adaptive + LDI 90 96 93 82 63 ss adaptive + MUP 94 97 92 79 58 Technique used
0 12 19 28 36 31
-5 7 13 15 13
Table 3.3: Accuracy in [%] for various missing data techniques. In all case spectral subtraction is performed prior to recognition. If the method fails and we end up with negative spectra, the value is considered to be missing (see subsection 3.2.3). The \unadapted system" is for our baseline system with no modi cations. The \ss + MD" row is for using class imputation only (see subsection 3.3.4). The \ss adaptive + AI" row is for using class imputation with auditory induction technique (see subsection 3.3.4). The \ss adaptive + LDI" row in the table is for using the states distributions for local data imputation of the missing features (see subsection 3.3.8). The \ss adaptive + MUP" row refers to using the missing/uncertain/present paradigm for class imputation (see subsection 3.3.11). Data where adaptive spectral subtraction fails is considered missing, and where it succeeds but the SNR is lower then a threshold is considered uncertain. On Figure 3.9 the results obtained using the \ideal" mask (see section 3.2) are also plotted for comparison.
3.3.3 Classi cation with missing data using class imputation
The problem of classi cation with missing data using class imputation can be formulated as follows: the likelihood f (~xjS ) or posterior distribution P (C j~x) was inferred during the training. During the recognition, the input vector ~x = (~xp ; ~xm ) is partly present { the ~xp part, and partly missing or unreliable { the ~xm part. We want to compute the likelihood/posterior probability using the present data ~xp, i.e. f (~xp jS ) or P (C j~xp )1 .
3.3.4 Class imputation within the HMM framework
When used in context of a HMM system, we'd like to compute the likelihood of the present data ~xp being generated when we are in a particular state S . That is, we want to compute f (~xpjS ) [85]:
Z
Z
f (~xpjS ) = f (~xp; ~xm jS )d~xm = f (~xjS )d~xm : 1
In this notation,
P (�) is probability, and f (�) is probability density function { p.d.f.
26
(3.1)
Accuracy of various missing data techniques 100 90 80
Accuracy [%]
70 60 50 40
unadapted system ss + MD ss_adaptive + AI ss_adaptive + LDI ss_adaptive + MUP noisy data + ideal mask 1dB thr + MD
30 20 10 0 -5
0
5
10 15 Global SNR [dB]
20
Clean
Figure 3.9: Accuracy in [%] for various missing data techniques. Assuming that f (~xjS ) is a multivariate Gaussian p.d.f., f (~xp jS ) as a marginal distribution is itself multivariate Gaussian. But, the actual computation is computationally expensive, since it involves matrix inversion. This needs be performed each frame for all states of all models. However, if we assume that f (~xjS ) is a mixture of diagonal (even spherical) Gaussian components f (~xjk; S ) (where k is the index of the mixture component) with weights P (kjS ) ([11], pp. 59): X X Y f (~xjS ) = P (kjS )f (~xjk; S ) = P (kjS ) f (xi jk; S ); (3.2) for f (~xpjS ) we'll have:
k2mix
k2mix
f (~xpjS ) = = = = =
i2features
Z f (~xp; ~xm jSi )d~xm ; Z X Z X
k2mix
P (kjS )f (~xp ; ~xm jk; S )d~xm ; P (kjS )f (~xp jk; S )f (~xm jk; S )d~xm ;
Z P (kjS )f (~xp jk; S ) f (~xm jk; S )d~xm ; k2mix {z } | 1 X k2mix
X
k2mix
P (kjS )f (~xp jk; S ): 27
(3.3) (3.4)
Although in f (~xp; ~xm jS ) missing and present components are not independent, and can not be separated (factorized), inside the components of the mixture f (~xp; ~xm jk; S ) they are independent, and can be separated as f (~xp ; ~xm jk; S ) = f (~xpjk; S )f (~xm jk; S ). We can use, in the same way, every p.d.f. which can be expressed as nite sum of factorizable distributions. With Eq. (3.4) we do not need matrix inversion for computing the marginal (contrary to marginal in Eq. 3.1). Therefore, it's computationally feasible for our intended application. Instead of inversion, since the components of f (~xp; ~xm jk; S ) are independent in the mixture, we can simply disregard the ~xm components and obtain f (~xpjk; S ) easily.
Auditory induction
In the case of speech signals, the observations don't really disappear/go missing { they are always observed. Instead, after the separation, we have portions of the spectra which were grouped as non{speech. Most commonly, this features are in frequency or log{frequency domain, and we assume additive noise. This means that the energy of the speech signal there was between zero and the observed value of the mixture (speech plus non{speech) ~xo . Therefore, the range of possible values of the missing features is known to be bounded in the [0; ~xo ] region [85]. In fact, by completely disregarding observed values, there is a danger that a model with an energy higher then observed value ~xo might win, as it's not penalized at all, although we know that the speech energy there must be less then ~xo Taking this into account would mean that in Eq.( 3.3) the domain of integration over the missing values isn't (?1; +1), but [0; ~xo ]:
f (xpjS ) = =
Z ~xo 0
X
f (~xp ; ~xm jS )d~xm ;
k2mix
P (kjS )f (~xp jk; S )
X
Z ~xo 0
f (~xmjk; S )d~xm ;
(
)
?~� ~x ? �~ = 0:5 P (kjS )f (~xpjk; S ) erf ( pu mjk ) ? erf ( p mjk ) ; 2 ~�mjk 2 ~�mjk k2mix
where erf (x) is de ned as:
Zx 2 erf (x) = p� e?t dt: 2
0
(3.5)
(3.6)
The experiments con rmed that this is consistently a bit more precise then using the pure marginal (Eq. (3.4)). However, the gain is modest, at the expense of signi cantly more computations (see Table 3.3 for comparison).
Using the expected likelihood
Alternative to computing likelihood of the present data ~xp being generated by the state S , f (~xp), may be to compute the expected likelihood E~xm j~xp ;S ff (~xjS )g: Z Z 1 E~xmj~xp ;S ff (~xjS )g = f (~xjS )f (~xm j~xp; S )d~xm = f (~x jS ) f 2(~xjS )d~xm : (3.7) p 28
Intuitively, this is simply the average of all possible likelihoods for a particular state S . We can imagine this as lling in the missing data ~xm with all the possible values, obtaining the likelihood f (~xjS ) in each instance, weighting that likelihood with the possibility of that particular values for ~xm actually occurring, and summing all this weighted scores over all of the domain space of ~xm. The product (square) of a Gaussian(s) is a Gaussian itself, so, this integral can be computed in closed form. Furthermore, if we assume mixture of diagonal covariance Gaussians form for f (~xjS ) the calculation is computationally feasible. However, at present, it's only a speculation if the expected likelihood can be used as a measure of the probability of the incomplete vector being generated by a particular state. It's often the case that the average of some \meaningful" values is not always \meaningful" itself.
3.3.5 Class imputation with arti cial neural networks as posterior estimators
The arti cial neural networks (ANNs) can be trained in a way that outputs of the network yi approximate posterior distribution of the class, i.e. yi � P (C j~x) [11]. Since the complete vector ~x is not available, we'd like to estimate the posterior on the basis of the available information ~xp. So, we want to compute P (C j~xp ). Class posterior P (C j~xp) [2] [85] [86] [11] can be expressed as: R f (C; ~x ; ~x )d~x f ( C; ~ x ) p m m; p P (C j~xp ) = f (~x ) = R f (C;p ~x)d~x R fP(~x(Cp)j~x)f (~x)d~x m= m: R = (3.8) f (~xp ) f (~x)d~xm The posterior P (C j~x) and the normalization factor f (~x) are inferred during the training. The integral in the numerator needs to be computed. The marginal integral in the denominator is not class dependent, so, it doesn't a�ect the decision and need not be computed. Another form for Eq. (3.8) is: R P (C j~x)f (~x)d~x Z P (C j~x)f (~x)d~x m= m; P (C j~xp) = f (~xp) f (~xp) Z Z f ( ~ x ) = P (C j~x) f (~x ) d~xm = P (C j~x)f (~xm j~xp )d~xm : (3.9) p
The form of Eq. (3.9) is very intuitive. It simply states that the estimate of the posterior on the basis present data P (C j~xp ) is average of the posterior on the full data, over all possible completions of the missing values, each weighted by the prior probability of this values occurrence in the rst place. This is the expectation of the posterior over the missing values E~xm j~xp fP (C j~x)g:
Z
E~xm j~xp fP (C j~x)g = P (C j~x)f (~xm j~xp)d~xm :
(3.10)
So, for ANNs, the class posterior (the output of the network) given the present data P (C j~xp ) is equal to the expected posterior over the missing data E~xm j~xp fP (C j~x)g: P (C j~xp) = E~xmj~xp fP (C j~x)g: (3.11) This is not the case with the likelihood (subsection 3.3.4). 29
Gaussian Basis Functions (GBF) network based posterior estimator Let's assume that GBF network has been trained on the complete data [2]. The network output yi(~x) is: P w b (~x) ij j j (3.12) yi (~x) = P b (~x) ; j
j
where
bj (~x) =
? P (xi2?��2ji )
�j
e Q (2�) �kj d d 2
i
ji
2
;
(3.13)
k
and wij is the weight from the j 'th basis unit to the i'th output unit, �j is the probability of choosing unit j and d is dimensionality of ~x. P The GBF network can be trained in a way that yi (~x) � P (Ci j~x) and f (~x) � j bj (~x). Then, the integral (3.8) becomes: P w b (~x ) ij j p j (3.14) P (Ci j~xp) � P b (~x ) ; j
j p
where bj (~xp ) is the marginal of the Gaussian bj (~x) (evaluated only over the known dimensions). This closed solution allows e�cient calculation of the missing data integral. It's easy to see that there exists a certain dichotomy between the RBF networks and the HMMs. Indeed, since both use Gaussians p.d.f. estimation, the Eq. (3.14) is analogous to Eq. (3.1). We have the same computational problem if Gaussians in the RBF network are not diagonal. If diagonal, then the whole RBF network is one big mixture of many Gaussians, and thus analogous to Eq. (3.4). In fact, the only di�erences between the GBF network and the mixture of Gaussians used for the HMM states is the way they are trained/parameters of the distributions inferred. At rst, it seems that RBF networks have inherent advantage, since: � the training is discriminative { i.e. the network is trained on the whole training data set (as opposed to the distribution of the HMM state is which is inferred only from the data found to originate/have been \emitted" from this particular state with segmentation); � all Gaussians are shared across all output units, improving robustness. However: � discriminative training schemes are also available for the HMMs; � Gaussians sharing is also possible, and almost always used for full blown large vocabulary ASR systems (tying of the parameters). 30
Furthermore, the training of big RBF networks can be inconvenient, and the results are not as good as with MLPs [100]. One of the reasons might be that in rst stage (obtaining the parameters of the Gaussians) the training is non{supervised, and many spurious Gaussians are allocated to model data which may turn out to be irrelevant [11].
Multilayer perceptron (MLP) posterior based estimators
Now, let's assume that any kind of neural network has been trained on the data (all derivations for this case taken from [112]). The training data consists of N data tuples f(xk ; yk )jk = 1; : : : ; N g. The network output NNi (~x) approximates the a posterior P (Ci j~x), i.e. NNi (~x) � P (Ci j~x). The density distribution f (~x) of the input data ~x is in this case unknown. However, it can be approximated by Parzen windows [32]:
f (~x) � N1 where G(~x; ~xk ; �)
N X k=1
G(~x; ~xk ; �)
(3.15)
is a Gaussian centered at data point ~xk : (3.16) G(~x; ~xk ; �) = 1 2 d exp (? 2�1 2 jj~x ? ~xk jj2 ); (2�� ) if the variance � is appropriately scaled. The denominator f (~xp) in the missing data integral (3.8) can also be approximated with: 2
f (~xp ) � N1
N X k=1
G(~xp; ~xkp ; �);
(3.17)
where G(~xp; ~xkp ; �) is the marginal of G(~xp ; ~xkp ; �) obtained by integrating (leaving) out unknown dimensions. Therefore, the missing data integral (3.8) becomes:
P (C j~xp) � P N
k=1
Z
1
G(~xp ; ~xkp ; �) 1
NN (~x)[
N Z X
N X k=1
G(~x; ~xk ; �)]d~xm ;
� P NN (~x)G(~x; ~xk ; �)d~xm : N G(~xp ; ~xkp ; �) k=1
(3.18)
k=1
If we assume that the network prediction is constant over the \width" of the Gaussians, the
NN (~x) gets out of the integral and the integral cancels out the missing data dimensions of G(~x; ~xk ; �) reducing it to G(~xp; ~xkp ; �). Therefore we have: P (C j~xp) �
PN NN (~x ; ~xk )G(~x ; ~xk ; �)
k=1
p m
p p
N P G(~x ; ~xk ; �)
k=1
31
p p
(3.19)
Figure 3.10: Performance of missing data classi cators: feed{forward networks closed solution (continuous line) [112]; RBF networks closed solution (dashed line) [2]; missing input mean substitution (dotted line) (reproduced from [112]). The expression NN (~xp ; ~xkm ) simply means that this is the output of the network obtained feeding the present components of the observation data vector and missing components from the k{th training pattern. Therefore, in order to evaluate the missing data integral, we need to go through all patterns from the training set. The comparison of the two methods on the same classi cation task shows similar performance for both methods (Figure 3.10). Computing the posterior probability P (C j~xp ) by going through whole training set is impossible with the training sets typically used in ASR task. Instead, some form of clustering or semiparametric density estimation (mixture of Gaussians, for example) of the input data in the training set maybe employed. Then, instead of using the complete training set during the recognition, centroids of the clusters (means of the mixtures) maybe used in the sum (3.19). Similar approach (but not in the context of connectionist system) was used in [98]. In general, when estimating a posterior distributions for MLPs given present data P (C j~xp ), we have the problem of estimating the input distribution f (~x) that is inside the integral (3.8) (in the RBF case the input distribution f (~x) is also estimated during the training). Therefore, ways for estimating f (~x) have to be sought. One possible solution is outlined in the previous 32
paragraph (using mixture of Gaussians instead of Parzen windows) for the data distribution. In fact, this approach to f (~x) estimation has already been reported but in the context of missing data reconstruction [98][34].
Using the expected outputs of the hidden units of the MLP
We also investigated an alternative approach for the case of MLPs, which uses multidimensional integral of the sigmoid transfer function for the hidden units (derived in Appendix A). Being unable to compute the expected output of the ANN (integral in the Eq. (3.9)) analytically, we tried to compute the expected output of each hidden unit of the ANN E~xm j~xp fOh g:
Z
1
f (~x j~x )d~x ; (3.20) 1 + e?w~ T ~x m p m where w~ are the weights from the input units to this particular hidden unit. The motivation is that once we compute the expected outputs of the hidden units, we can than use this values instead of the \true" values of the hidden units (which can not be computed because some of the inputs are unknown) as inputs to the units of the output layer. There is also a hint in [11] (pp. 226) that the outputs of the hidden units maybe treated as posteriors of a quasi{classes given the features. However, since the input distribution is unavailable (unless estimated additionally), we assumed that: � the components of the input vector are mutually independent, i.e. f (~xmj~xp) = f (~xm); E~xm j~xp fOh g =
� the missing features are bounded in some interval [~a; ~b]; � the distribution of each (independent) feature is uniform in between the bounds.
Since all of the input data is usually \normalized" (unconditional mean subtracted and result divided by double variance), the bounds are fairly good assumption. However, the independence and the uniformity of the data assumptions is far from reality. Under the above assumptions, the expected output of the hidden unit is:
E~xmj~xp fOh g =
Q
Z 1 1 (bm ? am ) 1 + e?w~ T ~x ~xm : ~b
m2missing
~a
(3.21)
Using the Eq. (A.14) (Appendix A) we can compute this integral. However, rst results obtained of the experiments on TIMIT vowels classi cation task do not show any advantage in using this method over unconditional mean imputation.
Integrating over the MLP transfer function \When inputs are passed through the sigmoid transfer function, maximum information transmission can be achieved when the sloping part of the sigmoid is optimally lined up with the high density parts of the inputs" [8]. This may mean that if we train the network so that units 33
maximize information ow, the distribution of the input data will be encoded in the hidden layer weights. If the contributions of the hidden units are local, then, we could obtain the input data distribution from the hidden layer weights. In that case, there is a possibility to try to solve the integral in Eq. (3.8).
3.3.6 Incorporating additional knowledge in the classi cation
If there exists any knowledge ~�m about the missing data (need not necessarily be the bounds), it can be easily incorporated into the classi cation framework [85]: ~xp ;~�m ) = f (~�m jC; ~xp )f (C; ~xp) ; P (C j~xp;~�m ) = f f(C; (~�m ; ~xp ) f (~�m ; ~xp ) = f (~�m jfC;(~�~xpj)~xP ()Cf (j~x~xp))f (~xp) ; m p p = f f(~�(~m� jC;j~x~x)p ) P (C j~xp ): (3.22) m p
Interpretation is straightforward - our estimate when no additional knowledge is present P (C j~xp ), xp ) needs to be corrected by a factor ff(~�(~�mmjC;~ j~xp) . The denominator f (~�m j~xp ) is a normalizing constant (sum of corrections over all classes), to make all the corrections sum to unity.
3.3.7 Classi cation with missing data using missing data imputation
The problem of classi cation with missing data using data imputation can be formulated as follows: the likelihood f (~xjS ) was inferred during the training. During the recognition, the input vector ~x = (~xp ; ~xm ) is partly present (the ~xp part), and partly missing or unreliable (the ~xm part). Instead of unknown ~xm, we want to compute some \suitable" values ~x^ m, given the models f (~xjS ) and present data ~xp . Then we would use ~x^ = (~xp ; ~x^m ) instead of ~x, and proceed with classi cation as no data is missing. Since we have to generate data, this approach makes sense only in the context of HMMs. We can apply this approach in two ways. One is to use each state's distribution f (~xjS ) to impute the values for ~xm . So, for each frame we'll get as many versions of the frame as the number of states. However, during the Viterbi state alignment, when estimating the probability that a particular frame was generated by a particular state, we need not score all frames. We can compute the score only for the frame whose values were imputed by that particular state in the rst place. So, the search space and the complexity of the search do not increase at all, and, apart for the computation of the expected values, no additional computational cost is incurred. We'll call this technique local data imputation (LDI). If we don't want to change the classi er at all, we can infer the clusters in the data (in addition to ASR system training), and then, during the recognition chose the cluster with maximum f (~xp) and impute the data using that particular clusters distribution. This approach is used in [98]. The second approach is to try and impute only one version for ~xm . We can either use the states distributions f (~xjS ) (if ones available) to get the data distribution f (~x). Or if the state distributions are not available (typically if a hybrid system is used with ANN as scaled 34
likelihood estimator), we can estimate the data distribution f (~x) separately [34] and then obtain the conditional distribution f (~xm j~xp ). We'll call this technique global data imputation (GDI).
3.3.8 Local data imputation
One suitable value for ~x^m may be the expectation (mean) with regards to conditional distribution f (~xmj~xp; S ). The other reasonable candidate, the mode, is hard to compute. The conditional distribution is: (3.23) f (~xmj~xp ; S ) = f (f~x(m~x; ~xjSp j)S ) p
where f (~xpjS ) is the marginal distribution, and the expectation is:
E~xm j~xp;S f~xm g =
Z
f (~xmj~xp ; S )~xm d~xm ;
Z (3.24) = f (~x1 jS ) f (~xm ; ~xp jS )~xm d~xm : p However, as in Eq. (3.1), computing this form for any type of Gaussian distribution is computationally prohibitive for practical number of states because of the necessity for matrix inversion for each state for each frame. Again, assuming diagonal (even spherical) Gaussian mixtures for f (xjS ): f (~xjS ) =
X
k2mix
P (kjS )f (~xjk; S );
(3.25)
we have for the conditional distribution: f (~xmj~xp; S ) = f (f~x(m~x; ~xjSp j)S ) ; p X 1 = f (~x jS ) P (kjS )f (~xp ; ~xm jk; S ); p
= = where:
k2mix
X f (~xpjk; S )P (kjS ) f (~xmjk; S ); f ( ~ x j S ) p k2mix X
k2mix
P (kj~xp ; S )f (~xm jk; S );
P (kj~xp ; S ) = P (kjSf ()~xf (j~xSp)jk; S ) ; p
35
(3.26)
(3.27)
is responsibility, and the marginal f (~xp jS ) is:
f (~xpjS ) = = = =
Z
f (~xjS )d~xm =
Z X
Z X k2mix
P (kjS )f (~xjk; S )d~xm ;
P (kjS )f (~xp jk; S )f (~xm jk; S )d~xm ;
Z P (kjS )f (~xp jk; S ) f (~xmjk; S )d~xm ; k2mix {z } | 1 X k2mix
X
k2mix
P (kjS )f (~xp jk; S ):
(3.28)
The trick is that since the components of the mixture are diagonal Gaussians, the features of the feature vector ~x are independent in the distributions inside the mixture (i.e. the distributions of the mixture are factorizable) and f (xi ; xj jk; S ) = f (xi jk; S )f (xj k; S ) holds. This are very convenient forms, both for the marginal and the conditional distribution { we started with and ended with mixture of Gaussians. For the conditional distribution the weights have changed. Now, for the expected value of ~xm we have:
E~xmj~xp;S f~xm g = = = =
Z f (~xmj~xp; S )~xm d~xm; Z X k2mix
X
k2mix
X
k2mix
P (kj~xp ; S )f (~xm jk; S )~xm d~xm ;
Z |
P (kj~xp ; S ) f (~xm jk; S )~xm d~xm ;
P (kj~xp; S )~�mjk;S :
{z
�~ mjk;S
}
(3.29)
This is computationally cheap to calculate. The responsibilities can be computed as in Eq. (3.27), and by ~�mjk;S we denote the mean of the k{th component of the state S. After we impute these values, we can proceed with the Viterbi search during the recognition. However, instead of one frame with data, we have as many frames of data as there are states in the HMM now. There are two possibilities: � for each frame, for each state, score all possible versions of that frame; � for each frame, for each state, score only the version of the frame whose missing values were imputed using the distribution of this particular state. We took the second approach with satisfactory results. This is an order of magnitude computationally cheaper, compared to the rst one. Comparison with the other missing data techniques shows similar results (see Table 3.3). Main attraction over other missing data techniques is that once the input vector is completed, 36
any convenient transformation (like discrete cosine transform { DCT) can be applied. If we have two sets of models inferred from the same data, one set trained on the spectral data, and the other one on the same data after DCT transformation, i.e. models trained on cepstral data, we can use the state distributions of the spectral models to impute the missing data, apply DCT and then use cepstral models for the recognition.
3.3.9 Global data imputation
One suitable value for ~x^m may be the expectation (mean) with regards to conditional distribution f (~xmj~xp):
Z
E~xm j~xp f~xm g = f (~xmj~xp )~xm d~xm :
(3.30)
In the case of f (~x) being estimated via mixture of diagonal Gaussians, we can use the same forms as Eq. (3.26), but disregarding conditioning on the state S . Therefore, we'll consider here the case when f (~x) is expressed using the states distributions. In that case, for the conditional distribution f (~xm j~xp) we have:
f (~xm j~xp ) = = = = =
X
f (~xm; S j~xp ) =
X
f (~xmj~xp ; S )f (S j~xp ); all S X f (~xmj~xp ; S ) f (~xpfj(S~x)P) (S ) ; p all S
all S
X
all S
f (~xmj~xp; S ) Pf (~xpjSf)(P~x(S; S) 0 ) ; all S 0
p
X f (~xmj~xp ; S ) P f (~xfpj(S~x)PjS()SP) (S 0 ) ; 0 all P S f (~x j~x ; S )allf (~xS jS )Pp(S ) p all SP m p : f (~x jS )P (S ) p
all S
(3.31)
The prior probability of the state S , P (S ), is somewhat puzzling. There exists a probability of being in a particular state at a particular time, P (S t ). We can then calculate the expected number ENS of discrete time steps that we're going to be in a particular state S , and obtain NSi the required P (S ) as P (Si ) = Pj2allSt: NSj . For the case of strictly left{to{right HMMs, with no skips, with probability p for staying in the same state and 1 ? p for moving into the next state, and thus probability that once in a state, we'll remain there for the next n time steps of pn(1 ? p) (for n � 0), the expected number of times we'll stay in a state S (once we're in) is:
E fNS g =
1 X
n=0
npn(1 ? p) = 1 ?p p :
(3.32)
Again, assuming diagonal Gaussian mixtures for f (xjS ) (Eq. (3.25)) and taking into account the marginal f (~xpjS ) (Eq. (3.28)) and conditional f (~xm j~xp ; S ) (Eq. (3.26)) distributions for this 37
case, we have for the expectation E~xm j~xp f~xm g: Z allPS f (~xmj~xp; S )f (~xpjS )P (S ) P f (~x jS )P (S ) E~xm j~xp f~xm g = ~xm d~xm;
P
= =
all S
p all S R f (~xpjS )P (S )
f (~xmj~xp ; S )~xm d~xm P f (~x jS )P (S ) ; p
all S P � P P (kjS )f (~x jk; S )� P (S ) R � P P (kj~x ; S )f (~x jk; S )� ~x d~x p p m m m all S k2mix k2mix � � ; P P P (kjS )f (~x jk; S ) P (S ) p
all S k2mix
=
=
~�mjk;S }| { z � � Z P P P (kjS )f (~x jk; S ) P (S ) P P (kj~x ; S ) f (~x jk; S )~x d~x m m m p p k2mix all S k2mix � � ; P P P (kjS )f (~x jk; S ) P (S ) p all S k 2 mix � P P�P all S k2mix
P (kjS )f (~xp jk; S ) P (S )
k2mix �
P (kj~xp ; S )~�mjk;S
P � P P (kjS )f (~x jk; S ) P (S ) p
:
(3.33)
all S k2mix
The imputed value ~x^ m can be computed this way, and afterwards we can proceed with the classi cation as with complete vector ~x^ = (~xp ; ~x^m ) instead ~x. Some preliminary experiments with GDI showed performance worse then LDI, but more extensive experiments are yet to be performed.
3.3.10 Classi cation with uncertain data using class imputation 3.3.11 Class imputation with uncertain data within HMM framework
An attempt was made to model the uncertainty that arises after the separation of speech and noise in the rst stage of the robust recognizer. Namely, the non{CASA based techniques try to estimate the noise portion in the mixture, and then the noise is subtracted in the frequency domain to obtain the \speech only". So the spectral features we use after the subtraction represent \clean" speech portion in the mixture to the extent that noise estimation is correct. Being aware that the noise estimation always fails, we can treat the spectral features we get as true values with added zero mean Gaussian noise with variance that depends on the estimated SNR. We used linear relation (higher SNR, lower variance) and it was not particularly dependent on the linearity factor. Thus, the means and variances of the state distributions f (~xpjS ) were updated accordingly to handle this \uncertain data" situation. The spectral components where the SNR estimation method failed were used as missing (the standard procedure we used in all experiments). The experiments (Table 3.3 and Figure 3.9) 38
show no improvement was obtained.
3.3.12 Class imputation with uncertain data using arti cial neural network as a posterior estimator The problem of the recognition with uncertain (noisy) features is as follows: class a posterior probability function P (C j~x) was inferred from the data ~x during the training. These observations were all certain - i.e., clean speech. During the recognition time, when a values ~xu are observed, there is a degree of uncertainty associated with the observation. What is the class a posterior probability P (C j~xu )? The class a posterior P (C j~xu ) can be expressed as [2]:
R
R
~xu ) = Rf (C; ~xu ; ~x)d~x = fR(~xu jC; ~x)f (C; ~x)d~x ; P (C j~xu ) = f f(C; x f (~xuj~x)f (~x)d~x R f((~x~xu)jC; ~x)P (Cf (j~x~x)uf; ~x(~x)d~ Ru f (~x j~x)f (~x)d~x )d~x : = (3.34) u (note that where as previously ~x was the "whole" vector in the observation space, and ~xp and ~xm were it's components, now the dimensionality of ~x and ~xu is the same) The a posterior distribution P (C j~x) is inferred during the training. The denominator is the same for all classes, so doesn't a�ect the decision. The f (~xu j~x) term is unknown. It links the (clean) training data and the recognition (noisy) observations (and the SNR estimation) and is di�erent for every class. It can be interpreted as the probability density that we might observe particular value ~xu when the \underlying", \true" value was ~x. Classi cation with missing data may be assumed as a special case of classi cation with uncertain data, when the variance of the uncertain data goes to in nity. In order to solve the integral in the numerator, typically an assumption may be made that the distribution f (~xuj~x) linking uncertain observations and clean data is either assumed to be of Gaussian form, or either uniform in some interval. This estimate may be modeled as dependent on the measure of the quality of the speech signal (SNR, for example).
Class imputation with uncertain data using GBF network as a posterior estimator P In the case when a GBF network is trained in a way that yi (~x) � P (Ci j~x) and f (~x) � j bj (~x) (see subsection 3.3.3) and assuming uniform noise in some interval [~a; ~b], the uncertain data integral (3.34) can be expressed as [2]:
P w b (~x) Q[G(b ; � ; �2 ) ? G(a ; � ; �2 )] ij j i ij ij i ij ij j i P Q P (C j~xu ) � b (~x) [G(b ; � ; �2 ) ? G(a ; � ; �2 )] j
j
i
i ij ij
i ij ij
(3.35)
where �ij and �ij2 are i'th component of the j 'th mean and variance vectors, and i goes through all components. This form can be computed. 39
In similar case, but under assumption that noise is Gaussian with zero mean and variance
�n2 (instead of uniform noise) the closed form solution is:
P w b0 (~x) ij j ; p(cj~xu ) � jP 0 b (~x) j
j
(3.36)
where 2 )bj (~x): b0j (~xu ) = G(~xu; �jn; �n2 + �jn
(3.37)
This closed form solution can be calculated.
Class imputation with uncertain data using MLP as posterior estimator
The similar reasoning that leaded to Eq. (3.19) can be applied for the case of uncertain data when a posterior probability is approximated by arbitrary neural network. We can assume that input distribution is approximated by Parzen windows, that noise is either uniform or normal, and that the output of the network is roughly constant in the \width" of the Gaussian(s). In both cases (noise uniform and noise normal), under this assumptions, the integral can be solved in closed form, leading to form similar to Eq. (3.19). However, this is still not applicable on the ASR task, as for calculation of the class a posterior or every frame during the recognition, all training tuples need to be scanned. Basically, every consideration about estimation of the input distribution f (~x) in the case of missing data still holds. And, in addition, we have to consider modeling the f (~xu j~x) and f (~xuj~x; C ). Typically, we would consider these distributions either uniform (constant) or normal.
3.3.13 Learning with missing and unreliable data
Although not directly needed for application of the missing data techniques to ASR, the problem of learning from missing and uncertain data does relate to, because part of the learning algorithms is evaluation of the estimates given the missing and uncertain data. In [47] the problem of density estimation from incomplete data is presented. The densities are considered ti be mixtures of models. Using the ML approach, a variant of EM algorithm [27] for estimation of the mixture components and regardless of the missing data is derived. The case of uncertain data (as more general then missing data) in training both of general feedforward networks and RBF networks is considered in [110]. The problem of training of RBF networks with missing and uncertain features is tackled in somewhat similar framework as [47] and using the EM algorithm [27]. In [112] the missing data technique is applied in the case when a posterior probabilities are estimated by feed{forward neural network. Derivations both for recall (forward bass, i.e. evaluation { see the previous section) and for training with back{propagation are given, under some assumptions about the data. Derivations for training recurrent networks (both forward pass and back{propagation of error through time) on data with missing features are given in [9]. Genetic programming has also been applied to the task of learning with missing features [5]. In [12] the problem of missing values in the input data is considered in the framework 40
of multivariate autoregressive linear predictive models. An algorithm for estimating the multiple missing values of a multivariate stationary process is derived. The problem of missing and noisy data in non{linear time{series prediction is considered in [111]. In addition, equations for training recurrent neural networks, for stochastic control and reinforcement learning problems are also derived.
3.3.14 Multistream approach to ASR
The multistream approach to ASR is based on combining several streams of evidence [13]. The streams of evidence can be recombined at certain points, synchronously (the easier case) or asynchronously (the more interesting case). With this architecture, it's easy to envisage integration of evidence coming from di�erent types of features on di�erent time scales, and/or from di�erent sources and/or modalities. In [33] this approach was utilized for recombination of evidence from short (10ms, phoneme) and longer (200ms, syllable level) term features in a context of a hybrid system. A special case of the multistream approach is the multiband approach [13][18][76][102]. The separate streams are (critical) bands of a lterbank. All acoustic processing is performed independently in each subband. This results in as many streams of features as there are subbands. There are several reasons in favor of this approach: � recent review of the work of Fletcher [3] about the intelligibility of low and high{pass ltered speech suggests that humans process speech in independent bands; � per{band features modeling (typically all{pole) should give more accurate models simply due to less variation present when each band is treated in isolation; � di�erent recognition strategies may be more e�ective in di�erent bands (for example, different windows and time/frequency tradeo� for di�erent bands); � allowing asynchrony between the bands may lessen some of the constraints of the current models. In [80] the assumption that transitions between the sounds in natural speech occur asynchronously across bands was tested. It was found that one third of the transitions occur more then 50ms of each other in di�erent bands, with high frequency bands timings with a spread dependent on the speaking rate; � it was found that no phonetic information is lost due to independent processing in each band [80] In connection with the problem of robustness in ASR, the multiband approach is particularly suited to band limited noise. As long as the noise leaves some bands una�ected, there is enough information in the remaining bands for ASR. In [108] all pole PLP features are independently (across bands) extracted from the lterbank energies of seven separate bands (each spanning across two critical bands), the phone (context independent) posteriors are estimated per frame and then combined synchronously via a recombination network. In [91] instead of likelihood recombination, subband features are recombined in one vector and classi ed subsequently. 41
The multiband approach has interesting connection to missing data { once the garbled bands are identi ed, in the recombination stage all evidence coming from that band could be completely disregarded.
42
Chapter 4
Research done so far In the past months we started with experiments on connected digits recognition in noise using the TIDIGITS database for the speech and NOISEX database for the noise. Models on clean speech ware trained using HTK. The speech and noise were mixed at various global SNRs. We used were 64 channel auditory maps for feature extraction. Di�erent algorithms (spectral subtraction, adaptive spectral subtraction, Hirsch histogram technique, Martin's minimal statistics) for speech/non{speech separation and di�erent methods for models (class imputation, auditory induction, missing/uncertain/present) and data (local data imputation, global data imputation) adaptation to handle incomplete data were experimented with. A new technique for local imputation (using the distributions of each state separately) of the missing features in the feature vector was found to perform as good as the methods for models adaptation. We also investigated the possibility of using missing data techniques in the context of hybrid ASR system. However, it remains to be seen if this is going to be feasible.
43
Chapter 5
Other Activities As part of the postgraduate studies, a research training program (RTP) was taken with the following subjects: � Speech Technology (COM326); � Research Teamwork in Computer Science (COM693); � Developments in Computer Science (COM695); � Thesis Writing: Principles & Practice (GSC605). � Computer Speech and Hearing (COM325); � Presentation of Computer Science Research (COM694). The following departmental and group weekly seminars and workshops were attended: � Prof. Igor Aleksander (EEE Department, Imperial College, London). \Becoming Conscious: A Neural Representational Model". � Dr. John Carroll (COGS, University of Sussex). \Bias in natural language and how to exploit it". � Prof. Nigel M. Allinson (Image Engineering, Department of Electrical Engineering and Electronics, UMIS). \Bayesian Self-Organizing Networks". � SPHEAR workshop, in LosehillL Hall, Castleton, Hope Valley, Derbyshire. � Kevin Warwick. \Robots can never be intelligent, can they?". � Prof. Stephen Muggleton (DCS, Univ of York). \Inductive Logic Programming: results and issues". � G. Raevans. \Automatic Segmentation of Broadcast News Recordings". � Bruce Millar (ANU, Canberra). \Knowledge and Ignorance in Speech Processing and Describing Spoken Language Databases". 44
� Hideki Kawahara (Wakayama University/ATR/CREST). \Possible role of a repetitive
structure in sounds: STRAIGHT a versatile tool for speech manipulation " � Miguel Carreira-Perpinan. \Latent Variable Models". � David McAlpine (Biomedical Science). \Neurophysiology of the Cocktail-Party E�ect". � Stevan Wermter, Univ. of Sunderland. \Hybrid connectionist language modeling: from acoustics, via syntax and semantics towards dialog processing". � Sue McCabe, Univ. of Plymouth. \Cortical synaptic depression may explain many of the temporal response properties observed in primary auditory cortex - a computational investigation". � Chris Darwin. \Interaural Time Di�erences and F0 perception" During the summer vacations, ELSNET's 6th European summer school in language and speech communication \Robustness: Real Life Applications in Language and Speech" from 13 { 24 July 1998 in Barcelona, Spain, was attended. Introductory presentation about my previous work, in the area of speech synthesis and ow control for video{over{IP was given to the Speech and Hearing group (SPandH) in She�eld. A presentation was given during the SPHEAR meeting in Ulm on the work done so far in the missing data framework. An abstract for a paper on \State based imputation of missing data for robust speech recognition and speech enhancement" was submitted to Eurospeech'99 conference.
45
Chapter 6
Plan for the next 6 months The following experiments/research are planned to be carried out next (listed in the order of priority): � experiments with double spectral/cepstral features and models in conjunction with local data imputation. Models need to be trained in HTK and Matlab code written for the experiments. The test databases is TIDIGITS for the digit strings and NOISEX-92 for the noises. The spectral models state distributions are going to be used for the local data imputation, and cepstral features/models are going to be used afterwards, once the feature vector is completed; � in connection with the technique above we plan to try the conventional techniques for robust ASR (RASTA features and/or other feature trajectory lters, cepstral mean normalization) and nd if any additional gain in the robustness maybe achieved; � schemes for incorporation of the acceleration features ought to be taught of in order to improve the systems baseline performance; � solely for the purpose of nding the upper bounds of the ASR system's performance (using matched models), it's necessary to train models on noisy speech and perform recognition experiments on the same databases; � it may be interesting to try combination of several speech/non{speech separators (spectral subtraction, local SNR estimation, minimal statistics) together for a most conservative estimate possible about what's present. This should be possible because we have more then enough data and should discard any suspected of being contaminated by noise; � it remains to be seen if any connection between the weights of an MLP and the input data distribution can be found. The \maximum information transfer through the sigmoid unit" principle, unsupervised learning for the rst layer and the possible locality of the hidden units will be investigated.
46
Appendix A
Calculating the multidimensional integral of the sigmoid function A.1 The analytic solution of the multidimensional sigmoid integral Lets consider a single unit with two inputs x1 and x2 , corresponding weights w1 and w2 and sigmoid transfer function net(x1 ; x2 ) = 1+e?w 1x ?w x . We integrate over the input x1 , limits being a1 and b1 : 1 1
Zb
1
a1
dx1
1 + e?w1 x1 ?w2 x2 =
Zb
dx1
1
= w1
Zb
1
1a
1
Z ew x dx1 wx e � ew x = ew x + e?w x ; b1
1 1
1 + e?w1 x1 ?w2 x2
a1
2 2
1 1
a1 b Z1
1 1
1 1
2 2
d(ew x ) = 1 d(ew x + e?w x ) ; ew x + e?w x w1 (ew x + e?w x ) a 1 1
1 1
2 2
1 1
1 1
2 2
2 2
1
b 1
w b e?w x = w1 ln(ew x + e?w x ) = w1 ln eew a + + e?w x ; 1 1 1 1
2 2
a1
1 1
2 2
1 1
2 2
(A.1)
w b e?w x ew x 1 ln 1 + ew b +w x : = w1 ln eew a + � = + e?w x ew x w1 1 + ew a +w x 1 The result can also be expressed in terms of the transfer function net(x1 ; x2 ):
Zb
1
a1
1 1
2 2
2 2
1 1
2 2
1 1
2 2
2 2
1 1
2 2
1 ln 1 + ew a +w x ; = 1 + e?w x ?w x w1 1 + ew b +w x
dx1
1 1
2 2
1 1
2 2
1 1
2 2
1 w1 a1 +w2 x2 1 (?a1 ; ?x2 ) : 1+ e = w ln = w1 ln net 1 net (?b1 ; ?x2 ) 1 1+ew1 b1 +w2 x2 1
But we are not going to use the result later.
47
(A.2)
We can easily generalize the result for n inputs - instead w2 x2 of we would have and the integral would be:
Zb
Pn w x i=2 i i
w1 b1 + P wi xi n
dx1
i 1 ln 1 + e = (A.3) P wixi w1 Pn wixi ? w a + a 1+e i i 1+e Now let's consider double integral. The unit has three inputs and one output. The inputs are x1 , x2 and x3 and the corresponding weights w1 , w2 and w3 . The unknown inputs are x1 and x2 with distribution bounded in the corresponding intervals [a1 ; b1 ] and [a2 ; b2 ]. The sigmoid transfer function is 1+e?w x ?1w x ?w x . Using Eq. (A.1) we have for the marginal: 1
=2
n
1
1 1
Zb
1
a1
Zb
1 1
=1
2 2
=2
3 3
dx1 dx2 � 1 + e?w x 1?w x ?w x = 2
1 1
a2
= w1
Zb
1
2a
1
3 3
w1 x1 +w2 b2 +w3 x3
+e ln 11 + ew x +w a +w x dx1 ; 1 1
�b 1 Z
1
=w
2 2
2 a 1
2 2
(A.4)
3 3
ln(1 + ew1 x1 +w2 b2 +w3 x3 )dx
1?
Zb
1
a1
ln(1 + ew1 x1 +w2 a2 +w3 x3 )dx
�
1 :
Rb
For forms of type ln(1 + ewx+C )dx we have: a
Zb a
ln(1 + ewx+C )dx = = w1 = w1 = w1
?eZwb+C ?ewa+C
ln(1 ? u) � w1 � du u;
� Z0
?ewa+C � ?eZwa+C
0
� ?eZwa+C �
0
?eZwb C � du du ln(1 ? u) u + ln(1 ? u) u ; +
0
?eZwb C � du du ? ln(1 ? u) u ? ? ln(1 ? u) u ; +
Li1 (u) du u ?
?eZwb+C
0
0
�
Li1 (u) du u ;
�
= w1 Li2 (?ewa+C ) ? Li2 (?ewb+C ) ; with the substitution ?ewx+C = u; ?ewx+C wdx = du; dx = w1 duu and using the Eq. (A.8). 48
(A.5)
The function Li1 (u) is polilogarithm function of order one [64]. It can be expressed as Li1 (z) = ? ln(1 ? z) for jzj < 1, or as an in nite sum: 1 n 3 2 X Li1 (z) = z + z2 + z3 + : : : = zn : n=1
(A.6)
The polilogarithm function of order m, Lim (z ), expressed through it's in nite sum is: 1 n 3 2 X Lim (z) = z + 2zm + 3zm + : : : = nzm ;
(A.7)
n=1
for jz j < 1. For z outside of this interval, the expression:
Zz
Lim+1 (z) = Lim (t) dtt
(A.8)
0
can be used ([64] pp. 169). So, for the double integral (A.4) we have:
Zb
1
a1
Zb
dx1 dx2 � 1 + e?w x 1?w x ?w x = 2
a2
1 1
�
2 2
3 3
= w 1w Li2 (?ew a +w b +w x ) ? Li2 (?ew b +w b +w x ) 1 2
1 1
2 2
3 3
1 1
2 2
3 3
�
? Li2(?ew1 a1 +w2a2 +w3x3 ) + Li2 (?ew1 b1+w2a2 +w3x3 )
�
;
(A.9)
= w 1w ?Li2 (?ew a +w a +w x ) + Li2 (?ew a +w b +w x ) 1 2
+ Li2
1 1
2 2
3 3
(?ew1 b1 +w2 a2 +w3 x3 ) ? Li
1 1
2
2 2
3 3
�
(?ew1 b1 +w2 b2 +w3 x3 )
:
Using substitution ?ewx+C (as in Eq. (A.5)) and Eq. (A.8) the de nite integral of polilogarithm function of any argument of form ?ewx+C can be expressed as subtraction of two terms {
49
polilogarithm functions of higher (by one) order of arguments of the same type (?ewx+C ):
Zb a
Lim (?ewx+C )dx = w1 = w1
?eZwb+C ?ewa+C
Lim(u) du u;
� Z0
?eZwb C � du du Lim(u) u + Lim(u) u ; +
?ewa+C � ?eZwa+C
= w1 ?
?eZwb C � du du Lim (u) u ; Lim (u) u + +
0
0
�
(A.10)
0
�
= w1 ?Lim+1 (?ewa+C ) + Lim+1 (?ewb+C ) : So, we can analytically express multidimensional integral of a sigmoid transfer function as a sum of polilogarithms of the same order. Every additional unknown input xi that we integrate over the bounds [ai ; bi ], raises the dimensionality of the integral by one, which consequently doubles the number of terms in the sum of polilogarithm functions and also raises by one the order of the functions in the sum. For example, for three dimensional integral we would get: � Z Z Z 1 1 b1 dx1 b2 dx2 b3 dx3 � 1 + e?w x ?w x ?w x ?w x = w w w 1 2 3 1 1
a3
a2
a1
2 2
3 3
4 4
Li3(?ew a +w a +w a +w x ) ? Li3 (?ew a +w a +w b +w x ) ? Li3 (?ew a +w b +w a +w x ) + Li3 (?ew a +w b +w b +w x ) ? Li3 (?ew b +w a +w a +w x ) + Li3 (?ew b +w a +w b +w x )� + Li3 (?ew b +w b +w a +w x ) ? Li3 (?ew b +w b +w b +w x ) : 1 1
2 2
3 3
4 4
1 1
2 2
3 3
4 4
1 1
2 2
3 3
4 4
1 1
2 2
3 3
4 4
1 1
2 2
3 3
4 4
1 1
2 2
3 3
4 4
1 1
2 2
3 3
4 4
1 1
2 2
3 3
4 4
(A.11)
Considering that one{dimensional integral A.1 can be expressed as:
Zb
1
a1
�
dx1
�
1 w b +w x )) ? ln(1 ? (?ew a +w x )) ; 1 + e?w x ?w x = w1 ln(1 ? (?e 1 1
2 2
� 1
1 1
2 2
1 1
�
= w Li1 (?ew a +w x ) ? Li1 (?ew b +w x ) ; 1
1 1
2 2
we can show that the signs of the terms are: for 1-D integral: + for 2-D integral: - + + for 3-D integral: + - - + - + + for 4-D integral: - + + - + - - + + - - + - + + 50
1 1
2 2
2 2
(A.12)
.. . and can be computed by the following pseudo{code: int Sign(int NoIntegral, NoTerm) /* returns �1 */ if (NoIntegral == 1) if (NoTerm == 0) return 1; else return -1; else if (NoTerm < 2NoIntegral?1 ) return -Sign(NoIntegral-1, NoTerm); else return Sign(NoIntegral-1, NoTerm - 2NoIntegral?1 ); Finally, for a single sigmoid unit with n inputs xi , and weights wi for i = 1; 2; : : : ; n and transfer function 1 ; (A.13) ? P wixi n
1+e i and integrating over m of the inputs in the intervals [ai ; bi ] for i = 1; 2; : : : ; m and for the rest n ? m of the inputs the exact values ci for i = m + 1; m + 2; : : : ; n are known, we have this expression: =1
1 1 C A n ? P wi xi 1+e i (xm ;xm ;:::0;xn)=(cm ;cm ;:::;cn ) Pm wj haj or bji+ Pn m 2X ?1 1 j m =Q Sign(m; i) � Lim @?ej m w i=0
0b b bm B@Z dx1 Z dx2 : : : Z dxm � 1
a1
2
a2
am
=1
+1
+2
+1
=1
i=1
i
+2
=
+1
wj cj
1 A
(A.14)
where haj or bj i means \aj or bj depending on the term number (i.e. the value of i)". For i = 0 the sum is w1 a1 + : : : + wm am ; for i = 1 it is w1 a1 + : : : + wm?1 am?1 + wm bm ; for i = 2 it is w1 a1 +: : :+wm?2 am?2 +wm?1 bm?1 +wmam ;etc.; for i = 2m ?2 it is w1 b1 +: : :+wm?1 bm?1 +wm am; for i = 2m ? 1 it is w1 b1 + : : : + wm bm .
A.2 Computing the approximation of the analytic solution We need to compute the value of the terms of form Lim (?es ). From the in nite expansion of Lim(z) we have:
Lim (z) = 51
1 zn X
n=1 n
m
(A.15)
for jz j < 1. The quotient between the two consecutive terms of this in nite sum is: zn+1
m z z q = (n+1) zmn = (n+1)m = (1 + 1 )m : n n nm
(A.16)
Lim(z) � 1 ?z z = 1=z ?1 1=e ; e
(A.17)
Lim(?es) � ?e?s1? 1=e = ? e?s +1 1=e ;
(A.18)
We already have that n ! 1; when m ! 1 (with the number of integrals increasing and the order of the polilogarithm function increases) the term (1+ n1 )m ! e and q ! ze . This means that for large m the in nite sum will approximate in nite geometric sum z; zq; zq2 ; � � � which converges to 1?z q for jqj < 1. Therefore, we have the approximation: for jz=ej < 1. For z = ?es we have:
for j ? es =ej < 1 and j ? es j < 1 equivalent to s < 0. For s � 0 we can use the following relation ([64], pp.172):
Lim (?x) + (?1)m Lim(? 1 ) = ? x
X2c lnm?2r (x) 1 lnm (x) + 2 bm= Li2r (?1); m! r=1 (m ? 2r)!
(A.19)
for jx > 1j. \For large x, the rst term grows very large compared to the second one" ([64], pp.173). Taking into account only the rst term, approximation (A.18) and substituting x = es we have: Lim (?es) � ? m1 ! lnm (es) ? (?1)m Lim (? e1s ); (A.20) m = ? sm! ? (?1)m Lim (?e?s ): for s � 0. So, for Lim (e?s ) we have: 8 1 > ? for s < 0; > ? s < e + 1=e ; Lim(?es) � > (A.21) m > :? s ? (?1)m Lim (?e?s) ; for s � 0. m!
This is one approximation of the forms Lim (?es ) that we can use to compute the integral (A.14). Unfortunately, the number of terms (which are polilogarithm functions) in (A.14) doubles with every additional integral (unknown input xi ). So, for example, for 20 missing inputs we have to compute � 106 terms. If we take approximation (A.21) as similar to the sigmoid transfer function, the complexity of the computation required can be thought as if we were taking two points in each new dimension (unknown input) with some of the Monte Carlo techniques. For a 52
P
m wa knownPm the computation can be speed up by precomputing wi ai , wi bP i , ewi ai , ewi bi , Pi=1 i i m wi ai and e i and putting in/out terms wi ai , wi bi and ewi ai , ewi bi into mi=1 wi ai and e mi wi ai by addition/subtraction and multiplication/division (respectively). Other possibility for calculation of Lim (?es ) is to use nite number of terms of the in nite P s )n ( ? e 1 row n=1 nm for s < 0 and Equation (A.19) for s � 0. Since this is an alternating series, Eulers's transformation ([121], pp. 166) may be used to accelerate the convergence given a nite number of terms used. =1
=1
53
Bibliography [1] H. Agaiby, C. Fyte, S. McGlinchey, and T. J. Moir. Commercial speech recognisers performance under adverse conditions, a survey. In Robust speech recognition using unknown communication channels, pages 163{166. ESCA-NATO Tutorial and Research Workshop, apr 1997. [2] S. Ahmad and V. Tresp. Some solutions to the missing feature problem in vision. In J. H. Hanson, J. D. Cowan, and C. L. Giles, editors, Advances in NIPS 5, pages 393{400. Morgan Kaufmann, San Mateo, CA, 1993. [3] J.B. Allen. How do humans process and recognize speech. IEEE transactions on speech and audio processing, 2:567{577, oct 1994. [4] T. Anastasakos, J. McDonough, and J. Makhoul. Speaker adaptive training: a maximum likelihood approach to speaker normalization. In ICASSP'97, pages 1043{1046, 1997. [5] G. Backer. Learning with missing data using genetic programming. http://????????????, 1998. (personal web page). [6] J. Baker, J. Baker, P. Bamberg, L. Gillick, L. Lamel, R. Roth, F. Scattone, and D. Sturtevant. Dragon systems resource management benchmark results{February 1991. In DARPA speech and natural language workshop, pages 59{64, feb 1991. [7] J. Barker and M. Cooke. Modeling the recognition of spectrally reduced speech. In Eurospeech'97, pages 2127{2130, 1997. [8] A. J. Bell and T. J. Sejnowski. An information{maximization approach to blind separation and blind deconvolution. Neural computation, 7(6):1004{1034, 1995. [9] Y. Bengio and F. Gingras. Recurrent neural networks for missing and asynchronous data. In ??????, editor, Advances in NIPS ??? ??????, ?????? [10] F. Berthomier, H. Glotin, E. Tessier, and H. Bourlard. Interfacing of CASA and partial recognition based on a multistream technique. In ICSLP'98, pages ???{???, 1998. [11] C. M. Bishop. Neural networks for pattern recognition. Clarendon press, Oxford, 1995. [12] P. Bondon, D. P. Ruiz, and A. Galliego. Recursive methods for estimating multiple missing values of a multivariate stationary process. http://????????????, 1998. (personal web page). 54
[13] H. Bourlard, S. Dupont, and C. Ris. Multi{stream speech recognition. Technical Report IDIAP{RR 96{07, IDIAP, Martigny, Valais, Switzerland, dec 1996. [14] A. S. Bregman. Auditory scene analysis. MIT Press, 1990. [15] M. K. Brendborg and B. Lindberg. Noise robust recognition using feature selective modeling. In Eurospeech'97, pages 295{298, 1997. [16] G. J. Brown. Computational auditory scene analysis: A representational approach. PhD thesis, Department of Computer Science, University of She�eld, 1992. [17] G. J. Brown and M. Cooke. Computational auditory scene analysis. computer speech and language, (8):297{336, 1994. [18] C. Cerisara, J.-P. Haton, and D. Fohr. A recombination model for multi{band speech recognition. In ICASSP'98, pages 717{720, 1998. [19] J.-T. Chien, C.-H. Lee, and H.-C. Wang. Improved Bayesian learning of Hidden Markov models for speaker adaptation. In ICASSP'97, pages 1027{1030, 1997. [20] R. Cole, K. Roginski, and M. Fanty. A telephone speech database of spelled and spoken names. In ICSLP'92, volume 2, pages 891{895, 1992. [21] ??. Comerford, ??. Makhoul, and ??. Shwartz. ??? IEEE Spectrum, pages ???{???, 1997. [22] M. Cooke, M. Crawford, and P. Green. Learning to recognize speech in noisy environments. In ATR Workshop on \Biological foundations for speech perception and production", pages ???{???, sep 1994. [23] M. Cooke, P. Green, C. Anderson, and D. Abberley. Recognition of occluded speech by Hidden Markov models. Technical Report TR{94{05{01, Department of Computer Science, University of She�eld, may 1994. [24] M. P. Cooke. Modelling auditory processing and organisation. PhD thesis, Department of Computer Science, University of She�eld, 1991. [25] M. P. Cooke. Robust speech processing in the auditory system. http://www.dcs.shef.ac. uk/research/groups/spandh/BarcelonaTalks/Barcelo%naTalks.htm, oct 1998. Notes from lecture given at ELSNET Summer School on Robustness in Speech and Language in Barcelona, july, 1998. [26] J. de Veth, B. Cranen, and L. Boves. Acoustic backing{o� in the local distance computation for roobust automatic speech recognition. In ICSLP'98, pages 1427{1430, 1998. [27] A. P. Dempster, N. M. Laird, and D. B. Rubin. Maximum likelihood from incomplete data via the EM algorithm. Journal of Royal Statistical Society, 39:1{38, 1977. [28] V. V. Digalakis and L. G. Neumeyer. Speaker adaptation using combined transformation and Bayesean methods. IEEE transactions on speech and audio processing, 4(4):294{300, jul 1996. 55
[29] S. Downey. An analysis of Wiener adaptation for speech recognition in adverse conditions. Proceedings of the institute of acoustics, 18(9):225{233, 1996. [30] A. Drygajlo and M. El-Maliki. Speaker veri cation in noisy environment with combined spectral subtraction and missing feature theory. In ICASSP'98, volume 1, pages 121{124, 1998. [31] A. Drygajlo, N. Virag, and G. Cosendai. Robust speech recognition in noise using speech enhancement based on the masking properies of the auditory system and adaptive HMM. In Eurospeech'95, pages 473{476, sep 1995. [32] R. O. Duda and P. E. Hart. Pattern classi cation and scene analysis. John Wiley & sons, New York, 1973. [33] S. Dupont and H. Bourlard. Using multiple time scales in a multi{stream speech recognition system. In Eurospeech'97, pages ???{???, 1997. [34] Stephane Dupont. Missing data reconstruction for roobust automatic speech recognition in the framework of hybrid HMM/ANN systems. In ICSLP'98, pages 1439{1442, 1998. [35] D. P. W. Ellis. Prediction{driven computational auditory scene analysis. PhD thesis, Department of Electrtical Engineering and Computer Science, M.I.T., 1996. [36] J. A. Flores and S. J. Young. Adapting a HMM-based recogniser for noisy speech enhanced by spectral subtraction. In Eurospeech'93, volume 2, pages 829{832, 1993. [37] S. Furui. Flexible speech recognition. In Eurospeech'95, pages 1595{1603, 1995. [38] S. Furui. Recent advances in robust speech recognition. In Robust speech recognition using unknown communication channels, pages 11{20. ESCA-NATO Tutorial and Research Workshop, apr 1997. [39] M. J. F. Gales. \NICE" model{based compensation schemes for robust speech recognition. In Robust speech recognition using unknown communication channels, pages 55{64. ESCANATO Tutorial and Research Workshop, apr 1997. [40] M. J. F. Gales and S. J. Young. An improved approach to the Hidden Markov model decomposition of speech and noise. In ICASSP'92, volume 1, pages 233{236, 1992. [41] M. J. F. Gales and S. J. Young. HMM recognition in noise using parallel model combination. In Eurospeech'93, volume 2, pages 837{840, 1993. [42] M. J. F. Gales and S. J. Young. Parallel model combination for speech recognition in noise. Technical Report 135, Cambridge University Engineering Department, Cambridge, jun 1993. [43] M. J. F. Gales and S. J. Young. Robust continuous speech recognition using parallel model combination. Technical Report 172, Cambridge University Engineering Department, Cambridge, mar 1994. 56
[44] Y. Gao and J.-P. Haton. Noise reduction and speech recognition in noise conditions tested on LPNN-based continuous speech recognition system. In Eurospeech'93, volume 2, pages 1035{1038, 1993. [45] P. N. Garner and W. J. Holmes. On the robust incorporation of robust features into Hidden Markov models for automatic speech recognition. In ICASSP'98, pages ???{???, 1998. [46] J.-L. Gauvain and C.-H. Lee. Maximum a posteriori estimation for multivariate Gaussian mixture observations of Markov chains. IEEE transactions on speech and audio processing, 2(2):291{298, apr 1994. [47] Z. Ghahramani and M. I. Jordan. Supervised learning from incomplete data via an em approach. In J. D. Cowan, G. Tesauro, and J. Alspector, editors, Advances in NIPS 6, pages 120{129. Morgan Kaufmann, San Mateo, CA, 1994. [48] Y. Gong. Speech recognition in noisy environments. Speech Communication, 16:261{291, 1995. [49] P. D. Green, M. P. Cooke, and M. D. Crawford. Auditory scene analysis and hidden markov model recognition of speech in noise. In ICASSP'95, pages ???{???, 1995. [50] B. A. Hanson and T. H. Applebaum. Features for noise{robust speaker{independent word recognition. In ICSPLP'90, volume 2, pages 1117{1120, 1990. [51] H. Hermansky. Perceptual linear predictive (PLP) analysis of speech. JASA, 87(4):1738{ 1752, apr 1990. [52] H. Hermansky and N. Morgan. RASTA processing of speech. IEEE transactions on speech and audio processing, 2(4):578{589, oct 1994. [53] J. Hernando and C. Nadeu. A comparative study of parameters and distances for noisy speech recognition. In Eurospeech'91, volume 1, pages 91{94, 1991. [54] H. G. Hirsch. Estimation of noise spectrum and it's application to snr-estimation and speech enhancement. Technical Report TR-93-012, ICSI, Berkeley, CA, 1993. [55] H. G. Hirsch and C. Enrichter. Noise estimation for robust speech recognition. In ICASSP'95, pages 153{156, 1995. [56] H. G. Hirsch, P. Meyer, and H. W. Ruehl. Improved speech recognition using high{pass ltering of subband enevelopes. In Eurospeech'91, pages 413{416, 1991. [57] J.N. Holmes and N.C. Sedgwick. Noise compensation for speech recognition using probabilistic models. In ICASSP'86, pages 741{844, 1986. [58] J.-C. Junqua. The Lombard re ex and its role on human listeners and automatic speech recognizers. JASA, 1:510{524, 1993. 57
[59] J.-C. Junqua, S. Fincke, and K. Field. In uence of the speaking style and the noise spectral tilt on the lombard re ex and automatic speech recognition. In ICSLP'98, pages 467{470, 1998. [60] B. E. D. Kingsbury, N. Morgan, and S. Greenberg. Robust speech recognition using the modulation spectrogram. Speech communication, 25(1{3):117{132, 1998. [61] T. Kobayashi, T. Kanno, and S. Imai. Generalized cepstral modeling of speech degraded by additive noise. In Eurospeech'93, volume 1, pages 609{612, 1993. [62] F. Kubala, S. Austin, C. Barry, J. Makhoul, P. Plaveway, and R. Schwartz. Byblos speech recognition benchmark results. In DARPA speech and natural language workshop, pages 77{82, feb 1991. [63] C.-H. Lee. On feature and model compensation approach to robust speech recognition. In Robust speech recognition using unknown communication channels, pages 45{54. ESCANATO Tutorial and Research Workshop, apr 1997. [64] L. Lewin. Dilogarithms and associated functions. Macdonald & Co., London, 1958. [65] K. Linhard and H. Klemm. Noise reduction with spectral subtraction and median ltering for suppression of musical tones. In Robust speech recognition using unknown communication channels, pages 159{162. ESCA-NATO Tutorial and Research Workshop, apr 1997. [66] R. Lippmann. Speech perception by humans and machines. In ESCA Workshop on the Auditory Basis of Speech Perception, pages 309{316, 1996. [67] R. P. Lippmann and B. A. Carlson. Using missing feature theory to actively select features for robust speech recognition with interruptions, ltering, and noise. In Eurospeech'97, pages ???{???, 1997. [68] P. Lockwood, C. Baillargeat, J. M. Gillot, J. Boudy, and G. Faucon. Noise reduction for speech enhancement in cars: non-linear spectral subtraction/Kalman ltering. In Eurospeech'91, volume 1, pages 83{86, 1991. [69] P. Lockwood and J. Boudy. Experiments with a non-linear spectral subtractor (NSS) Hidden Markov Models and the projection, for robust speech recognition in cars. In Eurospeech'91, volume 1, pages 79{82, 1991. [70] F. Martin, K. Shikano, and Y. Minami. Recognition of noisy speech by composition of Hidden Markov Models. In Eurospeech'93, volume 2, pages 1031{1034, 1993. [71] R. Martin. An e�cient algorithm to estimate the instantaneous snr of speech signal. In Eurospeech'93, pages 1093{1096, 1993. [72] D. Matrouf and J. L. Gauvain. Model compensation for additive and covolutive noises in training and test data. In Robust speech recognition using unknown communication channels, pages 207{210. ESCA-NATO Tutorial and Research Workshop, apr 1997. 58
[73] T. Matsui and S. Furui. A study of speaker adaptation based on minimum classi cation error training. In Eurospeech'95, pages 81{84, sep 1995. [74] T. Matsui, T. Matsuoka, and S. Furui. Smoothed N{best{based speaker adaptation for speech recognition. In ICASSP'97, pages 1015{1018, 1997. [75] T. Matsuoka and C.-H. Lee. A study of on{line Bayesean adaptation for HMM{based speech recognition. In Eurospeech'93, pages 815{818, 1993. [76] P. McCourt, S. Vaseghi, and N. Harte. Multi{resolution cepstral features for phoneme recognition across speech sub{bands. In ICASSP'98, pages 557{560, 1998. [77] J. McDonough, T. Anastasakos, G. Zavaliagkos, and H. Gish. Speaker{adapted training on the switchboard corpus. In ICASSP'97, pages 1059{1062, 1997. [78] N. Merhav and C.-H. Lee. A minimax classi cation approach with application to robust speech recognition. IEEE transactions on speech and audio processing, 1(1):90{100, jan 1993. [79] J. M. Meyer, K. U. Simmer, and K. D. Kammeyer. Comparason of one{ and two{channel noise{estimation techniques. http://??????????, jan 1999. nd the exact address! [80] N. Mirghafori and N. Morgan. Transmissions and transitions: a study of two common assumptions in multiband ASR. In ICASSP'98, volume 2, pages 713{716, 1998. [81] S. Mizuta and K. Nakajima. Optimal discriminative training for HMMs to recognize noisy speech. In ICSLP'92, volume 2, pages 1519{1522, 1992. [82] C. Mokbel, L. Barbier, Y. Kerlou, and G. Chollet. Word recognition in the car: adapting recognizers to the new environments. In Eurospeech'92, volume 1, pages 707{710, 1992. [83] B. C. J. Moore. An Introduction to the Psychology of Hearing. Academic Press, 24/28 Oval Road, London NW1, 1982. [84] N. Morgan. Robust features and environmental compensation: a few comments. In Robust speech recognition using unknown communication channels, pages 43{44. ESCA-NATO Tutorial and Research Workshop, apr 1997. [85] A. C. Morris, M. P. Cooke, and P. D. Green. Some solutions to the missing feature problem in data classi cation, with application to noise robust ASR. In ICASSP'98, pages 737{740, 1998. [86] A. C. Morris, M.P. Cooke, and P.D. Green. Recognition of speech from incomplete spectral data. Technical Report CS-96-02, Department of Computer Science, University of She�eld, feb 1998. [87] H. Murveit, J. Butzberger, and M. Weintraub. Speech recognition in SRI's resource management and AIS systems. In DARPA speech and natural language workshop, pages 94{100, feb 1991. 59
[88] Y.K. Muthasamy, R.A. Cole, and B.T. Oshika. The OGI multi-language telephone speech corpus. In ICSLP'92, volume 2, pages 895{898, 1992. [89] C. Nadeu, J. Hernando, and M. Gorricho. On the decorrelation of lter{bank energies in speech recognition. In Eurospeech'95, pages 1381{1384, sep 1995. [90] T. Nakatani, H. G. Okuno, M. Goto, and T. Ito. Multiagent based binaural sound stream segregation. In D. F. Rosenthal and H. G. Okuno, editors, Computational auditory scene analysis, pages 195{214. Lawrence Erlbaum Associates, Inc., 10 Industrial Avenue, Mahwah, New Jersey 07430, 1998. [91] S. Okawa, E. Bocchieri, and A. Potamianos. Multi{band speech recognition in noisy environments. In ICASSP'98, pages 641{644, 1998. [92] M. Padmanabhan, L. R. Bahl, D. Nahamoo, and M. A. Picheny. Speaker clustering and transformation for speaker adaptation in speech recognition systems. IEEE transactions on speech and audio processing, 6(1):71{77, jan 1998. [93] D. S. Pallet, J. G. Fiscus, A. Martin, and M. A. Przybocki. 1997 broadcast news benchmark test results: english and non{english. In DARPA broadcast news transcription and understanding workshop, pages ??{??, feb 1998. [94] D.B. Paul and J.M. Baker. The design for the Wall Street Journal{based CSR corpus. In ICSLP'92, volume 2, pages 899{902, 1992. [95] M. Phillips, J. Glass, J. Polifroni, and V. Zue. Collection and analyses of WSJ{CSR corpus at MIT. In ICSLP'92, volume 2, pages 907{910, 1992. [96] J. W. Picone. Signal modeling techniques in speech recognition. Proceedings of the IEEE, 81(9):1215{1247, sep 1993. [97] D. Pye and P. C. Woodland. Experiments in speaker normalisation and adaptation for large vocabulary speech recognition. In ICASSP'97, pages 1047{1050, 1997. [98] B. Raj, R. Singh, and R. M. Stern. Inference of missing spectrographic features for robust speech recognition. In ICSLP'98, pages 1491{1494, 1998. [99] V. Raman and V. Ramanujam. Incorporation of noise pre-processing into an entrenched speech recognition system. In Robust speech recognition using unknown communication channels, pages 203{206. ESCA-NATO Tutorial and Research Workshop, apr 1997. [100] S. Renals and H. Bourlard. Connectionist probability estimators in HHM speech recognition. IEEE transactions on speech and audio processing, 2(1):161{173, jan 1994. [101] S. Renals, N. Morgan, H. Bourlard, H.Franco, and M. Cohen. Connectionist optimisation of tied mixture hidden markov models. In ??????, editor, Advances in NIPS 4, pages 167{174. Morgan Kaufmann, San Mateo, CA, 1992. 60
[102] R. Sarikaya and J. N. Gowdy. Subband based classi cation of speech under stress. In ICASSP'98, pages 569{572, 1998. [103] M. Schubler, F. Gallwitz, and S. Harbeck. A fast algorithm for unsupervised incremental speaker adaptation. In ICASSP'97, pages 1019{1022, 1997. [104] O. Siohan, Y. Gong, and J.-P. Haton. Noise adaptation using linear regression for continuous noisy speech recognition. In Eurospeech'95, pages 465{468, sep 1995. [105] R. M. Stern, B. Raj, and P. J. Moreno. Compensation for environmental degradation in automatic speech recognition. In Robust speech recognition using unknown communication channels, pages 33{42. ESCA-NATO Tutorial and Research Workshop, apr 1997. [106] B. Strope and A. Alwan. Robust word recognition using threaded spectral peaks. In ICASSP'98, pages 625{628, 1998. [107] T. Takiguchi, S. Nakamura, Q. Huo, and K. Shikano. Adaptation of model paramatars by HMM decomposition in noisy reverberant environments. In Robust speech recognition using unknown communication channels, pages 155{158. ESCA-NATO Tutorial and Research Workshop, apr 1997. [108] S. Tibrawala and H. Hermansky. Multi{band and adaptation approaches to robust speech recognition. In ICASSP'98, pages ???{???, 1998. [109] K. Torkkola. Blind separation of delayed sources based on information maximization. In ICASSP'96, volume 6, pages 3509{3511, 1996. [110] V. Tresp, S. Ahmad, and R. Neuneier. Training neural networks with de cient data. In J. D. Cowan, G. Tesauro, and J. Alspector, editors, Advances in NIPS 6, pages ???{??? Morgan Kaufmann, San Mateo, CA, 1994. [111] V. Tresp and R. Hofmann. Missing and noisy data in nonlinear time{series prediction. In B. Wilson et al., editor, Neural Networks for Signal Processing 5, pages ???{??? IEEE Signal Processing Society, Piscataway, NJ, 1995. [112] V. Tresp, R. Neuneier, and S. Ahmad. E�cient methods for dealing with missing data in supervised learning. In G. Tesauro, D. S. Touretzky, and T. K. Leen, editors, Advances in NIPS 7, pages ???{??? MIT Press, Cambridge, MA, 1995. [113] M. Trompf, R. Richter, H. Eckhardt, and H. Hackbarth. Combination of distortion{robust feature extraction and neural noise reduction for ASR. In Eurospeech'93, volume 2, pages 1039{1042, 1993. [114] A. Varga and K. Ponting. Control experiments on noise compensation in Hidden Markov Model based continuous word recognition. In Eurospeech'89, volume 1, pages 167{170, 1989. [115] A. P. Varga and R. K. Moore. Hidden Markov model decomposition of speech and noise. In ICASSP'90, pages 845{848, 1990. 61
[116] A. P. Varga and R. K. Moore. Simultaneous recognition of concurent speech signals using Hidden Markov model decomposition. In Eurospeech'91, pages 1175{1178, 1991. [117] S. V. Vaseghi and B. P. Milner. Noise{adaptive Hidden Markov models based on Wiener lters. In Eurospeech'93, volume 2, pages 1023{1026, 1993. [118] S. V. Vaseghi and B. P. Milner. Noise compensation methods for Hidden Marko Model speech recognition in adverse environments. IEEE transactions on speech and audio processing, 5(1):11{21, jan 1997. [119] O. Vikki and K. Laurila. Noise robust HMM{based speech recognition using segmental cepstral feature vector normalization. In Robust speech recognition using unknown communication channels, pages 107{110. ESCA-NATO Tutorial and Research Workshop, apr 1997. [120] M. Weintraub. A theory and computational model of auditory monoaural sound separatioon. PhD thesis, Department of Electrical Engineering, Stanford University, 1985. [121] H. William. Numerical recipes in C: the art of scienti c computing. Cambridge University Press, Cambridge, second edition, 1992. [122] F. Xie and D. V. Campernolle. Speech enhancement by nonlinear spectral estimation{a unifying approach. In Eurospeech'93, volume 1, pages 617{620, 1993. [123] R. Yang, M. Mjaniemi, and P. Haavisto. Dynamic parameter compensation for speech recognition in noise. In Eurospeech'95, pages 469{472, sep 1995. [124] D. Yu and T. Huang. Canonical correlation base compensation approach for robust speech recognition in noisy environment. In Eurospeech'95, pages 477{480, sep 1995. [125] G. Zavaliagkos, R. Schwartz, and J. Makhoul. Batch, incremental and instantaneous adaptation techniques for speech recognition. In ICASSP'95, pages 676{679, 1995. [126] Y. Zhao. An acoustic{phonetic{based speaker adaptation technique for improving speaker{ independent continuous speech recognition. IEEE transactions on speech and audio processing, 2(3):380{394, jul 1994.
62