Abstract - This paper introduces a new perceptual model for. Monte Carlo Localization (MCL). In our approach a 3D laser scanner is used to observe the ceiling.
Robust Self-Localization in Industrial Environments based on 3D Ceiling Structures Oliver Wulf, Daniel Lecking, Bernardo Wagner Institute for Systems Engineering, Real Time Systems Group University of Hannover Hannover, Germany {wulf,lecking,wagner}@rts.uni-hannover.de Abstract - This paper introduces a new perceptual model for Monte Carlo Localization (MCL). In our approach a 3D laser scanner is used to observe the ceiling. The MCL matches ceiling structures like beams, columns, air condition and lightning installation against a world model containing line and point features. Thus the localization is not effected by clutter or any kind of dynamic obstacles on the ground level. Different experiments show that our system can be used to localize robustly in factory buildings and halls. Experimental results include a 5 day run of an autonomous fork lift truck on a logistics fair in Hannover
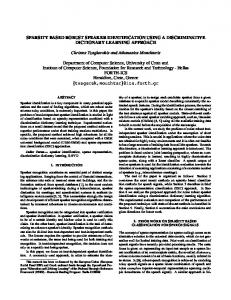
term operation in factory buildings and exhibition halls is problematic (see Figure 1).
Index Terms - Monte Carlo Localization, 3D laser scan, 2D feature map, dynamic environments
I. INTRODUCTION Robust self-localization is one of the main requirements for autonomous mobile robots. It can be defined as the task of estimating the robot’s pose given a map of the environment, the observation of the internal state and world perceptions. Over the past years many different solutions for these localization problems have been presented. One algorithm that performs very well is the Monte Carlo Localization (MCL) [1] [2]. The advantages of this probabilistic algorithm are the possibility to represent non-linearity and the ability to handle multiple hypotheses. The MCL algorithm has been successfully tested within different environments and with a number of different sensors including 2D laser scanners [1], 3D laser scanners [3] and cameras [4]. But in environments like factory buildings, halls and fairgrounds localization is still a challenging task. The problems can be attributed to the absence of static landmarks for mapping and localization. Other problems arise from changes in the environment over time. These changes can be caused by dynamic obstacles like people or other vehicles and long term changes from placed goods or rearrangements. Unmapped features interfere with the localization in two ways. On one hand these features can occlude landmarks that are used for localization. Thus the odometry drift can not be compensated. On the other hand obstacles can lead to wrong data association and therefore severe localization errors. Even though MCL algorithms are able to handle a certain amount of dynamic obstacles and recent SLAM algorithms are able to handle long term changes in the environment [5], robust long
Figure 1: Autonomous fork lift truck operating in an exhibition hall
Another approach to overcome these problems is to improve the sensor input. In [6][7][8] the localization systems are based on a camera that observes the ceiling. By this means the localization systems are not suffering from occlusion due to dynamic obstacles. In our approach we also use the ceiling for localization. But in contrast to [6][7][8] the sealing is sensed with a 3D laser range scanner. Whereas the 3D laser scanner is able to measure the ceiling geometry without the distortion (because of the unknown ceiling height) and illumination problems known from camera solutions. This paper introduces the perceptual model and the world model that allows Monte Carlo Localization with 3D ceiling information. Following the method description experimental results in three different scenes are presented. II. 3D LASER RANGE SCANNER FOR WORLD PERCEPTION The sensor that has been employed for the experiments is a fast 3D laser scanner, developed at the University of Hannover. As earlier versions of this scanner are already published [9], this section will only describe the basic functionality and the way it is combined with the MCL algorithm.
The 3D scanner consists of a standard 2D laser range finder (Sick LMS 291-S14) and an additional servo drive (RTS/ScanDrive). This approach is common praxis [10] as there is no commercial 3D laser scanner available that meets the requirements of mobile robots. The specialties of our ScanDrive are a number of optimizations that are made to allow fast scanning. One mechanical optimization is the splitring connection for power and data. This connection allows continuous 360° scanning without the accelerations and high power consumption that are typical for panning systems. Even more important than the mechanical and electrical improvements is the precise synchronization between the 2D laser data, servo drive data and the wheel odometry. Having this good synchronization, it is possible to compensate systematic measurement errors and to measure accurate 3D point-clouds even with a moving robot. The data output of the laser scanner is an set of 3D points given in a robot centered Cartesian coordinate system.
{
L = ( x, y , z )
(i )
}
i =1,...,m
(1)
The data rates that are used in our experiments are between 240x181 points (m=43440) scanned in 3.2s and 90x181 points (m=16290) in 1.2s (angle resolution 4° horizontal x 0.5° vertical). III. MONTE CARLO LOCALIZATION Monte Carlo Localization (MCL) or particle filtering is a recursive Bayes filter that estimates the posterior belief distribution of a robot’s pose given a map of the environment and sensor data of motion and perception. The posterior is approximated by a set of samples drawn from the belief distribution. Each sample represented by a vector contains a Cartesian coordinate, an orientation and an associated number called importance factor (or weight), which represents the probability of being at the location. As our approach follows the one described in [8] we do not explain the details of the used Monte Carlo Localization. In fact we focus on the world model and the senor model (perceptual model) that allow to do MCL with ceiling structures. A. World Model Even though this MCL algorithm is using a 3D sensor the world model is no full 3D model as it is known in computer graphics and virtual reality. In fact the world model is a 2D representation of features located at a specified height. But still the advantage of using a 3D sensor lies in the arbitrary scanning height which is not defined by the mechanical position of the sensor. The actual height of the scan plane zmap is depending on the available landmarks and needs to be specified in the map generation step. Unlike other approaches using grid maps, the map consists of two different kinds of features namely point
features and line features. A point feature is represented by its Cartesian position x , y and the feature height z .
{
MapP = ( x, y, z )
(i )
}
(2)
i =1,..., p
A line feature is represented by two points x1, y1, x2, y2 and the feature height z.
{
MapL = (x1 , y1 , x2 , y2 , z )
(i )
}
i =1,...,l
(3)
The actual map is the combination of all point features and line features.
Map = MapL ∪ MapP
(4)
As the world model that is used in this approach is a 2D map all feature heights z are constant over the whole map.
zmap = Mapz(i )∀i = 1,..., (l + p )
(5)
In contrast to regular 2D systems that can only represent and measure infinitesimal thin object surfaces the bottom view of an 3D object has got a finite dimension. As finite objects are represented by infinitesimal small point and line features in our approach the map uncertainty is increased. But as long as the features are located in the center of the object the given map errors sum up to zero. The 2D map constraint can lead to modeling problems in some kind of halls. But in general the 2D representation reduces computational costs and simplifies map generation. B. Sensor Model As it is described in [8] the Monte Carlo Localization uses a set of samples S to represent the robots believe of being at a position x.
{
S = ( x, y , ρ , w )
(i )
}
i =1,...,n
(6)
Whereas x and y represent a robot position, ρ the robot heading and w the sample weight. The sensor model is used to calculate this sample weight according to the probability of a being at the samples position, depending on the laser measurement L . The computation of the sample weight is done in four steps: The first step is to remove all measurement points from the 3D laser scan L that are not in a tolerance band around the map height zmap and thus not relevant for localization.
L' = {(x, y, z ) | (x, y, z )∈ L ∧ z = z map ± ztoll } (7)
This measurement set L' at map height is sampled down randomly to a fixed number of measurement points.
L' ' ⊆ L' with L' ' = const
(8)
This step reduces the computational costs and enforces a fixed execution time for each measurement step. To be able to compare the environment perception L' ' to the map it needs to be transformed into the world fixed map coordinate system. This transformation is depending on the robot position ( x, y, ρ ) and thus needs to be computed for every sample. i) L' '(map = trans(L' ' , S((xi ), y ,ρ ) )∀i = 1,..., n
(9)
Having these transformed laser measurements the weight S w of one sample i is calculated as the average weight of (i )
every measurement point j out of L' 'map . L ''
(i )
Sw =
∑ f ( L' '(
i, j ) map
j =1
, Map) ∀i = 1,..., n
L' '
(10)
Whereas the function f is used to calculate the weight of one measurement point depending on the minimum distance of this measurement point to any of the map features. The weight of each point is assigned according to the minimum distance and a zero centered Gaussian function g with the sensors variance
(
2 . σ sensor
) g (min(dist(L' '(
i, j ) f L' '(map , Map =
i, j ) map
∀k = 1,..., (l + p ) IV.
))
2 , Map(k ) , σ sensor
Figure 2: The experimental robotic platform ERIKA in a small factory hall.
) (11)
EXPERIMENTAL RESULTS
To prove the applicability of the developed system, extensive tests in three different environments have been undertaken. Two of these experiments have been carried out with the MoRob-Kit [11] in a small factory hall (see Figure 2) and insight the main cafeteria at the University of Hannover. The longest experiment has been a 5 day run with an autonomous fork-lift truck at the Hannover fair.
A. Factory Hall Initial test runs have been carried out in a small factory hall. As it can be seen in Figure 2 there are very few landmarks on the ground level that could be used for localization. Large distances to the surrounding walls (in comparison to the sensor range) and frequent rearrangements of equipment and goods inhibit stabile long term localization. In contrast to the ground level the ceiling offers clearly observable landmarks (see Figure 3). In this example it is sufficient to use features at a height of 8m +/- 20cm. This layer includes the lower side of the cross beams, the lightning installation and the outer walls. All these landmarks are represented as line features in the map. As the cross beams have got a width of 30cm the maximum map uncertainty is theoretically 15cm. As there is no specific way of considering the map uncertainty this value is added to the sensor variance. As the sensor variance is overestimated to 1m it includes range uncertainties, map uncertainties and uncertainties from scanning while moving. Offline tests with the collected data show that accurate position tracking is possible with down to 200 samples. If less samples are used large odometry errors due to bumps and small obstacles on the floor can lead to high position uncertainty. As the ceiling structure is symmetric global localization is not always possible. Global localization experiments are only successful if the robot is situated close to one of the corners. In this case the outer walls and the absence of ceiling structures outside the building allow global localization. The same problem occurs with a kidnapped robot. Large displacements make the algorithm converge to a local maximum. But as these local maxima are 6m and 8m away it never happened during online tests, driving at velocities of up to 1.8m/s.
Figure 3: The ceiling structure in the first experimental beams and light installation are used for localization
B. Mixed Features As we tested the localization system in different environments it came out that not all ceiling structures can be modeled adequately as line features. For this reason we decided to add point features to the map. A typical ceiling structure with mixed features can be seen in Figure 4. In this case the map contains the rectangular lights (point features) and walls (line features). Whereas the dimension of the lightning installation increases the map uncertainty to 25cm. The 3D point cloud that is shown in Figure 5 illustrate the 3D sensor input of the scene shown in Figure 4. The highlighted level of 4.5m +/- 20cm includes the lights as well as the walls that are used as landmarks. Independently of different map features the MCL parameters and the position tracking results are similar to the results presented in section A. Even though the lightning installation is symmetrical the site layout and the presence of walls makes global localization possible (requires at least 5000 samples).
Figure 4: Ceiling that can be modeled with a mixture of point features and line features
Figure 5: The raw measurement, a 3D point cloud. Highlighted points are used for localization
C. Fairground A final long term test of the localization system has been carried out with the RTS-STILL Robotic Fork-Lift (see Figure 1). This 3t fork-lift truck was extended to a flexible automatic guided vehicle AGV that is able to do variable pallet pick up and to navigate freely based on ceiling landmarks. During the logistics fair CeMAT in Hannover the robot operated 5days (8 hours a day) without navigation error or position loss. The landmarks used for localization in this environment are steel beams arranged in a regular grid (see Figure 6). As there is also a light and sound system installed some parts of the ceiling are occluded. But the remaining visible beams are still sufficient for accurate position tracking. Another challenge is the large odometry error the fork-lift produces when driving sharp turns. But also this uncertainty can be compensated if the variance of the odometry model is adapted.
Figure 6: MCL with ceiling structures: Line feature map (blue), sensor measurement (green) and sampled believe (red)
V. CONCLUSION With this paper we present a novel way of using ceiling structures for mobile robot localization. Our approach bases on a perceptual model that allows to incorporation 3D laser range data into Monte Carlo Localization (MCL). The advantage of using ceiling landmarks lies in the tolerance of
dynamic obstacles and rearrangements. Thus it is suitable for robust long term navigation in industrial environments. In this case the manual map generation is no major disadvantage. But anyway the initialization step could be simplified using SLAM techniques in the future. One future extension will be the use of multi layer or 3D ceiling maps. This extension would enable us to operate in an even broader range of halls. REFERENCES [1] F. Dellaert, D. Fox, W. Burgard, and S. Thrun, “Monte Carlo Localization for Mobile Robots”, International Conference on Robotics and Automation (ICRA), 1999. [2] A. Doucet, N. de Freitas, and N. Gordon, Sequential Monte Carlo in Practice, Springer, New York, 2001. [3] O. Wulf, M. Khalaf-Allah, and B. Wagner, “Using 3d data for Monte Carlo Localization in complex indoor environments,” European Conference on Mobile Robots (ECMR), 2005. [4] H. Gross, A. Koenig, H. Boehme, and C. Schroeter, “Vision-based Monte Carlo Self-localization for a Mobile Service Robot Acting as Shopping Assistant in a Home Store,” International Conference on Intelligent Robots and Systems (IROS), 2002. [5] P. Biber, and T. Duckett, “Dynamic maps for long-term operation of mobile service robots,” Robotics: Science and Systems Conference, 2005. [6] S. King, and C. Weiman, “Helpmate autonomous mobile robot navigation system,” SPIE Conference on Mobile Robots, 1990. [7] T. Fukuda, et al, “Navigation System based on Ceiling Landmark Recognition for Autonomous Mobile Robot,” International Conference on Industrial Electronics, Control, and Instrumentation, 1993. [8] S. Thrun, et al, “Probabilistic Algorithms and the Interactive Tour-Guide Robot Minerva,” International Journal of Robotics Research, 2000. [9] O. Wulf, K. O. Arras, H. I. Christensen, and B. Wagner, “2D mapping of cluttered indoor environments by means of 3D perception,” International Conference on Robotics and Automation (ICRA), 2004. [10]A. Nüchter, H. Surmann, K. Lingemann, J. Hertzberg, and S. Thrun, “6D SLAM with application in autonomous mine mapping,” International Conference on Robotics and Automation (ICRA), 2004. [11]B. Wagner, P. Hohmann, U. Gerecke, and C. Brenneke, “Technical framework for robot platforms in education,” International Conference on Engineering Education and Research, 2004.