shop on Visual Languages, pages 109-120, 1988. D. Ingalls, S. Wallace, Y.-Y. Chow, F. Ludolph, and K. Doyle. Fabrik: a visual programming envi- ronment.
SCIL-VP:
a multi-purpose
visual
environment Dennis
Koelma,
Richard
van Balen,
programming
* Arnold
Smeulders
University of Amsterdam
ABSTRACT This paper presents a multi purpose visual programming environment called SCIL-VP. In SCIL-VP programs are specified as data flow graphs consisting of arbitrary functions operating on arbitrary data objects. The environment enables a mixture of visual and textual programming. The visual programming interface is generated at runtime from information in a command description file. As a consequence the library of functions is easy to extend, even by laymen. The data objects are also extensible but this requires elementary programming skills. The setup of extensibility makes the environment independent of an application domain. It also opens the way to the combination of different application domains. 1
Introduction
The use of computers through specialized software packages is increasing rapidly to such a degree that a typical end-user is no longer able to make the step to programming a computer. Programming a computer in a conventional programming language, i.e. a textual one, requires a precise sense for logic which may not suit every end-user. Visual programming may help to bridge the gap by making programming easier. Experienced programmers may also benefit from the advantages visual programming has over conventional textual ‘programming. It enables them to concentrate more on solving the problem and less on writing the program. “This research wan supported
by STW project AW199-1691
Permission to copy without fee all or part of this material is granted provided that the copias are not mada or distributed for direct commercial advantage, the ACM copyright notice and the titla of the publication and its date appaar, and notice ia given
that copyingis by parmiasionof the Associationfor Computing Machinery.To copyotherwise,or to republish,requiresa fee and/or
specific
e 1992
ACM
permission. O-89791
-502-X/92
rOO02/l
188...$1.50
1188
Visual programming languages can be classified according to different taxonomies [1–3]. We will stay away from such a dkcussion but use the operational definition that the essence of visual programming is the use of visual expressions (such as drawings or icons) in the process of programming. Essentially different from visual programming is program visualization where the program is specified in a conventional, textual manner and the visual representation is used to illustrate some aspect of the program e.g. the algorithm, the data structures or the dynamic behavior of the program [4–9]. These approaches are not considered here as they require the program to be specified in an textual language and thus would not help the end-user in mastering the machine.
Visual programming languages have many advantages over textual programming languages [1, 2, 10–12]. Their two-dimensional layout and use of icons seem to be closer to the human way of thinking [13]. This then simplifies the translation of the representation used in the mind while thinking about a problem to the representation used in programming a problem. The shorter translation distance makes visual languages easier to comprehend, learn, use, and remember. The use of pictorial elements is important because frequently pictures convey more meaning than text: a single picture is often worth more than a thousand words (the converse may also be true). Furthermore, the combination of a twodimensional layout and the use of animation visualizes the execution of a program to help in debugging and program optimahzation. Finally, the two-dimensional layout facilitates the detection of potential concurrency in a program for parallel computation.
A disadvantage of visual programming is the large space it requires on the screen to create a program. This can be solved only partially through the use of scrolhng and/or various abstraction mechanisms such as a hierarchical structure in the program. This problem is most
upon which the presented visual programming environment was build. The concept of SCIL-VP is described in section 3. Some implementational aspects are described in section 4. Section 5 shows the development of a sample program. Section 6 concludes with a discussion of the presented environment.
obvious in the general purpose visual programming languages [14–22], the visual languages used as an interface to a textual programming language [23–25] and the concurrent visual programming languages [26–28]. They all use low level basic elements, functions and data objects, to develop programs. Although these languages can be used in different application domains, the low level basic elements often make it be too cumbersome to write a non-trivial program, especially for laymen. Combining the visual language with a textual language [29–32] reduces the space problem and allows for the use of textual programming in those part of a problem that are hard or impossible to solve using the visual language. However, textual languages require more programming skills and do not have the advantages of the visual languages so they can not assist the laymen. They are only of interest to an expert because experts like to have an escape possibility from the particular language they are using.
2
The idea for SCIL-VP originated in the SCIIL environment [53, 54]. SCIL is a multi-layer software development environment based on a C interpreter. It gives the user easy access to functions of a software library on multiple levels. At the first level, functions from a library can be called from within the interpreter by typing ordinary C-function calls and pressing the return key. Functions can also be executed through a command expander. At this level the user can abbreviate function names, disregard the proper C-syntax, ask for parameters and rely on a mechanism that supplies default values for parameters that were left out. After the user presses the return key, the command is expanded into a legzd C-statement and executed. At the third level functions can be picked from a menu, resulting in a dialogue box. The user can alter the parameters of the function in this dialogue box and execute the function by pressing the Do-It button. All levels can be used simultaneously. The user interface is built at start-up from a command description file consisting of a menu tree and a description of every function with its arguments. All levels use the command description file to access the functions of a library, thus by adding a description of a function to this file the function can be used at each level.
Other visual programming environments use high level basic elements to allow for the development of small, yet powerful, programs. These environments are used in database processing [33–37], in image processing [38– 40], in educational software [41-44], as a command shell [45, 46], in user interface design [47], in expert systems [48], in security systems [49], in matrix computation [50], etc. The disadvantage of these environments is that they can only be used in the small application domain they were developed for. The visual programming interface is hard coded and thus the environment is not easily modified and not extensible to other application domains. It is felt that visual programming is not generally accepted because the approaches mentioned above all have serious drawbacks: writing a program in a general purpose visual programming language is too cumbersome and using specialized visual programming environments limits the use to a small application domain. Combining the approaches could be a solution. The visual programming environment presented here adheres to the concept of high level basic elements in the construction of programs since they are essential for end-users. To avoid being trapped in a small application domain the environment was made easily extensible for new basic elements. To give the expert his escape possibility the combination with a textual language is also provided for. The KHOROS system [51, 52] uses a similar approach but requires the basic elements to be developed especially for the environment. This makes it more difficult to add existing software libraries to the environment, Section
2 gives an overview
The SCIIJ environment
The various levels of the SCIL environment offer an increasing level of support for inexperienced users but at the highest level the programming possibilities of the C interpreter level disappear. Combining ease of use and programmability in some way would allow inexperienced users to create non-trivial programs quickly by using the high level functions from a library. This observation led to the development of the presented visual programming environment. This new layer has both a high level of support for an inexperienced user and has programming capabilities. 3
Design
of SCIL-VP
The intent of SCIL-VP is to create small, yet powerful programs by combining high level functions from a user specified library from one or more application domains. This intent implies that the visual language must be able to express an operation on data clearly. The language is not to bean algorithmic language because these
of the SCIL environment
1189
kinds of languages require ‘the inexperienced user to focus too much on the process of programming. This can lead to what is termed “analysis paralysis”: the means become the ends as you forget what you wanted to get out of the computer and become wrapped up in the process of getting it out [55]. These observations lead to
the development of a visual program. These worksheets should also be able to reflect the hierarchical structure of a program. Upon completion of the development of a visual program it should be possible to execute the program without the visual programming environment.
the choice
4
of a data flow language.
The data flow language port
the
structures
use
used in SCIL-VP
of control
have been
15, 17, 29], it is hard,
structures.
added
does not sup-
Although
control
to data flow languages
if not impossible,
to make
Implementation
SCIL-VP wax written in C and developed on Sun workstations using the X-window system.
[14, them
flexible enough and still easy to use. The data flow language is combined with the textual language C to give a more experienced programmer the possibility to address problems that cannot be solved using the controllers data flow language only. It also gives him the possibility to escape from the visual language in those parts of a problem that can be expressed more clearly in a textual language. The functionality of the system is provided by the functions from the user specified library (or libraries). The functions are the building blocks from which the user starts to construct a visual program. To keep the environment application independent, the addition of a new library of functions should be simple, where only a compact description of each function has to be supplied. This description includes the name of the function and a list of parameters, if present. The only restriction imposed upon the functions by SCIL-VP is that they must be C-callable functions. For most systems this does not necessarily imply that the functions are written in C. There should be no restrictions to possibilities of a function for user interaction: it should have normal access to the standard input/output of a terminal and to the window system. The use of arbitrary functions requires the support of arbitrary data objects. Therefor, the environment is designed such that it is extensible in its data objects. To accomplish this the environment makes use of only a limited number of functions in the communication with the data objects. A data object should be able to represent anything as long as it can be accessed through (a reference to) an object. There should be no restriction to the complexity of an object.
4.1
The application independency of the SCIL-VP environment is largely due to the command description file. In this file the user can speci~ a menu tree with functions. The menu tree can be specified by naming a menu together with its parent. For example, the line “ $Manipulation $Image” means that the menu Manipulation is a submenu of the Image menu (the dollar sign stands for menu). The functions from the user-specified library (or libraries), which make up the functionaUty of the SCIL-VP system, are also described in this file. The description of each function consists of the following items:
func The name of the function. The (subgroup
(submenu
the function is asso-
ciated with. bitmap The icon of the function,
This is the name of the file with a bitmap of the icon of arbitrary dimensions. The file is created with a standard X bitmap editors. If no file is specified an icon will be created showing the name of the function as a text string.
ret-val The type of the data object that is the return value of the function. This item does not have to be specified if the return value is to be ignored. a.rgs The list of parameters of the function. The description of each parameter consists of the following items:
The data object type of the parameter, e.g. integer, string.
data.type
A visual and hierarchical overview of the functions is to be provided by the library handler. This overview should reflect the ordering of the functions in groups and subgroups. As always the (sub) groups and the functions are represented by icons. The user should be able to use multiple worksheets
Functions
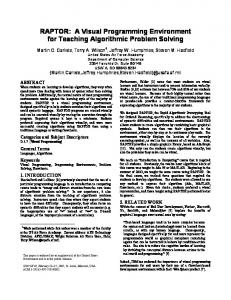
par-type The type of the parameter. Four types of parameters exist: input, output, input/output and control parameters. The input parameters are shown aa a pin on the left side of the function (see figure 1). The output parameters are shown on the right side. The input/output parameters have pins on both
in
1190
n
I
library, for example, these entities are images. A data object is (a reference to) a data structure. This structure must contain all data relevant to an entity but can be of arbitrary complexity. An image object, for example, does not only contain the image data but also other information like the name of the image, its sizes, its type, a reference to the window it is displayed in,
I
ermim3x3
etc. Figure 1: An example sion9z3
of an icon of the function
sion of SCIL-VP: The environment
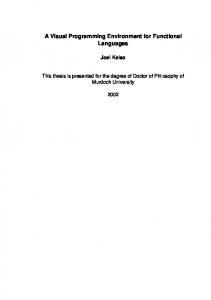
FUNC erosion3x3 MENU morphology ICON erosion3x3.bitmap ARGS image in B-image out B-int in 11418 choice con 8 switch con Off On
Off
Figure
of the function
2: The description
Four types of data objects
ero-
Input binary image Output binary image Number of iterations Connectivity Set edge pixels
Beside these three functions two more functions can be added to generate or monitor a data object, but these functions are not compulsory. These functions can be used to start and end a data flow graph.
erosion9z9
4.3
The default value of the parameter.
min
The minimum admitted value of the parameter or a set of legal values.
max
The maximum eter.
prompt
Figure tion.
admitted
Short description
2 gives an example
value of the param-
of a func-
The command description file is a plain ASCII file that can be altered by any text editor. Altering the command description file does not enforce recompilation of the program because the file is read during the SCIL-VP environment startup. 4.2
Data
objects
The data objects brary of functions
represent the entities on which the liis operating. In an image processing
1191
Library
handler
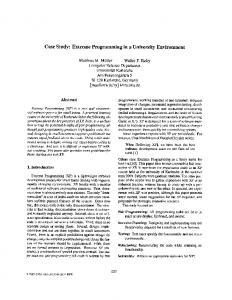
The library handler (see figure 3) gives a hierarchical overview of the functions known to the environment. Groups are distinguished from functions by their thick border. At the top of the window the path to the current group (huge in figure 3) is shown. In the remainder of the window the subgroups and functions of the current group are shown. The user can move to another group by selecting its icon in the path to the current group or by selecting its icon in the current group. A function can be selected from the library by clicking its icon (convert in figure 3). 4.4
of the parameter.
of the description
ver-
its communication with the data objects. These functions are to create, copy and destroy a data object. A new type of data object can be defined by providing these 3 functions for the specific type as a C-program. By taking the C-code of the functions of an existing type of data objects as an example, it is considered not to be too difficult to add new types.
sides of the function. Control parameters are parameters that are not altered very often. They are not represented by pins to avoid cluttering of the screen but they can be altered through a dialogue box at any moment. The presence of control parameters is indicated by a little square at the top of the function. default
are defined in the current
integers, doubles, strings and images. makes use of only three C-functions in
Worksheets
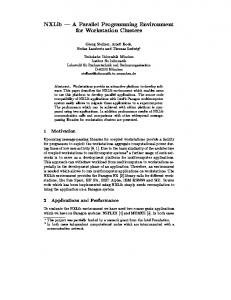
A worksheet (see figure 4) consists of a control panel and a workspace. Only part of the workspace is visible as indicated by the scroll bars. The visible part of the workspace can have any size as long as it fits on the screen. The size of the workspace itself is unlimited. 4.4.1
The
worksheet
editor
In the editor the user can select objects (functions, connections, pins and comments) by pointing at them and pressing the left mouse button. When an input pin and output pin are selected they are connected by a straight, thick line. The straight line is used to avoid screen clut-
Q
n
r
n 1
lM
m “4, mOn_l nt_l
i
nput_l nt
Figure 4: Example of a worksheet
l!!!!!! KJ
terin~. An attempt to make a connection results in an er;or when the ;elected pins have incompatible data types. An output pin can be connected to many different input pins, but only one connection is allowed on an input pin.
b
30t
Image
lEli@REl15mEEl
The
editor
also has a series
of special
edit commands.
These commands are represented by the icons above the workspace. They can be executed by first selecting the icon of the command
and then the objects
the command
has to be executed on or vice versa. Both methods exist only when the nature of the command allows for it. Examples of the edit commands are:
new
In this mode a copy of the selected function in the library is placed on the worksheet when the left mouse button is pressed.
info
The user can ask for help or information on an object. When a function is selected the standard SCIL help window pops up, showing information about the function.
compose Several functions can be grouped together to form a new one. The user is allowed to create a bitmap of arbitrary dimensions for the new function. In this way a hierarchical structure is created. User defined functions behave in exactly the same way as all other functions do. Figure 3: An example of the face of the library handler decompose A user defined function can be split again into its original components.
1192
udf-edit A user defined function can be edited in a separatewindow. The editor behaveslike a normal worksheet with the same editing capabilities. It also allows the user to add or remove parameters of the function. data
safe A data safe can be placed on a connection to keep the data valid. The use of this function is explained in more detail in the next section.
comment The user can add comments to a function. These comments are displayed below the icon of the function. These comments (and the function names below the icons) can be made invisible by a system option. C-icon Add a C-icon to the worksheet section 4.4.3.
4.4.2
as described
in
Execution
Once the program has been composed it can be executed by pressing the start button. The starting point of the execution can be influenced by selecting a function before pressing this button. Since the program is interpreted
the execution
in which the functions data valid
and demand data
starts immediately.
The order
are executed is a combination
driven.
on all input
If there pins
then
is a function
that
it is executed
driven). If a function does not have valid input pins it asks its predecessor for data
data (this
of has (data
on all is the
demand driven portion). The predecessor will try to create the data or pass the demand to their predecessor. After the function has been executed all data at its input
pins is destroyed,
needs
it.
unless
some other
function
still
The function under execution is highlighted so the user can follow the execution. Optionally the executed function is positioned at the center of the visible part of the workspace. The execution can be done in a continuous mode or in step mode. This mode can be changed during execution. The execution stops if there are no more functions to be executed, if there is a loop in the program, or if the user presses the stop button. Once the program has halted the worksheet returns to the edit mode. The execution of the program can be continued later if the program has not been altered in the mean time. 4.4.3
Combining
with
C-code
The visual language can be combined with the textual language C by means of the C-icon. This icon can be used as a normal function in the data flow program.
1193
Once the C-icon is reached, the associated C-code associated is executed, The C-icon is manipulated by clicking the right mouse button on the function. This will pop up a menu that allows the user to add pins, destroy pins, and change the C-code of the function.
The C-code may contain variable declarations and CThe data of the input and output pins statements. is available through predefine variables, e.g. INPUT1 contains the data of the first input pin. Once a visual program has been developed and working correctly it can be saved as an ordinary C-program. This allows the user to execute the program without the SCIL-VP environment. 5
Sample
session
This section describes the development of a sample program. The program shows how an image with nonuniform illumination can be segmented with global thresholding. The meaning of the program may not be entirely clear but that does not matter at this point. First the image must be loaded so the readfile function is selected from the library and placed on the worksheet. The wadfile function has a control parameter that specifies the file to be read. Selecting the square button above the icon generates a dialogue box that can be used to alter the control parameter (figure 5). To see the image a monitor can be connected to the readjile function. The connection is made by selecting both pins (figure 6). Figure 7 shows that global thresholding is not possible on the original image. First the shading must be removed from the image. This is done here by subtracting the result of a function called grey value opening (an erosion followed by a dilation) from the original image. After the shading correction the image is segmented using a global thresholding function (figure 8). The components for the shading correction can be combined into a single function to create a hierarchical structure in the program (figure 9). The user specifies a name for the new function and creates a bitmap to represent its icon. The function can be edited in a separate window (figure 10). When a part of the program is working correctly it does not have to be executed over and over again during the development of the rest of the program. This can be avoided by placing a data safe on the connection between the working part and the rest of the program. This data safe will keep the data cm the connection valid. For example, placing a data safe on the connection between shading. correction and isodata-threshold, and starting the execution at isodata-threshold will pre-
vent shading. over again. 6
correction
from being executed
[5] V. Haarslev
and R. Moller. Visufllzation of experimental systems. In Proceedings of the 1988 Workshop on Visual Languages, pages 175–182, 1988.
over and
Discussion
[6] H. Lieberman.
A three-dimensional representation for program execution. In Proceedings of the 1989 WoTkshop on Visual Languages, pages 111116, 1989.
SCIL-VP allows users to write non-trivial programs by combining arbitrary, high level functions into a data flow graph. The use of data flow graphs in programming enhances the understanding of the operation of a program through its two-dimensional layout and the use of icons. The high level functions in combination with visual programming help to keep the mind of the (inexperienced) user on solving the problem instead of concentrating on the act of programming. The programs have the same expressibility as controllers data flow graphs. In addition, the integration of C-code within an icon in the data flow graph gives a more experienced user the possibility to use the best of both worlds. A notorious drawback of visual programming is the large space needed on the screen. This cannot be solved completely with a hierarchical structure in the program as the overall structure of the program remains unclear. The application of the image processing library in this paper has shown that it may be hard to create a pictorial abstraction of a function. It has also shown the importance of good icons. Good icons can help in understanding and remembering but bad icons lead to confusion.
[7] S. P. Reiss, S. Meyers, and C. Duby. Using GELO to visualize software systems. In Proceedings of the Second Annual Symposium on User Interface Software and Technology, pages 149–157, 1989. [8] M. H. Brown and R. Sedgewick.
rithm
animation.
ceedings
ACM
SIG GRAPH
A system for algo-
ComputeT
GTaphics
‘84), pages
177–186,
(Pro-
July
1984. [9] M. H. Brown. Exploring
algorithms using Balsa-II. IEEE ComputeT, pages 14-36, May 1988.
[10] E.
P. Glinert,
tyre.
Exploring
M. E. Kopache,
and D. W. McIn-
the general-purpose
of Visual Languages pages 3–39, March 1990.
ive.
Journal
visual
alternat-
and Computing,
[11] G. Raeder.
A survey of current graphical programming techniques. IEEE Computer, pages 11-25, August 1985.
[12] S. L. Tanimoto
The SCIL-VP environment distinguishes itself from other visual programming environments in the possibilities to extend the environment with new functions. SCIL-VP is easily extended due to the use of the command description file and due to the restricted number of data communication functions. This enables the use of SCIL-VP in different application domains. It also opens the way to combining the functionality of various application domains.
and E. P. Glinert. Designing iconic programming systems: representation and learnability. In Proceedings of the 1986 WoTkshop on Visual Languages, pages 54-60, 1986.
[13] D. C. Smith.
environment. June 1975.
[14] P. T. Cox, F. R. Giles, and T. Pietrzykowski.
Prograph: a step towards liberating programming from textual conditioning. In Proceedings of the 1989 pages 150-156, Workshop on Visual Languages, 1989.
REFERENCES [1] N. C. Shu.
Reinhold
Visual programming. Company Inc., 1988.
PygmrAon: a creative programming Report no. stan-cs-75-499, Stanford,
Van Nostrand [15] D. N. Smith.
Visual programming in the interface set. In Proceedings of the 1988 Workpages 109-120, 1988. shop on Visual Languages,
construction [2] S.-K. Chang. Visual languages, a tutorial and survey. IEEE Software, pages 29–39, January 1987.
[16] D. Ingalls,
S. Wallace, Y.-Y. Chow, F. Ludolph, and K. Doyle. Fabrik: a visual programming environment. In 00PSLA ’88 Conference Proceedings,
[3] B. A. Myers. Taxonomies of visual programming and program visualization. Journal of Visual Languages and Computing, pages 97–123, March 1990. and A. Sareen. Au[4] B. A. Myers, R. Chandhok, tomatic data visualization for novice pascal proIn Proceedings of the 1988 Workshop grammers. on Visual Languages, pages 192–198, 1988.
pages
176–190,
1988.
Visual [17] T. Ichikawa and M. Hirakawa. - toward realization of user-friendly environments.
In Proceedings
puter Conference,
1194
programming programming
.2nd Fall Joint Compages 129-137, 1987.
r9dlila Filename:
trui . i% Im
Figure5:
Anexample
ofadialogue
box to set a control parameter
I
Figure
6: A connection
between
two functions
~sodrnta-thrsshold Global t.keaholdlm of ttw miElnal idoesmt Pracke h dealrrd result.
Figure 7: Global thresholding
1195
of the original image
:$+:. :::.. ,.,:. J? .,
A
,:,’.,:
.,.;.:...
mon-image
TtwCrlgiml lMu@.
Global thwtnldins of the celglnal inase does mt Wc4.sa tha dmimd I’e3ult.
isodata_threshoLd IWtm sbdlng COrrectlm the hose Cal be saWMtel uslrw 91cM ttresimldlns
grey_erOsion
Figure 8: Global thresholding
readfile
after shading correction
isodata_threshold Clcbal thm+mldim of the W1911M1 iRO@ mt ~ tha &slrad -It. *
Rfter $hdtng M-rOctlm thelnage cm Li950#wk0d wlra
Figure 9: A user defined function
1196
global
thwholding.
Figure 10: The udf-editor
The programming language aspects [18] A. Borning. of ThingLab, a constraint-oriented simulation laboratory. ACM Transactions on Prwgmmming Lanpages 353-387, October 1981. guages and Systems, [19] A. Borning. Graphically defining blocks in ThingLab, Human-Computer 2(4):269-295,
[26]
M.-C. Pong.
A graphical language for concurrent In Proceeding~ of the 1986 Workshop pages 26-33, 1986. Languages,
programming. on Visual
[27] T. Ae, M. Yamashita, and W. C. Cunha. Visual user-interface of a programming system MOPS2. In
new building
Proceedings of the 1986 Workshop guages, pages 44–53, 1986.
Intemction,
1986.
[20] M. C. Pong and N. Ng. PIGS - a system for programming with interactive graphical support. Software - Practice and Experience, pages 847-855, September 1983. [21] S. P. Reiss. PECAN: program development systems that support multiple views. IEEE Transactions on Software Engineering, pages 276-285, March 1985.
The FPG language: [2s] P. D. Stotts. ming for concurrent computation. of the 1988
International
pages 72-79,
Processing,
report.
Lan-
visual programIn Proceedings
Conference
on Parallel
1988.
[29] S. Matwin and T. Pietrzykowski.
liminary
on Visual
Computer
Prograph:
Languages,
a pre-
10(2):91-
126, 1985. [30] E. P. Glinert.
Towards “second generation” interactive, graphical programming environments. In Proceedings of the 1986 Workhop on Visual Languages, pages 61–70, 1986.
[22] S. P. Reiss. Working in the Garden environment for conceptual programming. IEEE Software, pages 16-27, November 1987. [23] M. Edel. The Tinkertoy graphical programming environment. IEEE l%ansactions on Software Engineering, pages 1110-1116, August 1988.
[31] M. E. Kopache and E. P. Glinert.
C2 : a mixed textual/graphical environment for C. In Proceedings of the 1988 Workshop on Visual Languages, pages 231–238, 1988.
[24] G. Cattaneo, A. Guercio, S. Levialdi, and G. Tortora. Icordisp: an example of a visual programming language. In Proceedings of the 1986 Workshop on Visual Languages, pages 22-25, 1986.
[32] K. Kojima,
Y. Matsuda, and S. Fhtatsugi. LIVE integrating visual and textual programming paradigms. In Proceedings of the 1989 Workshop on Vistiai Languages, pages 80-85, 1989.
PAS[25] J. L. Diaz-Herrera and R. C. Flude. CAL/HSD: A graphical programming system. In IEEE Proceedings COMPSA C, pages 723-728, 1980.
[33] K.
Tsuda, M. Hirakawa, M. Tanaka, and T. Ichikawa. IconicBrowser: an iconic retrieval system for object-oriented databases. In Proceedings
1197
of the 1989 Workshop 130-137, 1989.
on Visual
pages
Languages,
[34] B. Czejdo,
D. Embley, and V. Reddy. A visual query language for an ER data model. In Proceeding
pages
of the 1989 Workshop
on
Visual
Languages,
165–170, 1989.
[46] T. DeMarco and A. Soceneantu. Syncro: a dataflow command shell for the Lllith/modula computer. In Proceedings of the 7th International Conference on Software Engineering, pages 207-213, 1984. [47] R, J. K. Jacob. A state transition diagram language for visual porgamming. IEEE Computer, pages 51– 59, August
[35] N. C. Shu.
FORMAL: a forms-oriented, directed application development system. Computer, pages 38-49, August 1985.
visualIEEE
[48] M. A. Musen,
Visual reasoning for information retrieval from very large databases. In Proceedings of the 1989 Workshop on Visuai Languages, pages 1-6, 1989.
VIVA:
a visual
language
for im-
Journal of Visual Languages pages 127-139, June 1990.
Computing,
[41] E. Corten, H. J. W. Spoelder, F. H. Ullings, F. C. A. Green, and L T. Young. SIGNOR a tool for visualization of concepts of system and signal theory. In Proceedings of the 1989 Workshop on Visual Languages, pages 189-192, 1989. [42] E. P. Glinert active
and S. L. Tanimoto.
graphical
Computer,
programming
Pitt:
environment.
pages 7-25, November
an inter-
IEEE
E. H. Shortliffe. knowledge
of the 1986
for
Work-
pages 167–178, 1986.
Languages,
86–91,
Workshop
on Visual
Lan-
1989.
- a graphical
for matrix
constraints. on Visual
programming
processing
based
envi-
on logic
and
In Proceedings of the 1988 Workshop 1988. Language9, pages 137-143,
[51] C. S. Williams
and J. R. Rasure. A visual language processing. In Proceedings of the 1990 pages 86-91, 1990. on Visual Languages,
for image Workshop
[521 J. R. Rasure
and C. S, Williams. An integrated visual language and software develop-
data
flow
ment
environment.
and Computing,
Journal of Visual Languages pages 217–246, September 1991.
[53] T. K. ten Kate, R. van Balen, A. W. M. Smeulders, F. C, A. Green, and G. A. den Boer. SCILAIM: a multi-level interactive image processing environment. Pattern Recognition Letters, pages 429–441, June
1990.
[54] University
of Ansterdam
ge Processing and SCIL.Image manual,
Pattern
for the
Centre
Recognition
of Ima(CBP).
July 1991.
[55] G. D. Brown and D. H. Sefton. The micro vs. the applications logjam. Datamation, pages 96-104, ;anuary
by re-
[44] J. Roberts, J. Pane, M. Stehlik, and J. Carrasquel. The Design View: a design oriented, high-level visual programming environment. In Proceedings of the 1988 Workshop on Visual Languages, pages 213-220,
In Proceedings
MPL
ronment
1984.
[43] W. Finzer and L. Gould. Programming hearsal. Byte, pages 187-210, June 1984.
and
of procedural
of the 1989
pages
[50] R. Yeung.
and
[40] R. P. Blanford and S. L. Tanimoto. The PyramidCalc system for research in pyramid machine algorithms. In Proceedings of the 1986 Workshop on Visual Languages, pages 138–142, 1986.
system.
Proceedings
1985.
age processing.
an expert
guages,
[38] S.-K. Chang,
[39] S. L. Tanimoto.
specification
[49] A. Heydon, M. W. Maimone, J. D. Tygar, J. M. Wing, and A. Moormann Zaremski. Mir6 tools. In
[37] S.-K. Chang.
E. Jungert, S. Levialdl, G. Tortora, and T. Ichikawa. An image processing language with icon assisted navigation. IEEE Z%ansactions on Sofiware Engineem”ng, pages 81 1–819, August
L. M. Fagan,
Graphical
shop on Visual
[36] G. Rogers.
Visual programming with objects and relations. In Proceedings of the 1988 Workshop on Visual Languages, pages 29–36, 1988.
1985.
1988.
[45] K. Borg. Visual programming and UNIX. In Proceedings of the 1989 Workshop on Visual Languages, pages 74-79, 1989,
1198
1984.