Hindawi Publishing Corporation Advances in Tribology Volume 2016, Article ID 4931502, 10 pages http://dx.doi.org/10.1155/2016/4931502
Research Article The Segmentation of Wear Particles Images Using 𝐽-Segmentation Algorithm Hong Liu, Haijun Wei, Lidui Wei, Jingming Li, and Zhiyuan Yang Laboratory of Oil Analysis, Shanghai Maritime University, 1550 Lingang Avenue, Shanghai 201306, China Correspondence should be addressed to Haijun Wei; haijun
[email protected] Received 30 October 2015; Revised 24 March 2016; Accepted 31 March 2016 Academic Editor: Patrick De Baets Copyright © 2016 Hong Liu et al. This is an open access article distributed under the Creative Commons Attribution License, which permits unrestricted use, distribution, and reproduction in any medium, provided the original work is properly cited. This study aims to use a JSEG algorithm to segment the wear particle’s image. Wear particles provide detailed information about the wear processes taking place between mechanical components. Autosegmentation of their images is key to intelligent classification system. This study examined whether this algorithm can be used in particles’ image segmentation. Different scales have been tested. Compared with traditional thresholding along with edge detector, the JSEG algorithm showed promising result. It offers a relatively higher accuracy and can be used on color image instead of gray image with little computing complexity. A conclusion can be drawn that the JSEG method is suited for imaged wear particle segmentation and can be put into practical use in wear particle’s identification system.
1. Introduction With the development of complex machines, the demand for effective and economic maintenance schedules has grown rapidly these years. Condition-based maintenance is an idea of using real-time data to prioritize and optimize maintenance resources instead of regular periodic inspection. Observing the state of the system is known as condition monitoring. Such a system will determine the equipment’s health and act only when maintenance is actually necessary [1, 2]. Sounds, vibrations, and temperatures are informative features often measured to estimates the machine condition, yet wear particle analysis holds its own advantages [3]. Wear particles (or wear debris) are generated as components move relative to each other. The parameters that define wear particles such as their quantity, shape, and size reflect the wear modes, wear mechanisms, and severity associated with their generation [4]. Wear debris contained in the lubrication oil carry detailed and important information about the condition of the machine [5]. The particle characteristics are sufficiently specific so that the operating wear modes within the machine may be determined, allowing prediction of the imminent behavior of the machine [6, 7]. Wear particles are usually categorized by their wear modes such as adhesive particles or fatigue particles.
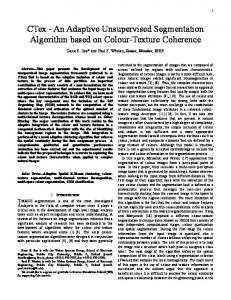
In practice, wear particles are usually gathered by ferrography, which uses a high-gradient magnetic field to attract and hold particles from a fluid sample as it flows down a specially prepared microscope substrate [8]. The schematic of ferrography are demonstrated in Figure 1. The ferrography technology allowed wear particles to be observed and analyzed for the first time. In the early days of condition monitoring, practitioners determined the wear condition merely by the amount of wear debris. The development of ferrography provided a wide array of studies that helped identify the characteristics of wear particles and the mechanisms by which they generated. The problem with currently employed ferrography techniques is that the particle morphology assessment, particle classification, and machine status evaluation rely heavily on human expertise, which is time-consuming, costly, and not always reliable [1]. In recent years, tribologists and engineers made considerable efforts to build autoclassification system for imaged wear particles. Such a system would need both tribology research and image processing techniques. Most of the work focused on how to identify wear particles [1]. It is reported that antcolony algorithm [9], deterministic tourist walking [5], and fuzzy 𝑐-means algorithm [10] can be used to identify wear particles. Also, in [11], attempts had been made to identify
Advances in Tribology
Distance from exit end (millimeters)
2
50 Entry region where fluid first touches down on the ferrogram
40 30
Nonwetting barrier
20 10
Wear particles near exit are submicroscopic
0 Exit end
(a) Analytical ferrogram
Drain tube
(b) Deposition pattern on a ferrogram
Figure 1: Picture of analytical ferrogram and its schematic diagram.
adhesive fatigue and abrasive particles using area, perimeter, and elongation parameters; study shows that these simple parameters can be effective for certain types of wear particles such as abrasive particles and sphere like fatigue particles. The same research group also compared the different dimension reduction methods and texture features [12, 13]. In the study by [14], fractal dimension had been used to analyze wear debris surface. In the study by [15], a small online monitoring system for gearbox have been built and gray level and integrated morphological features have been used for wear particles’ image segmentation. The possibility of using a pattern recognition system for wear particle analysis without the need of a human expert holds great promise in the condition monitoring industry. Still, there are several problems that need to be resolved. One of the first and most important of them is autosegmentation for wear particles’ image. In order to autoclassify wear particles, one must first demarcate the object appearing in digital images. The accuracy of segmentation will directly affect the subsequent feature extraction, classification, and identification of wear particles. Therefore, wear particle segmentation is the vital first step for wear particles’ image analysis. However, the existing segmentation methods are not adaptable for complicated ferrograph images for two reasons: (1) Wear particles deposited on the glass substrate often have complicated background. Large abnormal particles such as severe sliding particles or chunky fatigue particles are main target yet they are surrounded by countless microparticles which often share similar color, making accurate segmentation by threshold technique a hard job. (2) Since the pictures are microscopic image, the edges of the object are frequently blurred, leading to difficulty in segmentation by edge detection algorithm. As demonstrated in Figure 2(b), these particles have complicated texture features and their background are filled
with microparticles and some of the edges were blurred. Even in the area of computer vision, segmentation is actually one of the central and most difficult practical problems [16, 17]. Yet until recently, not much work has been done. In [18], gray level and integrated morphological features are used to segment the agglomerated particles, yet the background of the image is rather simple and clean; algorithms adaptive to complicated background shall be tested. It is reported in [9] that ant-colony algorithm can be used to complete the task, yet computing efficiency needs to be improved. Li et al. used morphological erosion and dilation operations on binary images; the edge of a single wear particle could be detected with the Laplace operation [19]. Yet how to get accurate binary image in itself is a difficult problem. In this research, attempts have been made to solve the problems mentioned above, improving the result of automatic analysis for ferrography images. We represent the improved JSEG algorithm for wear particles’ color images. The object of this study is to see whether this algorithm can be used in particle image segmentation. Parameters were tested according to the characteristics of wear particles. A computer program is developed to preprocess images. The image samples used are generated using tribology testing machines. Experiment results showed that JSEG is suitable for wear particle’s image segmentation.
2. Experiment and Method 2.1. Collection of Wear Particle’s Images. Wear testing is often carried out to study tribological performance of certain materials or lubricants. In this research, however, it is done for collecting wear particles and building a database of their images. The adhesive wear testing was carried out on a pin-ondisk machine which consists of a horizontal rotating disc and a deadweight-loaded pin. The stationary pin is stainless steel (hardness 175 HV) and the disk is made of cast iron
Advances in Tribology
100 𝜇m
3
Opt.M. 500x
100 𝜇m
(a)
Opt.M. 500x
(b)
100 𝜇m
Opt.M. 500x
(c)
Figure 2: Wear particles’ images demonstration.
(300 HV). Pin and disc diameters were 10 mm and 60 mm, respectively. Disc average roughness was Ra = 2.5 𝜇m. The tests were conducted in a laboratory air, the temperature is 22∘ C, and relative humidity is 50%. The load is 10 kg so the contact pressure is around 1.27 MPa. The rotating speed is set to 500 rpm and the time is set to 90 minutes, giving an approximate total sliding distance of 7500 m. A solvent resistant PVC ring is fitted over the circumference of the disk to block the wear particles. In order to simulate boundary lubrication, a layer of CD40 lubricant is applied to the disk in the beginning. The experiment shows that the lubrication reduced the friction coefficient from average of 0.4 to no more than 0.2. After the experiment, the disk was washed with acetone and the wear particles were gathered with ferrography.
The fatigue wear particles were generated by four-ball testing machine. The material of the ball is GCr15 (hardness 700 HV). Maximum load and speed were set to 1800 N and 300 r/min. In order to generate fatigue wear particles the time is set to 6 hours. Before the test, the balls should be ultrasonic cleaned in petroleum ether. The particles generated were collected and then ferrography was used to place them on a microscopy glass slide. To expand the database and make the result more robust, particles from real-world machines’ lubricant system were also collected using ferrography. 2.2. JSEG Algorithm Introduction. The JSEG algorithm [20] can be separated into two parts. In the first part, colors in the image are quantized to several representative classes that can be used to differentiate regions in the image.
4
Advances in Tribology Wear particles’ color image
Here, 1D distances 𝑑𝑖 (𝑛) for Fisher’s discriminant estimation [21] are used. The criterion to be maximized is
Peer group filtering color space quantization
2 𝑎 (𝑖) − 𝑎2 (𝑖) 𝐻 (𝑖) = 12 , 𝑖 = 1, . . . , 𝑘, 𝑠1 (𝑖) + 𝑠2 2 (𝑖)
Color class-map
(4)
where
Spatial segmentation J-image calculation J-image
𝑎1 (𝑖) =
1 𝑖−1 ∑𝑑 (𝑛) , 𝑖 𝑗=0 𝑗
𝑎2 (𝑖) =
𝑘 1 ∑𝑑𝑗 (𝑛) , 𝑘 + 1 − 𝑖 𝑗=𝑖
Region growing
Segmentation results
Figure 3: Schematic of the JSEG algorithm for particles’ image.
(5)
𝑖−1
2 𝑠1 (𝑖) = ∑ 𝑑𝑗 (𝑛) − 𝑎1 (𝑖) , 2
𝑗=0
This quantization is performed in the color space without considering the spatial distribution of the colors. Then, the image pixel values are replaced by their corresponding color class labels, thus forming a class-map of the image. The classmap can be viewed as a special kind of texture composition. In the next part, spatial segmentation is performed on class-map without considering the corresponding pixel color similarity. It is difficult task to analyze the similarity of the colors and their distributions at the same time. The schematic of the algorithm is shown in Figure 3. In order to remove noise in color image, filter is used such as vector median filter or directional distance filter. These traditional filters are implemented uniformly across the whole image regardless of the condition each pixel. Thus these filters always modify pixels that are not corrupted by noise. In this research, a nonlinear algorithm called peer group filtering is used to improve the quality of segmentation. Let 𝑥0 (𝑛) refer to an image pixel vector (in color image it contains three values: red, green, and blue) which characterizes the color information at position 𝑛 centered in a 𝑤 × 𝑤 window. Sort all the pixels in the window according to their distances to 𝑥0 (𝑛) in ascending order and denote them as 𝑥𝑖 (𝑛). The Euclidean distance measure is used here: 𝑑𝑖 (𝑛) = 𝑥0 (𝑛) − 𝑥𝑖 (𝑛) , 𝑖 = 0, . . . , 𝑘, 𝑑0 (𝑛) ≤ 𝑑1 (𝑛) ≤ ⋅ ⋅ ⋅ ≤ 𝑑𝑘 (𝑛) .
(1)
(2)
The filtering then can be done to the peer group members only instead of the pixels of whole window and thus can avoid edge blurring. The problem left is how to determine the appropriate size 𝑚(𝑛) for each peer group based on local statistics. In this study, a threshold 𝑇(𝑛) is set such that 𝑑𝑚(𝑛)−1 (𝑛) ≤ 𝑇 (𝑛) , 𝑑𝑚(𝑛) (𝑛) > 𝑇 (𝑛) .
𝑗=𝑖
The method calculate 𝐻(𝑖) for each 𝑖 and finds the cut-off position where 𝐻(𝑖) is the maximum; that is, 𝑚 (𝑛) = arg max 𝐻 (𝑖) . 𝑖
(3)
(6)
But before searching for the cut-off position, an extra calculation is done to remove impulse noise. The following test is performed on the first and the last 𝑀 points of 𝑥𝑖 (𝑛); usually 𝑀 is set to half of 𝑤; first-order differences of 𝑑𝑖 (𝑛), 𝑓𝑖 (𝑛) are calculated: 𝑓𝑖 (𝑛) = 𝑑𝑖+1 (𝑛) − 𝑑𝑖 (𝑛) .
(7)
If 𝑓𝑖 (𝑛) ≥ 𝛼, the end points 𝑥𝑗 (𝑛) for 𝑗 ≤ 𝑖 or 𝑗 > 𝑖 are considered as impulse noise and removed. The remaining 𝑑𝑗 (𝑛) are used to compute the real peer group. After removal of noise and finding cut-off position, the center pixel 𝑥0 (𝑛) is replaced by the weighted average of its peer group members: 𝑥new (𝑛) =
The peer group 𝑃(𝑛) of size 𝑚(𝑛) for 𝑥0 (𝑛) is defined as 𝑃 (𝑛) = {𝑥𝑖 (𝑛) , 𝑖 = 0, . . . , 𝑚 (𝑛) − 1} .
𝑘 2 𝑠2 2 (𝑖) = ∑ 𝑑𝑗 (𝑛) − 𝑎2 (𝑖) .
𝑤𝑖 𝑝𝑖 (𝑛) ∑𝑚(𝑛)−1 𝑖=1 𝑤𝑖 ∑𝑚(𝑛)−1 𝑖=1
, 𝑝𝑖 (𝑛) ∈ 𝑝 (𝑛) ,
(8)
where 𝑤𝑖 are the standard Gaussian weights depending on the relative positions of 𝑝𝑖 (𝑛) with respect to 𝑥0 (𝑛). After peer group filtering, cluster technique is used for color quantization. 𝐾-means start with 𝑘 random clusters and then iteratively move items between clusters, minimizing variability between clusters. As demonstrated in Figure 4, Figure 4(a) is original image, Figure 4(b) is images after quantization, and Figure 4(c) is images after both peer group filter and color quantization. The quantization reduces the total kinds of color to only 15, while the texture of the particle retains almost the original style; considering the realtime image should be no more than 400 × 400 (for large number of pixels can make calculation complexity grow to an unacceptable level), the image will lose little information after color quantization. Compared to result of direct quantization,
Advances in Tribology
5
(a)
(b)
(c)
Figure 4: The quantized wear particles’ images.
the proposed method smooths the original picture, making it more reliable for subsequent segmentation. As mentioned above, the filtering and color quantization and the total variety of color reduce to a very small number. All the pixel colors are replaced by their corresponding color class labels. The newly constructed image of those labels is called a class-map. The class-map in fact reflects the texture composition of the image. Figure 5 gives an example of class-map [20]; for demonstration, there are three labels: red, yellow, and blue. The value of each point (pixel) in the classmap is the image pixel position, a 2D vector (𝑥, 𝑦). Let 𝑍 be
the set of all 𝑁 data points in a class-map. Let 𝑧 = (𝑥, 𝑦), let 𝑧 ∈ 𝑍, and let 𝑚 be the mean: 𝑚=
1 ∑ 𝑧. 𝑁 𝑧∈𝑍
(9)
Suppose 𝑍 has 𝐶 classes, 𝑍𝑖 , 𝑖 = 1, . . . , 𝐶; let 𝑚𝑖 be the mean of the 𝑁𝑖 data points of class 𝑍𝑖 , 𝑚𝑖 =
1 ∑ 𝑧. 𝑁𝑖 𝑧∈𝑍
(10)
6
Advances in Tribology
(a) Class-map 1, 𝐽 = 1.720
(b) Class-map 2, 𝐽 = 0.855
(c) Class-map 3, 𝐽 = 0
Figure 5: An example of different classes distribution and their corresponding 𝐽.
Let
Table 1: Parameter set for different scale.
𝑆𝑇 = ∑ ‖𝑧 − 𝑚‖2 ,
Scale (pixels)
𝑧∈𝑍 𝐶
𝐶
2 𝑆𝑊 = ∑𝑆𝑖 = ∑ ∑ 𝑧 − 𝑚𝑖 , 𝑖=1
(11)
𝑖=1 𝑧∈𝑍𝑖
where 𝑆𝑊 is the total variance of points belonging to the same class. Define 𝐽=
𝑆𝑇 − 𝑆𝑊 . 𝑆𝑊
(12)
For the condition of an image consisting of several homogeneous color regions, the color classes are more separated from each other and the value of 𝐽 is large. On the other hand, if all color classes are uniformly distributed over the image, the value of 𝐽 tends to be small. For instance, three images in Figure 5 all have 3 classes and the number of each class is completely the same. Yet, the last 𝐽 is the smallest because the classes are uniformly distributed. Therefore, in a particle’s image, inside the particle, texture is unified in some way while outside the particle it is completely different. Moreover, local 𝐽 value can be very large near region boundaries. We can now think of constructing an image whose pixel values correspond to these 𝐽 values over small windows centered at the pixels. These images are called 𝐽-image. The higher the local 𝐽 value is, the more likely the corresponding pixel is near a region boundary. Given the characteristics of the 𝐽-image, region-growing method is suitable for image segmentation because different regions tend to have similar 𝐽 values. A set of initial seed can be set by calculation of the standard deviation of local 𝐽, if certain numbers (usually set to about 1% of the pixels of calculating window) of pixels have 𝐽 value less than the average and are connected. They shall be set as a seed. Then the nonseed pixel grows one by one; the one with minimum
Min. seed (pixels)
Window (pixels)
Region size (pixels)
0
33 × 33
256 × 256
512
1
17 × 17
128 × 128
128
2
9×9
64 × 64
32
3
5×5
32 × 32
8
Min. seed refers to the minimum number of seed pixels.
local 𝐽 value is assigned to its adjacent seed until all pixels are assigned [22].
3. Results and Discussion In this section, the results of the proposed method were presented on two experiments: JSEG’s parameter analysis and its comparison with other methods. To JSEG algorithm, the scale of the window for calculating 𝐽 is significant. Figure 6 gives some example of 𝐽image computing under different scale. Table 1 gives different window size for computing 𝐽 values and region size for seed determination. As can be seen in Figure 6, Figure 6(a) is original image and the following images are their 𝐽-images calculated under scales 1, 2, and 3. The smaller the scale is, the more details the 𝐽-image retains. Bigger scale will neglect the small details while edges become rather coarse. Since the whole seed determination and seed growing process are based on 𝐽-image, the result of segmentation varies by different scale. As demonstrated in Figure 7, Figure 7(a) refers to the seeds’ generation and growth by scale 1, Figure 7(b) refers to scale 2, and Figure 7(c) refers to scale 3. 𝐽-image in scale 3 contains more edged details yet it also leads to oversegmentation. The scratches on the particle’s surface were not taken as one unified region. That is because when
Advances in Tribology
7
(a)
(b)
(c)
(d)
Figure 6: Different 𝐽-image calculation under different scales.
the calculation window is too small, the 𝐽 value of local region rises and falls too quickly, especially when the texture is not so fine. Now, We will compare the proposed method with traditional thresholding and edge detection method. A program written by interactive data language is developed to separate the particle from the background. During the process, the edge of the particle was obtained using morphology dilation and erosion operation through human-computer interaction following the steps below: (i) Set a gray intensity threshold to separate particle 𝐴 from the background. 010
(ii) Using a structure ( 1 1 1 ) perform erosion to the tar010 get (particle), one can get 𝐵, the four-neighborhood edge is 𝐴 ∩ 𝐵 (iii) Select the edge by region growth. Some typical examples are shown in Figure 8; Figure 8(a) is edge acquired by thresholding. Thresholding involves
separating the dark and light regions of the image and thus identifying dark objects on a light background (or vice versa). When objects are large and do not possess very much surface detail, segmentation can be imagined as splitting the image into a number of regions each having a high level of uniformity in some parameter such as brightness, color, texture, or even motion. In the second example, the thresholding outperformed the proposed method. However, when the texture is complicated and the color intensity of particle and background are similar, thresholding lost its advantage because it cannot make full use of texture’s information. Figure 8(b) is edges detected by Sobel operator. Edge provides intrinsically more rigorous means than thresholding for initiating image segmentation, yet the edge we get is not closed and its oversegmentation cannot be resolved unless using Canny operator and yet its parameter set requires human’s experience. Generally speaking, JSEG performed well on wear particles’ images. The algorithm makes use of both color information and texture information. Yet it still has some limitations; one major problem is shades of wear particles. The shapes are
8
Advances in Tribology
(a) Initial seed area
(b) Regions after initial growing
(c) Segmentation result
Figure 7: An example of final segmentation results under 3 scales.
usually part of the particle, yet due to lack of illumination it often causes oversegmentation. However, this problem can be solved by improving hardware, for example, taking several pictures under different illumination and then using them to compose a new picture. Other problem is that when particles with similar texture are attached, the algorithm will not take them as two but one big particle. This problem might be solved by combining watershed algorithm or enhancing edge information.
4. Conclusion In this work, a segmentation algorithm for wear particle’s image is presented. The segmentation consists of color quantization and spatial segmentation. The advantage of this
method is that it is fully unsupervised and can be used directly for color images. Different parameters are tested. Experiments showed that, for regular ferrograph image, large scale is more suitable; small scale could lead to over segmentation. Compared to early approaches of image segmentation and edge detection, the proposed method holds great promise in the autoclassification system for wear particles, yet there are still some problems that need to be solved. For instance, the performance is poor when facing accumulated particles, especially when the overlapping particles share similar texture property. To solve this problem, other algorithms such as watershed method or other image properties such as intensive color changes should be taken into account to improve the segmentation result. The further study will focus on solving these problems and will be tested in real-time machine’s lubricant system.
Advances in Tribology
9
(a)
(b)
(c)
Figure 8: The comparison between proposed method and traditional method.
Competing Interests The authors declare that they have no competing interests.
References [1] G. W. Stachowiak and P. Podsiadlo, “Towards the development of an automated wear particle classification system,” Tribology International, vol. 39, no. 12, pp. 1615–1623, 2006. [2] J. Wang and X. Wang, “A wear particle identification method by combining principal component analysis and grey relational analysis,” Wear, vol. 304, no. 1-2, pp. 96–102, 2013. [3] C. Kowandy, C. Richard, Y.-M. Chen, and J.-J. Tessier, “Correlation between the tribological behaviour and wear particle
[4]
[5]
[6] [7]
morphology-case of grey cast iron 250 versus Graphite and PTFE,” Wear, vol. 262, no. 7-8, pp. 996–1006, 2007. S. Raadnui, “Wear particle analysis—utilization of quantitative computer image analysis: a review,” Tribology International, vol. 38, no. 10, pp. 871–878, 2005. H. Liu, H. Wei, L. Wei, J. Li, and Z. Yang, “An experiment on wear particle’s texture analysis and identification by using deterministic tourist walk algorithm,” Industrial Lubrication and Tribology, vol. 67, no. 6, pp. 582–593, 2015. J. A. Williams, “Wear and wear particles—some fundamentals,” Tribology International, vol. 38, no. 10, pp. 863–870, 2005. R. K. Upadhyay, “Microscopic technique to determine various wear modes of used engine oil,” Journal of Microscopy and Ultrastructure, vol. 1, no. 3, pp. 111–114, 2013.
10 [8] B. J. Roylance, “Ferrography—then and now,” Tribology International, vol. 38, no. 10, pp. 857–862, 2005. [9] J. Wang, L. Zhang, F. Lu, and X. Wang, “The segmentation of wear particles in ferrograph images based on an improved ant colony algorithm,” Wear, vol. 311, no. 1-2, pp. 123–129, 2014. [10] Z. Yu, O. C. Au, R. Zou, W. Yu, and J. Tian, “An adaptive unsupervised approach toward pixel clustering and color image segmentation,” Pattern Recognition, vol. 43, no. 5, pp. 1889–1906, 2010. [11] G. P. Stachowiak, G. W. Stachowiak, and P. Podsiadlo, “Automated classification of wear particles based on their surface texture and shape features,” Tribology International, vol. 41, no. 1, pp. 34–43, 2008. [12] G. P. Stachowiak, P. Podsiadlo, and G. W. Stachowiak, “Evaluation of methods for reduction of surface texture features,” Tribology Letters, vol. 22, no. 2, pp. 151–165, 2006. [13] G. P. Stachowiak, P. Podsiadlo, and G. W. Stachowiak, “A comparison of texture feature extraction methods for machine condition monitoring and failure analysis,” Tribology Letters, vol. 20, no. 2, pp. 133–147, 2005. [14] C. Q. Yuan, J. Li, X. P. Yan, and Z. Peng, “The use of the fractal description to characterize engineering surfaces and wear particles,” Wear, vol. 255, no. 1–6, pp. 315–326, 2003. [15] T. Wu, Y. Peng, H. Wu, X. Zhang, and J. Wang, “Full-life dynamic identification of wear state based on on-line wear debris image features,” Mechanical Systems and Signal Processing, vol. 42, no. 1-2, pp. 404–414, 2014. [16] X. Liao, H. Xu, Y. Zhou et al., “Automatic image segmentation using salient key point extraction and star shape prior,” Signal Processing, vol. 105, pp. 122–136, 2014. [17] M. Jungmann, H. Pape, P. Wißkirchen, C. Clauser, and T. Berlage, “Segmentation of thin section images for grain size analysis using region competition and edge-weighted region merging,” Computers & Geosciences, vol. 72, pp. 33–48, 2014. [18] T. Wu, H. Wu, Y. Du, N. Kwok, and Z. Peng, “Imaged wear debris separation for on-line monitoring using gray level and integrated morphological features,” Wear, vol. 316, no. 1-2, pp. 19–29, 2014. [19] F. Li, C. Xu, G.-Q. Ren, and J.-W. Gao, “Image segmentation of ferrography wear particles based on mathematical morphology,” Journal of Nanjing University of Science and Technology, vol. 29, no. 1, pp. 70–72, 2005. [20] Y. Deng and B. S. Manjunath, “Unsupervised segmentation of color-texture regions in images and video,” IEEE Transactions on Pattern Analysis and Machine Intelligence, vol. 23, no. 8, pp. 800–810, 2001. [21] R. O. Duda and P. E. Hart, Pattern Classification and Scene Analysis, John Wiley & Sons, New York, NY, USA, 1970. [22] C. Deng, C. Kenney, M. S. Moore, and B. S. Manjunath, “Group filtering and perceptual color image quantization,” in Proceedings of the IEEE International Symposium on Circuits and Systems, vol. 4, pp. 21–24, Orlando, Fla, USA, May 1999.
Advances in Tribology
International Journal of
Rotating Machinery
Engineering Journal of
Hindawi Publishing Corporation http://www.hindawi.com
Volume 2014
The Scientific World Journal Hindawi Publishing Corporation http://www.hindawi.com
Volume 2014
International Journal of
Distributed Sensor Networks
Journal of
Sensors Hindawi Publishing Corporation http://www.hindawi.com
Volume 2014
Hindawi Publishing Corporation http://www.hindawi.com
Volume 2014
Hindawi Publishing Corporation http://www.hindawi.com
Volume 2014
Journal of
Control Science and Engineering
Advances in
Civil Engineering Hindawi Publishing Corporation http://www.hindawi.com
Hindawi Publishing Corporation http://www.hindawi.com
Volume 2014
Volume 2014
Submit your manuscripts at http://www.hindawi.com Journal of
Journal of
Electrical and Computer Engineering
Robotics Hindawi Publishing Corporation http://www.hindawi.com
Hindawi Publishing Corporation http://www.hindawi.com
Volume 2014
Volume 2014
VLSI Design Advances in OptoElectronics
International Journal of
Navigation and Observation Hindawi Publishing Corporation http://www.hindawi.com
Volume 2014
Hindawi Publishing Corporation http://www.hindawi.com
Hindawi Publishing Corporation http://www.hindawi.com
Chemical Engineering Hindawi Publishing Corporation http://www.hindawi.com
Volume 2014
Volume 2014
Active and Passive Electronic Components
Antennas and Propagation Hindawi Publishing Corporation http://www.hindawi.com
Aerospace Engineering
Hindawi Publishing Corporation http://www.hindawi.com
Volume 2014
Hindawi Publishing Corporation http://www.hindawi.com
Volume 2014
Volume 2014
International Journal of
International Journal of
International Journal of
Modelling & Simulation in Engineering
Volume 2014
Hindawi Publishing Corporation http://www.hindawi.com
Volume 2014
Shock and Vibration Hindawi Publishing Corporation http://www.hindawi.com
Volume 2014
Advances in
Acoustics and Vibration Hindawi Publishing Corporation http://www.hindawi.com
Volume 2014