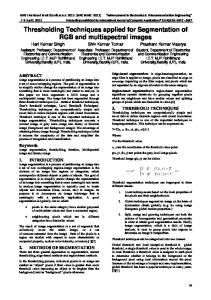
Our research deals with a semi-automatic region-growing segmentation
technique. .... Figure 3.1.3: Another original Matlab image segmented using the ...
Segmentation Using a Region Growing Thresholding Matei MANCAS1, Bernard GOSSELIN1, Benoît MACQ2 1
Faculté Polytechnique de Mons, Circuit Theory and Signal Processing Laboratory Bâtiment MULTITEL/TCTS - Initialis, 1, avenue Copernic, B-7000, Mons, Belgium e-mail :
[email protected], phone : +32 65 37 47 43, fax : +32 65 37 47 57 2
Université Catholique de Louvain, Communications and Remote Sensing Laboratory UCL-TELE, Batiment Stévin, Place du Levant, 2, 1348 Louvain-la-Neuve, Belgium e-mail :
[email protected] , phone : +32 10 47 22 71, fax : +32 10 47 20 89
ABSTRACT Our research deals with a semi-automatic region-growing segmentation technique. This method only needs one seed inside the region of interest (ROI). We applied it for spinal cord segmentation but it also shows results for parotid glands or even tumors. Moreover, it seems to be a general segmentation method as it could be applied in other computer vision domains then medical imaging. We use both the thresholding simplicity and the spatial information. The gray-scale and spatial distances from the seed to all the other pixels are computed. By normalizing and subtracting to 1 we obtain the probability for a pixel to belong to the same region as the seed. We will explain the algorithm and show some preliminary results which are encouraging. Keywords: Region Growing, Image Segmentation, Parotid Glands, Tumors, Spinal Cord
1. INTRODUCTION Image segmentation plays a crucial role in medical imaging by facilitating the delineation of regions of interest. Our issue deals with head and neck tumors and risk areas segmentation such as parotid glands ganglionic areas or spinal cord. Knowledge on precise position or volume of tumors and risk areas is capital for radiotherapy planning. The doses of radiation depend on tumor’s volume and the rays must avoid the risk areas. At this moment all the segmentation is done manually. The time needed by a specialist to do a manual segmentation is up to three hours, that is why the need of a tool which saves time is very important. There are numerous segmentation techniques in medical imaging depending on the region of interest [3]. The most relevant ones for our problem are atlas-guided techniques [5] and region growing segmentation methods [2][3]. Some of them use a semi-automatic approach and still need some operator interaction. Others are fully automatic and the operator has only a verification role. Atlas-guided techniques could work well for the spinal cord segmentation but tumors or parotid glands are quite different from a patient to another. It is very difficult to have a modelization of the parotid glands and even more the tumors. Active contours models [4] as snakes are very efficient only if they are very close to the final solution. Here we study very complex structures as tumors or parotid glands and these models fail to reach the final solution if they are not close enough to this solution. In this work, we developed a semi-automatic approach based on a region-growing technique in order to segment the spinal cord. As it showed good results [1] we tested it for other organs like the parotid glands (risk areas) and even on tumors with also encouraging results. After introducing the region growing method, we will present some preliminary results and then make a discussion on future work and improvements.
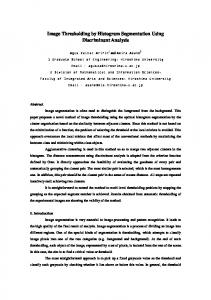
2. METHOD 2.1. ROI visualization using distances and probability maps On Figure 2.1.1 we can see the probability maps: on top-left we have a map based on the spatial Euclidean distance from the initial seed point to all the other pixels. On top-right we have a map based on the gray level value Euclidean distance between the seed and all the other pixels in the image. On bottom-left we have a map based on the gray level mean Euclidean distance from a window centered in the initial seed to all the other windows centered in all the other pixels in the image. Finally we have the same thing on the bottom-right image but using standard deviation instead of the mean.
Figure 2.1.1: Probability maps from top-left to bottom-right based on: spatial distance, gray level value, gray level mean and gray level standard deviation.
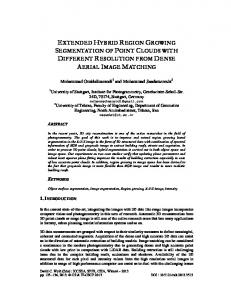
These probability maps are computed from the distance maps by simply normalizing and subtracting them to 1. This approach of comparison using a distance from a seed point to all the other pixels according to some features is quite similar to what is done in an unsupervised classifier like the k-means. The difference is that there is only one cluster centroid fixed by the user and the features are only classified with a probability of belonging to the same class that the initial seed or not. As these probabilities are independent, we can combine them using a multiplication. We obtain images as in the Figure 2.1.2 on the left image where the parotid gland is very well highlighted. 2.2. The need of a new Gray-Space (GS) map The problem is that the spatial Euclidean distance as you can see it in Figure 2.1.1, top-left image, does not depend either on images dimensions or on structures dimensions… If the parotid gland is smaller, this spatial distance could highlight parts out of the gland for example.
This is the reason why we developed another distance called Gray-Space (GS) map. This distance is based on image topology.
Figure 2.1.2 : Mixing the probability maps on the left and GS map example on the right
The basic algorithm is very simple. We compute the seed gray level : V = I(seed), then look for structures which have the same gray level than the seed overlapping the seed position. At the second iteration, we look for structures having a small gray level difference from the seed : Tmp = AND( I > (V + D), I