Selection of Emotionally Salient Audio-Visual Features for Modeling Human Evaluations of Synthetic Character Emotion Displays
#
Emily Mower #1 , Maja J Matari´c ∗2 ,Shrikanth Narayanan #∗3 Department of Electrical Engineering, ∗ Department of Computer Science University of Southern California Los Angeles, CA 90089 1
[email protected], 2
[email protected], 3
[email protected]
Abstract Computer simulated avatars and humanoid robots have an increasingly prominent place in today’s world. Acceptance of these synthetic characters depends on their ability to properly and recognizably convey basic emotion states to a user population. This study presents an analysis of audiovisual features that can be used to predict user evaluations of synthetic character emotion displays. These features include prosodic, spectral, and semantic properties of audio signals in addition to FACS-inspired video features [11]. The goal of this paper is to identify the audio-visual features that explain the variance in the emotional evaluations of na¨ıve listeners through the utilization of information gain feature selection in conjunction with support vector machines. These results suggest that there exists an emotionally salient subset of the audio-visual feature space. The features that contribute most to the explanation of evaluator variance are the prior knowledge audio statistics (e.g., average valence rating), the high energy band spectral components, and the quartile pitch range. This feature subset should be correctly modeled and implemented in the design of synthetic expressive displays to convey the desired emotions.
1
Introduction
The proper expression of robotic and computer animated character emotions have the potential to influence consumer willingness to adopt technology. As technology continues to develop, robots and simulated avatars (“synthetic characters”) will likely take on roles as caregiver, guide, and tutor for populations ranging from the elderly to children with autism. In these roles, it is important that robots and synthetic characters have interpretable and reliably recognized emotional expressions, which allow target populations to more easily accept the involvement of synthetic characters in their day to day lives.
Reliable and interpretable synthetic emotion expression requires a detailed understanding of how users process synthetic character emotional displays. This study presents a quantitative analysis of the importance of specific audiovisual features with respect to emotion perception. Armed with this knowledge, designers may be able to control the number of feature combinations that they explore. Instead of implementing and testing broad combinations of features, designers may be able to concentrate on those features upon which observers rely when when making synthetic affective assessments. These emotionally relevant features must be properly designed to convey the affective goals. The work of McGurk and MacDonald [18] has provided a framework commonly employed for the study of human emotional perception. They demonstrated that in the presence of conflicting viseme and phoneme information, the final assessment of the presented audio-visual sound may be different than that presented on either channel. The McGurk experimental paradigm is often employed in emotion perception research. One common evaluation method [8–10, 15, 17] is to create an emotional continuum, anchoring the ends with two archetypal emotional images and presenting these images with emotional vocalizations. Subjects then identify the emotion presented from a discrete set (e.g., angry vs. happy). This presentation framework allows the researchers to model the perceptual influence of the two modalities. However, discrete emotional evaluation frameworks do not fully capture the interplay between the two channels. The complexities of the two channels may be better modeled using a continuous framework (e.g., valence, activation, dominance, “VAD”) [3, 13, 20, 21] rather than a discrete framework (e.g., angry, happy, sad, neutral). This framework allows users to express the complexity of an emotional presentation using the properties of the emotion, rather than the lexical description. Continuous frameworks have also been used to analyze the interplay between facial actions and personality perception [1].
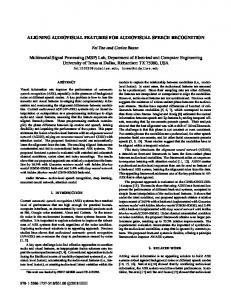
Figure 1. The four emotional faces (l-r angry, sad, happy, neutral) created using the CSLU Toolkit [25] In this paper, emotionally relevant features are identified using the conflicting (the emotions expressed in the face and the voice were different) and congruent (the emotions expressed in the face and the voice were the same) presentation framework. In a conflicting presentation, evaluators must make an assessment using mismatched emotional cues. These presentations are important research tools as they provide combinations of features that would not, under ordinary circumstances, be viewed concurrently, allowing for a greater exploration of the feature space. Features that are selected across both congruent and conflicting presentations are features that provide emotionally discriminative power both in the presence and absence of emotional ambiguity. The feature selection method employed in this paper is Information Gain, which has been used previously to identify emotionally salient features [23]. The explanatory power of the resulting reduced feature set is validated using Support Vector Machine classification [26]. The results indicate that the pitch range and spectral components of the speech signal are perceptually relevant features. Prior knowledge statistics (e.g., the average valence rating for angry speech) are also perceptually relevant. However, these prior knowledge features contribute supplementary, rather than complementary information. The results suggest that the perceptually relevant valence dimension features are: pitch and energy ranges and facial expression features (eye shape, eyebrow angle, and lip position), the activation dimension features are: are energy and spectral features, and the dominance dimension features are: energy, spectral, and pitch range features. This novelty of this work is in its analysis of dynamic audio-visual features and their contribution to dimensional emotional evaluation. The data utilized in this experiment are described in Section 2. Section 3 discusses the features extracted from the data and the methods used to analyze these features. Section 4 presents the results. Section 5 provides a discussion. Section 6 provides closing remarks and future work.
2
Data Description
The dataset used in this experiment consists of valence (positive vs. negative), activation (calm vs. excited), and
dominance (passive vs. dominant), ratings of audio-visual, audio-only, and video-only clips by 13 (ten male and three female) human evaluators. This continuous dimensional space is referred to as VAD. There were a total of 36 audioonly clips, 35 video-only clips, and 139 audio-visual clips. The audio files were recorded from a female actress and include four emotions (angry, happy, sad, neutral). The animated face was implemented using the CSLU toolkit [25] across four emotional facial displays (angry, happy, sad, and neutral, Figure 1). The audio-visual presentations consisted of both congruent and conflicting presentations. The data and evaluation are described more fully in [20, 21].
3
Methods
This study was designed to investigate the relative strength of audio-visual features with respect to the perceptual evaluations of human subjects. This study presents feature selection results with SVM classification validation. The original user evaluations of the valence, activation, and dominance dimensions were on a scale from 0-100. These VAD ratings were normalized using z-score normalization over each evaluator to reduce the person-dependent artifacts. Given the limited expressive capability provided by the animated character (only the eyebrows, lips, and initial shape of the eyes changed between clips), the information expressed in the video channel did not vary extensively within a single emotion class (e.g., the facial channel expressed either positive or negative affect). Therefore, the normalized VAD space was discretized using the neutral valence, activation, and dominance centroids, resulting in three binary VAD dimensions (above or below the neutral centroid for each clip).
3.1
Audio Features
The audio features utilized in this experiment included 20 prosodic features and 26 spectral features averaged over an utterance. The prosodic features included pitch, energy, and timing statistics. The spectral features included the mean and standard deviation of the first 13 MFCCs [12]. These features are summarized in Table 1. It is also important to note that the selected audio features represent relevant design parameters that can be used to modulate synthetic speech [4, 22].
3.2
Video Features: FACS
The Facial Action Coding System (FACS) was developed by Ekman and Friesen as a method to catalogue the muscle movements of the human facial structure [11]. These features allow for a design-centered analysis of a video sequence through the use of actuated facial units (a
Stream Type
Feature Class Pitch Volume
Audio
Rate MFCC Prior Knowledge: Binary Emotion Prior Knowledge: Mean Statistics Eyebrow Movement
Video
Eyebrow Movement Type Eyebrow Angle Lip Corner Position Eye Shape Prior Knowledge: Binary Emotion Prior Knowledge: Mean Statistics
Measures mean, standard deviation, median, min, max, range, upper quartile, lower quartile, quartile range mean, standard deviation, max, upper quartile, lower quartile, quartile range pause to speech ratio, speech duration mean and standard deviation, pause duration mean and standard deviation 1 – 13, mean and standard deviation angry voice, happy voice, sad voice, neutral voice valence, activation, dominance of each emotion class none, downward, upward, downward upward, upward downward, downward upward downward, upward downward upward none, once, twice, thrice flat, inner raised, inner lowered, outer raised, outer lowered neutral, raised, lowered eyes wide, top soft, top sharp, bottom soft, bottom sharp angry face, happy face, sad face, neutral face
valence, activation, dominance of each emotion class
Table 1. A summary of the audio and video features used in this study. subset of the facial muscles acting to achieve a visually perceivable facial movement). This method of video analysis is important for design centered user modeling. Since the facial features described by action units are physically realizable motions, any facial feature identified as important could, given sufficient actuation, be implemented on a synthetic character. Consequently, the method identifies salient facial motions from a set of available facial actions. The features used in this study represent a simplified subset of the FACS action units due to the simplicity of the input video stream. The video features employed in this study are summarized in Table 1. These features include eyebrow (movements, types, and angles), eye shape, and lip corner position features. Other areas of the face were not analyzed because they were static with respect to emotion presentation for these data. These features were manually coded by the author.
3.3
Prior Knowledge Features
The audio and video feature sets both included prior knowledge features. These prior knowledge features were broken down into two categories: (1) indicator variables representing the presence of one of the four discrete emotions and (2) mean dimensional statistics. There were four video indicator variables: angry face, happy face, sad face, and neutral face. These variables were equal to one if the given emotional face was present in an emotional utterance, and zero otherwise. The four audio indicator variables expressed the same information for the vocal channel. The video mean statistics detailed the average valence, activation, and dominance for the video emotion and the audio mean statistics detailed the average valence, activation, and
dominance for the audio emotion. The prior knowledge features were included to determine how knowledge of the emotions expressed in the two individual channels could be used to predict the user evaluation of the combined audiovisual presentation.
3.4
Feature selection and Validation
In this study, the original audio-only, video-only, and audio-visual feature sets were reduced using the Information Gain Attribute Selection algorithm implemented in Weka, a Java-based data mining software package [27]. Information gain has been used to detect emotionally salient features [23]. Information gain is defined as the decrease in the entropy of set S, H(S) (e.g., valence), given the conditional entropy between S and attribute A, H(S|A) (e.g., valence given the presence of an angry face) is known (Equation 1) [19]. Features were thresholded at 0.1 information gain with respect to the target class (discretized valence, activation, and dominance). The goal of this analysis was to determine which of the audio and video features contributed to the perceptual evaluations of the users with respect to the three discretized input spaces of valence, activation, and dominance. These features were analyzed over the three presentation conditions (audio-visual, audio-only, and video-only). Gain(S, A) ≡ H(S) − H(S|A)
(1)
Support Vector Machine (SVM) was used to compare the classification performance of the reduced feature set to that of the full feature set. SVM is a classification tool developed by Vapnik [26]. This classification algorithm transforms the input data space to a higher dimensional space
Dim
Relevant Features
Val
Act
Dom
Accuracy
ave audio val (0.159), ave audio dom, ave audio act, mfcc12 mean, vol quartlow, f0 quartlow, mfcc03 mean, ave video dom, eyebrow angle, lip corner position, happy voice, ave video val, eyebrow angle flat, eye shape bottom sharp, f0 quartup (0.1) vol quartup (0.472), vol quartrange, vol std, vol mean, mfcc01 std, mfcc07 std, vol max, mfcc01 mean, mfcc08 std, mfcc10 mean, mfcc12 std, mfcc13 mean, ave audio val, ave audio dom, ave audio act, speech duration std, mfcc03 mean, mfcc05 std, pause to speech ratio, mfcc08 mean, f0 quartrange, mfcc11 std, f0 mean, mfcc10 std, mfcc12 mean, mfcc06 std, mfcc13 std, mfcc02 mean, f0 quartlow, f0 std, mfcc11 mean, f0 range, f0 quartup, mfcc09 mean, f0 max, mfcc07 mean, mfcc09 std, mfcc03 std, mfcc04 mean, mfcc05 mean, mfcc04 std, mfcc06 mean, f0 min, f0 median, pause dur mean, sad voice, vol quartlow, mfcc02 std, pause duration std, speech duration mean, angry voice (0.165) ave audio dom (0.204), ave audio val, vol mean, ave audio act,angry voice, mfcc12 mean, mfcc06 std, mfcc08 mean, mfcc11 std, vol max, f0 quartrange, mfcc08 std, mfcc05 std, mfcc12 std, mfcc09 mean, vol quartup, vol quartrange, f0 quartlow, mfcc01 mean, mfcc01 std, vol std, mfcc13 std, mfcc03 std (0.103)
77.45%
85.60%
69.31%
Table 2. The features selected listed in order of prominence (left - right) with the highest and lowest information gain in parentheses. Bold italic fonts represent features selected across all three dimensions, italic fonts represent features selected across two dimensions. to find a hyperplane that optimally separates the data. During testing, the input data are transformed to the higher dimensional space and thresholded using the identified hyperplane. SVM has been used successfully in emotion classification tasks [2, 7, 16, 24].
4 4.1
Results Information Gain Feature Selection Results
The features selected for the audio-visual presentations (using both the congruent and conflicting presentation audio-visual evaluations) can be viewed in Table 2. Features highlighted in italics were observed over two VAD dimensions, features in bold italics were observed across all three dimensions. The Information Gain feature selection technique was also applied to the audio-only and video-only presentation conditions. The results of the three feature selection analyses (audio-visual, audio-only, and video-only) were combined. The highest possible representation of any feature across this combination was six: valence, activation, and dominance for the bimodal presentation (audio-visual); and valence, activation, and dominance for the unimodal presentation (video-only or audio-only). These spaces will be + referred to as V ADAudio (containing the audio-only and audio-visual VAD features) and V ADV+ideo (containing the video-only and audio-visual VAD features). The only features selected in six cases (across all audio-visual and audio+ only presentations- V ADAudio ) were the three mean audio statistics (the emotion specific centroids for valence, activation, and dominance), the quartile pitch range, and a high frequency mfcc feature. However, it should be noted, that
in five of the presentation conditions containing audio, the binary variable representing the presence of an angry voice was also selected. The most highly represented video features were the video prior knowledge mean statistics (activation and valence evaluations). These two features were represented in four of the V ADV+ideo components. The video prior knowledge mean dominance statistic was included in only three of the V ADV+ideo components. There were several features represented once (out of a + possible six times) in the V ADAudio or V ADV+ideo . This set of features includes three of the FACS-inspired features (a binary feature addressing eyebrow angle, a feature addressing eyebrow movement direction, and an eye shape feature). All three of the features were utilized in the video valence classification problem. This result suggests that these features provide specialized dimensional differentiation. This feature set of singularly represented features also includes two of the binary channel features (happy voice and sad voice indicators). These features were utilized in the audio-visual valence and activation classification tasks respectively. This suggests that these features, while not applicable to channel dependent classifications (i.e. videoonly), they do provide additional information with respect to multimodal discretization and disambiguation.
4.2
Validation: SVM Classification
The results from the SVM classification across the three presentation conditions (audio-visual, audio-only, videoonly) were validated using 20-fold cross-validation (Table 3). The classification accuracies were tested using a difference of proportions test to determine if the classification accuracy changed when either the feature set was reduced, or when the prior information was removed. None
Presentation
Audio-Visual
Audio
Video
Dimension Valence Activation Dominance Valence Activation Dominance Valence Activation Dominance
Classification Accuracy (Prior) (%) Full Feature Set Reduced Feature Set 76.618 85.8038 72.0251 73.2759 86.2069 75 84.4523 55.477 57.9505
77.453 85.595 69.3111 80.1724 87.069 73.2759 84.4523 61.1307 65.7244
Classification Accuracy (No Prior) (%) Full Feature Set Reduced Feature Set 75.1566 84.9687 73.0689 79.3103 87.069 75.8621 84.4523 56.5371 57.9505
75.1566 85.595 68.2672 80.1724 87.069 70.6897 85.5124 61.1307 65.7244
Table 3. Classification results (SVM) over the three presentation conditions and three dimensions using feature sets reduced with the Information Gain criterion discussed in Section 3.4. of these accuracies differed significantly at the α = 0.05 level across feature set size (full vs. reduced) or based on prior knowledge (present vs. absent). This result suggests that the reduced feature sets without prior knowledge statistics can explain the variance in the user evaluations with a similar of accuracy to that of the full feature set.
5
Discussion
The SVM classification results indicate that there exists a reduced feature set of the full feature space that explains the variance in the user evaluations. This result suggests that user perception is affected by a subset of the observable feature space. The features that contribute most to the explanation of evaluator variance, as suggested by Information Gain feature selection, are the prior knowledge audio statistics (e.g., average valence rating), the high energy band spectral components, and the quartile pitch range. The prior knowledge audio statistics include the average ratings for valence, activation, and dominance. These statistics represent the average ratings for the audio component of the audio-visual emotion expression. It is therefore not surprising that these values provide information regarding the final audio-visual evaluations. However, even when removed, the performance of the SVM binary VAD classification task did not significantly degrade. This suggests that the information provided by audio prior knowledge statistics is encoded within the non-prior knowledge audio and video features. The pitch range features were selected across all three VAD dimensions (for both audio-visual and audio-only presentations). The importance of pitch range has been demonstrated in [6]. The pitch range was found to be extremely important when creating emotional synthetic speech. In [5], the researchers used classification techniques to select parameters for emotional speech resynthesis. The selected features were used to modify the emotions expressed in the speech. This subset reduced the number of feature combinations that needed to be observed and rated by
the evaluators. Future studies will include presentations of emotional audio-visual stimuli composed of varying combinations of the feature subsets identified in this paper. The goal of this presentation style is to determine how such combinations effect audio-visual emotion perception for congruent and conflicting presentations. Previous work has indicated that the audio channel provides ample activation information but alone is insufficient to convey the necessary valence information [14]. The results presented in this paper support this finding. In the evaluated dataset, valence differentiation was better accomplished using video information while the activation differentiation was better accomplished using audio information. These results are also in agreement with previous analyses of this dataset [21].
6
Conclusion
This work presented an analysis of user evaluations of emotional presentations with respect to audio and visual feature contribution. The features identified through the Information Gain attribute selection and validated using SVM classification represent features that affect the emotional perception of human evaluators. Since these features contribute strongly to user perception, it is important that they be properly designed and implemented in synthetic emotional displays. One limitation inherent in this study is the simplicity of the video data. However, it should be noted that in spite of this simplicity, multiple FACS-inspired video features were found to be perceptually relevant. Future work will include extensions of this study using human vocal and facial information of equal levels of emotional expressivity. This extension provide further insight to the underlying nature of joint audio–visual emotion processing. This study presented an analysis of audio-visual features to determine which features best explained the user evaluation variance. These reduced feature sets were validated
using classification techniques. However, perception and recognition tasks are not necessarily equivalent. Future studies will include an analysis-by-synthesis approach using the subsets of the feature space to determine if the features with variance explanatory power also affect perception.
Acknowledgements This work was partially supported by the NSF (under grants IIS 0757414 and IIS 0238514) and and the Herbert Kunzel Engineering Fellowship. The authors would also like to thank Carlos Busso for his advice.
References [1] A. Arya, L. N. Jefferies, J. T. Enns, and S. DiPaola. Facial actions as visual cues for personality. Computer Animation and Virtual Worlds, 17(3–4):371–382, 2006. [2] M. S. Bartlett, G. Littlewort, M. Frank, C. Lainscsek, I. Fasel, and J. Movellan. Recognizing facial expression: machine learning and application to spontaneous behavior. IEEE Computer Society Conference on Computer Vision and Pattern Recognition, 2:568–573, 2005. [3] M. M. Bradley and P. J. Lang. Measuring emotion: The selfassessment manikin and the semantic differential. Journal of Behavior Therapy and Experimental Psychiatry, 25(1):49 – 59, 1994. [4] M. Bulut, C. Busso, S. Yildirim, A. Kazemzadeh, C. Lee, S. Lee, and S. Narayanan. Investigating the role of phonemelevel modifications in emotional speech resynthesis. In Interspeech, pages 801–804, Lisbon, Portugal, September 4–8 2005. [5] M. Bulut, S. Lee, and S. Narayanan. Recognition for synthesis: automatic parameter selection for resynthesis of emotional speech from neutral speech. In International Conference on Acoustics, Speech, and Signal Processing (ICASSP), pages 4629 – 4632, Las Vegas, NV, April 2008. [6] M. Bulut and S. Narayanan. Analysis of effects of f0 modifications on emotional speech. Journal of the Acoustical Society of America, 123(6):4547–4558, June 2008. [7] C. Busso, Z. Deng, S. Yildirim, M. Bulut, C. M. Lee, A. Kazemzadeh, S. Lee, U. Neumann, and S. Narayanan. Analysis of emotion recognition using facial expressions, speech and multimodal information. In Proceedings of the 6th International Conference on Multimodal Interfaces, pages 205–211, State Park, PA, October 2004. [8] B. de Gelder. The perception of emotions by ear and by eye. Cognition & Emotion, 14(3):289–311, 2000. [9] B. de Gelder, K. B¨ocker, J. Tuomainen, M. Hensen, and J. Vroomen. The combined perception of emotion from voice and face: early interaction revealed by human electric brain responses. Neuroscience Letters, 260(2):133–136, 1999. [10] B. DeGelder and P. Bertelson. Multisensory integration, perception, and ecological validity. Trends in Cognitive Sciences, 7(10):460–467, October 2003. [11] P. Ekman and W. Friesen. Facial Action Coding System. Consulting Psychologists Press, Palo Alto, CA, 1978.
[12] M. Grimm and K. Kroschel. Rule-based emotion classification using acoustic features. In Conf. on Telemedicine and Multimedia Communication, Kajetany, Poland, October 2005. [13] M. Grimm, K. Kroschel, E. Mower, and S. Narayanan. Primitives-based evaluation and estimation of emotions in speech. Speech Communication, 49:787–800, 2007. [14] A. Hanjalic. Extracting moods from pictures and sounds: Towards truly personalized tv. IEEE Signal Processing Magazine, 23(2):90–100, March 2006. [15] J. Hietanen, J. Lepp¨anen, M. Illi, and V. Surakka. Evidence for the integration of audiovisual emotional information at the perceptual level of processing. European Journal of Cognitive Psychology, 16(6):769–790, 2004. [16] Y. Lin and G. Wei. Speech emotion recognition based on HMM and SVM. Proc. of Int. Conf. on Machine Learning and Cybernetics, 8:4898–4901, August 2005. [17] D. Massaro. Fuzzy logical model of bimodal emotion perception: Comment on” The perception of emotions by ear and by eye” by de Gelder and Vroomen. Cognition & Emotion, 14(3):313–320, 2000. [18] H. McGurk and J. MacDonald. Hearing lips and seeing voices. Nature, 264:746–748, 1976. [19] T. M. Mitchell. Machine Learning. McGraw Hill, 1997. [20] E. Mower, S. Lee, M. J. Matari´c, and S. Narayanan. Human perception of synthetic character emotions in the presence of conflicting and congruent vocal and facial expressions. In IEEE International Conference on Acoustics, Speech, and Signal Processing (ICASSP), pages 2201–2204, Las Vegas, NV, April 2008. [21] E. Mower, S. Lee, M. J. Matari´c, and S. Narayanan. Joint– processing of audio-visual signals in human perception of conflicting synthetic character emotions. In IEEE International Conference on Multimedia & Expo (ICME), pages 961–964, Hannover, Germany, 2008. [22] M. Nicolao, C. Drioli, and P. Cosi. Voice GMM modelling for FESTIVAL/MBROLA emotive TTS synthesis. In International Conference on Spoken Language Processing, pages 1794–1797, Pittsburgh, PA, USA, September 17–21 2006. [23] P. Oudeyer. The production and recognition of emotions in speech: features and algorithms. International Journal of Human-Computer Studies, 59(1–2):157–183, 2003. [24] P. Rani, C. Liu, and N. Sarkar. An empirical study of machine learning techniques for affect recognition in human– robot interaction. Pattern Analysis & Applications, 9(1):58– 69, May 2006. [25] S. Sutton, R. Cole, J. de Villiers, J. Schalkwyk, P. Vermeulen, M. Macon, Y. Yan, E. Kaiser, B. Rundle, K. Shobaki, et al. Universal speech tools: the cslu toolkit. In Proceedings of the International Conference on Spoken Language Processing (ICSLP), pages 3221–3224, Sydney, Australia, November – December 1998. [26] V. Vapnik. Statistical Learning Theory. Wiley, New York, 1998. [27] I. Witten, E. Frank, L. Trigg, M. Hall, G. Holmes, and S. Cunningham. Weka: Practical machine learning tools and techniques with Java implementations. In Proceedings of ANNES International Workshop on emerging Engineering and Connectionnist-based Information Systems, volume 99, pages 192–196, Dunedin, New Zealand, 1999.