ASIAN JOURNAL OF CIVIL ENGINEERING (BUILDING AND HOUSING) VOL. 9, NO. 6 (2008) PAGES 629-645
SELF-ORGANIZING BACK PROPAGATION NETWORKS FOR PREDICTING THE MOMENT-ROTATION BEHAVIOR OF BOLTED CONNECTIONS
SI
Abstract
D
E. Salajegheh*, S. Gholizadeh and A. Pirmoz Department of Civil Engineering, University of Kerman, Kerman, Iran
ive
of
Evaluating the moment-rotation behavior of bolted connections by finite element method is very intensive task in terms of computational cost. This study proposes an efficient neural system to predict the moment-rotation behavior of the connections. The neural system is called self-organizing back propagation (SOBP) networks. The SOBP includes two processing units: classification and approximation. In the classification unit, all the training data are divided into some classes by a self-organizing map network. In the approximation unit, a set of back propagation networks are employed to achieve the approximation task. The numerical results demonstrate the computational advantages of the SOBP.
ch
Keywords: Neural network; self-organizing map; back propagation; bolted connection; finite element.
1. Introduction
Ar
Connections in steel structures have been categorized into three types [1]: Type I, II and III. Type I connections (rigid connections) have enough stiffness to hold the angle between the beam and column almost unchanged. Type II are assumed to behave as pinned connections which have low rotational stiffness with respect to the beam flexural stiffness. Behavior of a large number of beam-to-column connections is between Types I and II. These connections have been categorized as Type III connections (semi-rigid connections) named Partially Restrained (PR) connections by AISC-LRFD [2]. Performing an accurate structural analysis and design of semi-rigid frames needs accurate moment-rotation response of their connections. Bolted top-seat angles with double web angle connections is categorized as PR connections [2] and does not have the brittle fracture behavior of corresponding welded connections; on the other hand it has the advantages of deformable failure patterns, relatively large energy dissipation capacity. In [3] an analytical study is done on two 5 and 10 storey steel buildings with different strength and stiffness of interior hybrid semi rigid *
E-mail address of the corresponding author:
[email protected] (E. Salajegheh)
www.SID.ir
E. Salajegheh, S. Gholizadeh and A. Pirmoz
630
Ar
ch
ive
of
SI
D
frames and interior welded moment frames. The buildings were subjected to three earthquake excitations and the results showed that interior semi-rigid frames can lead to a less storey shear and column moment and high seismic performance. Analyses and design of a semi-rigid frame needs a clear understanding of momentrotation relation of its connections. Lots of studies have been performed all over the world to estimate moment-rotation behavior of bolted top and seat angle connection. Azizinamini [4] has experimentally studied the behavior of such connections under monotonic and cyclic loads, the results of his experiments is a vigorous reference used by later investigators to verify their proposed methods. Shen and Astaneh-Asl [5] have experimentally tested the behavior of bolted angle connections and their failure modes and deformation patterns. In the last years, numerical modeling especially finite element (FE) method is used to investigate the behavior of this type of connection [6-8]. Using FE method to study the behavior of bolted angle connections in spite of its accuracy is a time consuming method, thus many researchers proposed multy-linear and bilinear formulations to estimate behavior of such connections. Shen and Astaneh-Asl [5] proposed a hysteretic model of bolted angle connection based on fiber element formulation. Parametric study of behavior of double angle connections welded to column web and bolted to beam web under shear, tension and the combination of these loads is done using finite element method together with an experimental work in [9-11]. These studies showed that these types of connections under combination of axial and shear force, behave like simple shear connections. The effect of shear force on initial stiffness of top-seat angle connections with double web angles subjected to shear force by using FE method is studied in [12-13]. As the computational work of evaluation of the moment-rotation behavior by FE method is high, it is rational that for a parametric study a fast alternative is involved. In this case, artificial neural networks are the best candidates. In the last decade, artificial intelligence techniques have emerged as powerful tools that could be used to replace time-consuming procedures in many engineering applications. The interest showed to neural networks [14-15] is mainly due to their ability to process external data and information based on past experiences. Few investigations using neural networks to predict joints behavior can be found in the literatures. Abdala and Stavroulakis [16] have used neural networks to predict the global moment versus rotation curve of single web angle beam-to-column joints. Anderson [17] described the use of neural networks to predict a bilinear approximation of the moment versus rotation curves of minor axis beam-to-column endplate joints. De Lima et al. [18] employed BP neural networks to asses the behavior of beam-to-column joints. In the present study, an efficient neural system is designed to predict the moment-rotation behavior of the bolted connections. In the neural system two processing units are incorporated. In the first unit, called classification unit, all the training data are classified using a Self-Organizing Map (SOM) neural network. Training of the SOM neural network is performed in an unsupervised manner and the number of the classes is determined by a simple method. In the second unit, called approximation unit, a set of BP neural networks are trained with a robust training algorithm to predict the moment-rotation behavior of the bolted connections. This neural system is called self-organizing back propagation (SOBP)
www.SID.ir
SELF-ORGANIZING BACK PROPAGATION NETWORKS FOR PREDICTING…
631
neural networks. The numerical results show excellent performance generality for the SOBP in comparison with the single BP neural network.
2. Connection Model
ive
of
SI
D
The connection models selected for this study and verifying numerical modeling are taken from experiments of Azizinamini [4]. The objective of these tests is to investigate the effects of different geometric properties of connection such as top and web angles dimensions and bolt spacing on connection behavior. The test setup includes two beam segments with equal lengths which are symmetrically bolted to a stub column. Beam ends are simply supported and stub column can move vertically and applied load on center of stub column applies moment on connection. The test setup configuration is shown in Figure 1.
Figure 1. Test setup configuration and connection parameters of 14SX specimens [4]
Ar
ch
2.1 Geometry of connection models Azizinamini experiments include 18 test specimens of bolted top and seat angle connections with web angles. Geometrical properties of 17 connections of his 18 experiments are listed in Table 1. 2.2 Finite element modeling ANSYS [19] multi-purpose finite element modeling code is used to perform numerical modeling of connections. FE models created using ANSYS Parametric Design Language (APDL). Geometrical and mechanical properties of connection models were as parameters, thus the time of creating new models is considerably reduced. Numerical modeling of connection is performed including following considerations: all components of connection such as beam, column, angles and bolts head are modeled using eight node-first order SOLID45 elements and bolt shanks are modeled using SOLID64 element which can consider thermal gradient applied for pretension force of bolts [20-21]. Bolts holes are 1.6 mm larger than bolt diameter. Just half of the connection is modeled because of the symmetry about web plane. The model contains just flange and stiffeners of the column assuming its high rigidity due to the stiffeners. ANSYS can model contact problems using contact pair elements: CONTA174 and TARGE170, which pairs together in a way that no
www.SID.ir
E. Salajegheh, S. Gholizadeh and A. Pirmoz
632
penetration occurs during loading process. So the effect of adjacent surfaces interaction, including angle-beam flange, angle/beam flange-bolt head/nut, bolt hole-bolt shank and effect of friction, are modeled using mentioned contact elements. Bolts head and nut modeled hexagonal and similar to their actual shape. To consider the frictional forces, Coulomb’s coefficient is assumed as 0.25 as the yielded results had better agreement with test results. The FE model and mesh pattern of connection is shown in Figure 2. Shape of bolts head and nut, stiffeners of column stub and nonlinearity of bolt shanks (discussed in Section 2.4) are main differences between current study and Ref. [6] models.
D
Table 1. Geometrical properties of Azizinamini connections Top and Seat angle Specimen Number
Bolt diamete r (mm)
Column section
Beam section
14S1
19.1
W12X96
W14X38
L6X4X3/8
14S2
19.1
W12X96
W14X38
14S3
19.1
W12X96
14S4
19.1
14S5
Web angle
Gauge (mm)
Bolt spacing (mm)
Angle
Length (mm)
20.32
6.35
13.97
2L4X3-1/2X1/4
215.9
L6X4X1/2
20.32
6.35
13.97
2L4X3-1/2X1/4
215.9
W14X38
L6X4X3/8
20.32
6.35
13.97
2L4X3-1/2X1/4
139.7
W12X96
W14X38
L6X4X3/8
20.32
6.35
13.97
2L4X3-1/2X3/8
215.9
22.3
W12X96
W14X38
L6X4X3/8
20.32
6.35
13.97
2L4X3-1/2X1/4
215.9
14S6
22.3
W12X96
W14X38
L6X4X1/2
20.32
6.35
13.97
2L4X3-1/2X1/4
215.9
14S8
22.3
W12X96
W14X38
L6X4X5/8
20.32
6.35
13.97
2L4X3-1/2X1/4
215.9
8S1
19.1
W12X58
W8X21
L6X31/2X5/16
15.24
5.08
8.89
2L4X3-1/2X1/4
139.7
8S2
19.1
W12X58
W8X21
L6X3-1/2X3/8
15.24
5.08
8.89
2L4X3-1/2X1/4
139.7
8S3
19.1
W12X58
W8X21
L6X31/2X5/16
20.32
5.08
8.89
2L4X3-1/2X1/4
139.7
19.1
W12X58
W8X21
L6X6X3/8
15.24
13.72
8.89
2L4X3-1/2X1/4
139.7
19.1
W12X58
W8X21
L6X4X3/8
20.32
6.35
8.89
2L4X3-1/2X1/4
139.7
8S6
19.1
W12X58
W8X21
L6X4X5/16
15.24
6.35
8.89
2L4X3-1/2X1/4
139.7
8S7
19.1
W12X58
W8X21
L6X4X3/8
15.24
6.35
8.89
2L4X3-1/2X1/4
139.7
8S8
22.3
W12X58
W8X21
L6X31/2X5/16
15.24
5.08
8.89
2L4X3-1/2X1/4
139.7
8S9
22.3
W12X58
W8X21
L6X31/2X3/16
15.24
5.08
8.89
2L4X3-1/2X1/4
139.7
8S10
22.3
W12X58
W8X21
L6X3-1/2X1/2
15.24
5.08
8.89
2L4X3-1/2X1/4
139.7
8S5
of
ive
ch
Ar
8S4
SI
Lengt h (mm)
Angle
www.SID.ir
633
SI
D
SELF-ORGANIZING BACK PROPAGATION NETWORKS FOR PREDICTING…
Figure 2. FE modeling of connection 14S2 with 16070 elements and 17134 nodes
Ar
ch
ive
of
2.3 Boundary conditions and applied loads To satisfy symmetry conditions all nodes of web plane are restrained against outward motion. Here it should be noted that, since the beams of the connections are compact sections so the local buckling instabilities occur in the inelastic range or high stress levels, while the von Mises stress distribution in FE models clarifies that the beam remains almost elastic and so the local buckling failure mode can be ignored in the FE models. Bolts pretension is applied as the first load case, for this purpose a thermal gradient is applied on bolts shank to yield an equivalent pretension force yields. Since there is no information about the amount of bolts pretension in this experiment, design values of pretension force [2] are applied. 178kN pretension force is applied to 22.3 mm bolt diameter and 133kN for 19.1 mm. To apply bolts pretension, a thermal gradient imposed on bolts shank as first loading case. The 50 mm vertical displacement is applied on the nodes of beam end to impose the moment on connection. This value of beam end displacement yields a rotation near to 0.03 rad. Resulting moment and relative rotation of connections are evaluated as:
M = P.L ε −ε R= 1 2 h
(1) (2)
where M is applied connection moment, P is summation of the reactions of applied displacement on beam end nodes; L corresponds to beam length, R is relative rotation of connection, h is beam depth, ε 1 and ε 2 are relatively top and bottom flange horizontal displacements, respectively. 2.4. Material properties Stress-strain relation for all connection components except bolts is represented using three-
www.SID.ir
E. Salajegheh, S. Gholizadeh and A. Pirmoz
634
D
linear constitutive model. Isotropic hardening rule with von Mises yielding criterion is applied to simulate plastic deformations of connection components and fracture of material is not considered. ASTM A36 steel was used for the beam, column and angles. In current study mechanical properties of beam, column and angles materials are taken from numerical study of achieved in [6]. Yield stress and ultimate strength of bolts are assumed based on nominal properties of A325 bolts. Bolt materials modeled bilinear with 634.3 MPa yield stress and ultimate stress of 930 MPa at 8% strain. Modulus of elasticity and Poisson’s ratio is considered respectively 210 GPa and 0.3. Stress-strain relation of A36 steel used for beam and angle material of this study and numerical study of [6] are shown in Figure 3.
3. Verification of Finite Element Models
SI
To evaluate accuracy of FE modeling approach, 17 FE models are created according to Azizinamini tests and the results are compared with test results. Deformed shape of the connection is shown in Figures 4 and 5.
of
1000
800
Et=3845.1MPa
strain=0.0030 stress=634.0
strain=0.0485
ive
stress(MPa)
600
400
stress= 510
strain=0.0013
200
A36 steel
stress=276.9
A325 Bolts
ch
0
0
0.02
0.04 strain
0.06
0.08
Ar
Figure 3. Material properties of beam, column and angle [6]
Figure 4. Deformed shape of connection 14S2 at 0.03 rad
www.SID.ir
SELF-ORGANIZING BACK PROPAGATION NETWORKS FOR PREDICTING…
635
D
Figure 5. Top bolt-angle surfaces interaction of connection 14S2 at 0.03 rad
of
SI
Comparison of moment-rotation relations of FE modeling with test data indicates that the results obtained from FE models have a good agreement with test data and numerical study of Citipitioglu [6]. Difference between numerical simulation and test results may be raised due to several causes like numerical modeling simplification, test specimen defects, residual stress and bolts pretension [13].
4. Self-Organizing Back Propagation (SOBP) Neural Networks
ch
ive
The principal advantage of a properly trained neural network is that it requires a trivial computational burden to produce an approximate solution. Such approximations appear to be valuable in situations where the actual response computations are intensive in terms of computing time and a quick estimation is required. Well-known neural network models are widely used in civil and structural engineering applications [22-23]. In this study, a combination of SOM and BP neural networks are employed to predict the moment-rotation behavior of the bolted connection.
Ar
4.1. Self organizing map neural networks The self organizing map (SOM) is a neural network algorithm developed by Kohonen [24] that forms a two dimensional presentation from multi dimensional data. The SOM learn to classify input vectors according to how they are grouped in the input space. In the SOM neighboring neurons learn to recognize neighboring sections of the input space. Thus, SOM learn both the distribution and topology of the input vectors they are trained on. The neurons in the layer of an SOM are arranged originally in physical positions according to a specific topology. A SOM neural network identifies a winning neuron using a simple procedure. Whereas an input vector is presented to the neural network, the output value of neuron i can be obtained by computing the Euclidean distance between its weight vector and the input vector as: oi =
ninp
∑ (Y j =1
j
− U ij ) 2 , i = 1,2, L , mSOM
(3)
If the neuron i* satisfies the Eq. (4) then it is the winner.
www.SID.ir
E. Salajegheh, S. Gholizadeh and A. Pirmoz
636
oi* = min (oi ) , i = 1,2, L , mSOM i
(4)
where Uij is the weight of SOM layer from input i to neuron j, Yj is jth component of the input vector. Number of input vectors’ component and SOM neurons are ninp and mSOM, respectively. However, instead of updating only the winning neuron, all neurons within a certain neighborhood of the winning neuron are updated, using the Kohonen rule. Specifically, all such neurons are adjusted as: (5)
D
U ij (k + 1) = U ij (k ) + α[Y j (k ) − U ij (k )]
SI
where α is learning rate and k is discrete time. Here the neighborhood Ni(d) contains the indices for all of the neurons that lie within a radius d of the winning neuron i. Thus, when an input vector is presented, the weights of the winning neuron and its close neighbors move toward the vector. Thus, after many presentations, neighboring neurons have learned vectors similar to each other.
ive
of
4.2. Back propagation neural networks Standard BP is a gradient descent algorithm, in which the network weights are moved along the negative of the gradient of the performance function. There are a number of variations on the basic algorithm that are based on other standard optimization techniques. In this study, Levenberg-Marquardt (LM) [25] algorithm is employed. The basic BP algorithm adjusts the weights in the steepest descent direction. This is the direction in which the performance function is decreasing most rapidly. One iteration of the algorithm is: (6)
ch
Wk +1 = Wk − α k G k
Ar
where W k is a vector of current weights, G k is the current gradient, and αk is the learning rate. Newton’s method is an alternative to the conjugate gradient methods for fast optimization. The basic step of Newton’s method is as: Wk +1 = Wk − A −k 1G k
(7)
where A −k 1 is the Hessian matrix of the performance index at the current values of the weights. Newton’s method often converges faster than conjugate gradient methods. Unfortunately, it is complex and expensive to compute the Hessian matrix for feedforward neural networks. The LM algorithm was designed to approach second-order training speed without having to compute the Hessian matrix. When the performance function has the form of a sum of squares, then the Hessian matrix can be approximated as: H = JTJ
(8)
www.SID.ir
SELF-ORGANIZING BACK PROPAGATION NETWORKS FOR PREDICTING… G = JTE
637
(9)
where J is the Jacobian matrix that contains first derivatives of the network errors with respect to the weights, and E is a vector of network errors. The Jacobian matrix can be computed through a standard backpropagation technique [28] that is much less complex than computing the Hessian matrix. The LM algorithm uses this approximation to the Hessian matrix in the following Newton-like update: Wk +1 = Wk − [J T J + µ I]−1 J T E
(10)
ive
of
SI
D
where µ is a correction factor. The value of µ is decreased after each successful step (reduction in performance function) and is increased only when a tentative step would increase the performance function. In this way, the performance function is always reduced at each iteration of the algorithm [26]. One of the problems that occur during neural network training is called overfitting. The error on the training set is driven to a very small value, but when new data is presented to the network the error is large. The network has memorized the training examples, but it has not learned to generalize to new situations. One method for preventing of overfitting and improving network generalization is called regularization. This involves modifying the performance function, which is normally chosen to be the sum of squares of the network errors on the training set. The typical performance function used for training neural networks is the mean sum of squares of the network errors: mse =
1 N
N
∑ (E ) i =1
2
i
(11)
Ar
ch
It is possible to improve generalization if the performance function is modified by adding a term that consists of the mean of the sum of squares of the network weights: msereg = γmse+
(1 − γ) n ∑ W j2 n j =1
(12)
where γ and n are the performance ratio and number of network weights, respectively. Using this performance function causes the network to have smaller weights, and it forces the network response to be smoother and less likely to overfit [27]. 4.3. Architecture of SOBP neural networks In the present paper, the typical input vector is as follows: X T = { d b I b t t lt t w l w s g }
(13)
where, db, Ib, tt, lt, tw, lw, s and g are bolts diameter, moment of inertia of beam, thickness and length of top-seat and web angles, bolts spacing and gauge, respectively.
www.SID.ir
E. Salajegheh, S. Gholizadeh and A. Pirmoz
638
The output vectors include the corresponding moment-rotation behavior of top and seat bolted angle connections with double web angles. In these vectors, the moments associated with the 0.0, 1.0, 2.0, 3.5, 5.0, 6.5, 8.0, 11.0, 15.0, 20.0, 25.0, and 30.0 rad are captured. Thus, the typical output vector can be expressed as: O T = {M θ =0 M θ =1 M θ =2 M θ =3.5 M θ =5 M θ =6.5 M θ =8 M θ =11 M θ =15 M θ =20 M θ =25 M θ =30 }
(14)
The input and output matrices are as follows: (15)
D
X = [ X i ] , O = [O i ] , i = 1,..., nts
ch
ive
of
SI
where X and O are matrices contained input and output vectors, respectively. The number of training samples is expressed by nts. As the single BP network trained to predict the moment-rotation behavior of bolted connections appears improper performance generality, it is necessary to design an accurate neural system for the mentioned purpose. In the testing mode of the single BP network it is observed that the performance generality of the network is poor over the some test samples while it is good over the others. Therefore we need a set of BP networks organized by a clustering algorithm. In order to design the SOBP, it is necessary to divide the training samples into some classes. SOM network is utilized for this purpose. To train the SOM and find the optimal number of data classes a simple procedure is performed. In this procedure, at first, some grids of SOM neurons with random topology are selected and the SOM is trained involving the mentioned grids. During the training process the SOM neurons concentrate on distinguishable regions. The number of these regions is taken into account as the optimal number of the SOM neurons. At last, a SOM network with the optimal number of SOM neurons is trained. Let ms be the optimal number of SOM neurons, therefore
(16)
Ar
⎧Class 1 : X C 1 = [X j ] , O C 1 = [O j ] , j = 1, …, nC 1 ⎪ ⎪Class 2 : X C 2 = [X j ] , O C 2 = [O j ] , j = 1, …, nC 2 X , O → SOM Clustering → ⎨ M ⎪ ⎪Class ms : X C = [X j ] , O C = [O j ] , j = 1, …, nCm ms ms s ⎩
where nC i is the number of data located in class i. After classification the samples, a BP network is trained for each class by using its assigned data: ⎧X C 1 , O C 1 → BP network 1 ⎪X , O → BP Network 2 ⎪ C2 C2 ⎨ M ⎪ ⎪X Cm , O Cm → BP Network ms s s ⎩
(17)
In this manner, a neural system including two processing units, classification and
www.SID.ir
SELF-ORGANIZING BACK PROPAGATION NETWORKS FOR PREDICTING…
639
of
SI
D
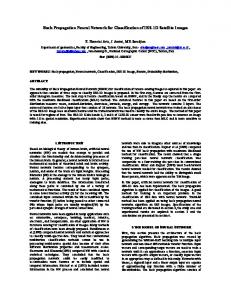
approximation, is designed for predicting the moment-rotation behavior of bolted connections. The SOBP and its processing units are displayed in Figure 6. It should be noted that XCi ⊂ X, OCi ⊂ O, i=1,…,ms. In the traditional method X and O are employed to train the single BP network.
ive
Figure 6. The architecture of SOBP
ch
In order to evaluate the accuracy of approximate moment-rotation curves predicted by the neural networks, two evaluation metrics are used: the relative root mean square (RRMS) error and R-square (R2) statistic measurement. The RRMS between the exact and predicted curves is defined as follows: RRMSE =
1 r 1 r ~ (λ i − λ i ) 2 ( ∑ (λ i ) 2 ) −1 ∑ r - 1 i =1 r i =1
(18)
Ar
where, λi and λ~i are the ith component of the exact and predicted responses, respectively. To measure how successful fitting is achieved between exact and approximate curves, the R-square statistic measurement is employed. Statistically, the R2 is the square of the correlation between the predicted and the exact curves. It is defined as follows: r r ~ R - square = 1 − ∑ (λ i − λ i ) 2 (∑ (λ i − λ ) 2 ) −1 i =1
(19)
i =1
where λ is the mean of exact vectors component. The vectors dimension is expressed by r. The main steps of training of the SORBF neural networks are displayed in the following flowchart:
www.SID.ir
E. Salajegheh, S. Gholizadeh and A. Pirmoz
of
SI
D
640
ive
Figure 7. The flowchart of the SOBP training
5. Training and Testing the Single BP and SOBP Neural Networks
Ar
ch
A total number of 60 samples are generated employing ANSYS. From which 44 samples are used for training and 16 ones are used for testing the performance generality of the neural network. In order to train the single BP neural networks, LM algorithm is used and 4 neurons are adopted in the hidden layer. The number of the neurons is determined by trail and error. The single BP neural network is trained in 12000 epochs. Topology of the single BP neural network is shown in Figure 8. Training of the SOBP neural networks is achieved in two stages. In the first stage, an SOM neural network is trained to classify the inputs. In order to determine the number of the classes, some arbitrary grids of SOM neurons with random topology are considered. After training the SOM neural networks with the mentioned grids it is observed that the SOM neurons tend to concentrating about two main clusters. In order to simplify training of the SOBP, a reduced order grid of 2×1 SOM neurons is adopted here. Thus, all the input data is divided into two classes. Training of the SOM neural network by the above mentioned approach is achieved during 1000 training epochs. The number of data located in classes 1 and 2 are 23 and 21, respectively. In the approximation unit there are two BP neural networks trained by LM algorithm and each of them has two hidden neurons. The BP neural
www.SID.ir
SELF-ORGANIZING BACK PROPAGATION NETWORKS FOR PREDICTING…
641
ive
of
SI
D
networks are trained in 6000 and 2000 epochs, respectively. Thus, The SOBP is trained in 9000 epochs. From 15 test samples 9 and 7 ones are located in class 1 and 2, respectively.
ch
Figure 8. Topology of the BP network
The results obtained by the single BP and SOBP neural networks are compared in Table 2, Figures 9 and 10 in terms of RRMSE and R-square, respectively.
Ar
Table 2. Testing information of BP and SOBP neural network models
Neural network model
Average of RRMSE
Average of R-square
Number of the training epochs
BP
0.1451
0.8820
12000
SOBP
0.0255
0.9938
9000
www.SID.ir
E. Salajegheh, S. Gholizadeh and A. Pirmoz
642 0.4
RRMSE
0.3
0.2
0.1
0 2
3
4
5
6
7 8 9 10 Tese sample No.
11
12
13
14
15
16
15
16
D
1
SOBP;
BP)
SI
Figure 9. RRMSE of test samples (
1
of
0.8
0.7 1
2
ive
R-square
0.9
3
4
5
6
7 8 9 10 Tese sample No.
12
SOBP;
13
14
BP)
ch
Figure 10. R-square of test samples (
11
Ar
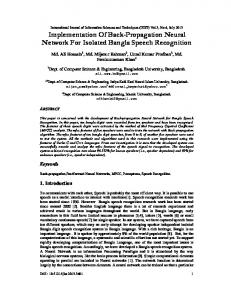
As shown in Table 2 and Figures 9 and 10, the performance generality of the SOBP is much better than that of the single BP network; furthermore, the computational burden of the SOBP training is lower than that of the single BP. The results of the SOBP testing are shown in Figure 11 for 6 test samples. Similar results exist for the other samples.
80
125
moment(KNm)
150
moment(KNm)
100
100
60 40 Neural Netw ork 20
Finite Element
75 50
Neural Netw ork
25
Finite Element
0
0 0
5
10 15 20 rotation(m rad)
25
30
0
5
10 15 20 rotation(m rad)
25
30
www.SID.ir
SELF-ORGANIZING BACK PROPAGATION NETWORKS FOR PREDICTING… 150
100
125
moment(KNm)
80
100
60 40 Neural Netw ork 20
Finite Element
50
Neural Netw ork 25
Finite Element
0
0 0
5
10 15 20 rotation(m rad)
25
0
30
60
5
10 15 20 rotation(m rad)
25
30
SI
50
30 20 10
Finite Element
0
36 24
of
Neural Netw ork
moment(KNm)
48
40 moment(KNm)
75
D
moment(KNm)
643
Neural Netw ork
12
Finite Element
0
5
10 15 20 rotation(m rad)
25
30
0
5
10 15 20 rotation(m rad)
25
30
ive
0
Figure 11. Comparison between results of FE models and the SOBP prediction
7. Concluding Remarks
Ar
ch
It can be observed that proper conformance exist between FE and the SOBP results.
In this paper the moment-rotation behavior of top and seat bolted angle connections with double web angles is evaluated using finite element modeling and neural network techniques. In finite element models all the connection components are modeled using brick elements also interaction of all adjacent surfaces are modeled using contact elements. All geometrical and mechanical properties of the connection components are as parameter. Material nonlinearity, large deformation effects and nonlinearity of contact algorithm caused a highly nonlinear model which is very time consuming method to evaluate the momentrotation behavior of this type of connections. Using neural networks to predict the moment-rotation behavior of the bolted connections is an alternative to comprehensively reduce the computational burden of the finite element analysis. Employing a single BP neural network shows poor performance generality. In order to attain appropriate performance generality a neural system including SOM and a set of BP neural networks is proposed. This neural system is called self-organizing back
www.SID.ir
E. Salajegheh, S. Gholizadeh and A. Pirmoz
644
propagation (SOBP) neural networks. The numerical results demonstrate the computational advantages of the SOBP neural networks in comparison with the single BP. The accurate results indicate that the SOBP neural model can be used as an alternative method to overcome difficulties in estimating the moment rotation behavior of the connections.
References
6.
7.
8. 9.
10.
11. 12.
13.
14. 15.
D
SI
5.
of
4.
ive
3.
ch
2.
AISC, Manual of steel construction, Allowable Stress Design Specification, American Institute of Steel Construction, Chicago, ILL, 1989. AISC, Manual of steel construction-Load and resistance factor design, American Institute of Steel Construction, Chicago, ILL, 1995. Akbas B, Shen J. Seismic behavior of steel buildings with combined rigid and semirigid frames, Turkish Journal of Engineering and Environmental Sciences, 27(2003)253-64. Azizinamini. Monotonic response of semi-rigid steel beam to column connections, M. Sc. Thesis, University of South Carolina, Columbia, 1982. Shen J, Astaneh-Asl A. Hysteretic behavior of bolted-angle connections, Journal of Constructional Steel Research, 51(1999)201-18. Citipitioglu AM, Haj-Ali RM, White DW. Refined 3D finite element modeling of partially restrained connections including slip, Journal of Construct Steel Research, 8(2002)995-1013. Kishi N, Ahmed A, Yabuki N. Nonlinear finite element analyses of top and seat-angle with double web-angle connections, Journal of Structural Engineering and Mechanics, 12(2001)201-14. Ahmed N, Kishi N, Matsuoka K, Komuro M. Nonlinear analysis on prying of top-and seat-angle connections, Journal of Applied Mechanics, 4(2001)227-36. Yang, JG, Murray TM, Plaut RH. Three-dimensional finite element analyses of double angle connections under tension and shear, Journal of Constructional Steel Research, 54(2000)227-44. Hong K, Yang JG, Lee SK. Parametric study of double angle framing connections subjected to shear and tension, Journal of Constructional Steel Research, 57(2001)9971013. Hong K, Yang JG, Lee SK. Moment-rotation behavior of double angle connections subjected to shear load, Engineering Structures, 24(2002)125-32. Pirmoz A, Saedi Daryan A, Mazaheri A, Ebrahim Darband H. Behavior of bolted angle connections subjected to combined shear force and moment, Journal of Constructional Steel Research, 2008 (in press). Danesh F, Pirmoz A, Saedi Daryan A. Effect of shear force on the initial stiffness of top and seat angle connections with double web angles, Journal of Constructional Steel Research, 63(2007)1208-18. Rafiq MY, Bugmann G, Easterbrook DJ. Neural network design for engineering applications, Computers and Structures, 79(2001)1541-52. Bateni SM, Borghei SM, Jeng DS. Neural network and neuro-fuzzy assessments for
Ar
1.
www.SID.ir
SELF-ORGANIZING BACK PROPAGATION NETWORKS FOR PREDICTING…
22. 23.
24. 25. 26. 27. 28.
D
SI
21.
of
19. 20.
ive
18.
ch
17.
scour depth around bridge piers, Engineering Applications of Artificial Intelligence, 20(2007)401-14. Abdala KM, Stavroulakis GEA. Backpropagation neural network model for semi-rigid joints, Microcomputers in Engineering, 10(1995)77-87. Anderson D. Application of artificial neural networks to the prediction of minor axis joints, Computers and Structures, 63(1997)685-92. De Lima LRO, da S, Vellasco, PCG, de Andrade SAL, da Silva JGS. Neural networks assessment of beam-to-column joints, Journal of the Brazil Society of Mechanical Science and Engineering, 27(2005)314-24. ANSYS Release 8.1 Documentation, ANSYS Incorporated, 2004. Belytschko T, Liu WK, Moran B. Nonlinear Finite Elements for Continua and Structures, John Wily and Sons, LTD. 650P, 54(2000)317-43. Zienkiewicz OC, Taylor RL. The Finite Element Method, Volume 2: Solid Mechanics, Fifth Edition, Butterworth-Heinemann, 2000. Salajegheh E, Gholizadeh S. Optimum Design of Structures by an Improved Genetic Algorithm and Neural Networks, Advances in Engineering Software, 36(2005)757-67. Kaveh A, Dehkordi F, Servati H. Prediction of moment-rotation characteristic for saddle-like connections using BP neural networks, Asian Journal of Civil Engineering, 2(2001)11-30. Kohonen T. Self-Organization and Associative Memory, Springer-Verlag, 2nd Edition, Berlin, 1987. Hagan MT, Menhaj M. Training feed-forward networks with the Marquardt algorithm, IEEE Transaction on Neural Networks, 5(1999)989-93. Hagan MT, Demuth HB, Beal MH. Neural Network Design. PWS Publishing Company, Boston, 1996. The Language of Technical Computing, MATLAB. R2006a. Math Works Inc, 2006 Rumelhart DE, Hinton GE, Williams RJ. Learning representations by back-propagating errors, Nature, 323(1986)533-6.
Ar
16.
645
www.SID.ir