Semi-automated landslide mapping from historical and recent aerial photography Daniel Hölbling University of Salzburg Department of Geoinformatics - Z_GIS Schillerstrasse 30 5020 Salzburg, Austria
[email protected]
Harley Betts Landcare Research Private Bag 11052 Manawatu Mail Centre Palmerston North 4442, New Zealand
[email protected]
Raphael Spiekermann Landcare Research Private Bag 11052 Manawatu Mail Centre Palmerston North 4442, New Zealand
[email protected]
Chris Phillips Landcare Research P.O. Box 69040 Lincoln 7640, New Zealand
[email protected]
Abstract In this paper we present a semi-automated object-based image analysis (OBIA) approach for mapping landslides on historical and recent aerial photographs for a study site southeast of the town of Pahiatua, southeastern North Island, New Zealand, where landslide erosion is a serious land management problem. We focussed on a transferable method that works across both panchromatic and 3-band natural color images. Aerial photographs from five different dates, ranging from 1944 to 2011, were available for this study. The results from semi-automated mapping were compared to manual landslide mapping. Visual image interpretation is still the most widely used method for accurately identifying and mapping landslides, but it is a time-consuming process and thus limited to small-scale studies. Any large-scale identification and mapping exercise would likely benefit from a certain degree of automation. Advantages and disadvantages of both mapping approaches are discussed. Keywords: landslides, object-based image analysis (OBIA), aerial photography, visual interpretation, remote sensing
1
Introduction
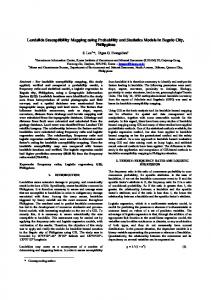
Landslide erosion is a serious land management problem in New Zealand where a combination of steep erodible hill country, a maritime climate featuring frequent and intense rainstorms and recent forest clearance for farming has led to extensive landslide erosion on many parts of the country’s hill country farmland (Figure 1). Figure 1: Landslides caused by a heavy rainstorm in June 2015.
Source: Photo taken by Harley Betts.
Understanding the extent and severity of landsliding in New Zealand usually relies on detailed manual mapping from aerial photography [1] and, more recently, spectral classification of regional satellite imagery following major storm events [2]. For catchment- to farm-scale applications, however, visual image interpretation and mapping has to date been the most widely used method for accurately identifying and mapping landslides, but it has the drawback of being a time-consuming and tedious process and thus is limited to studies of relatively small areas. Moreover, visual interpretation is a subjective process and results may vary according to the skills and experience of the interpreter, the quality and resolution of the underlying data, the mapping scale, the complexity of the study area and the purpose of the manual mapping [3, 4, 5]. The development of semi-automated image classification techniques offers the potential to significantly improve existing manual landslide mapping techniques, especially when combined with a degree of visual interpretation to create a “hybrid” approach to landslide identification. Over the last decade, object-based image analysis (OBIA) has been increasingly used for semi-automated landslide mapping using remote sensing data. Image segmentation algorithms such as the multiresolution segmentation [6] can be applied to create image objects, which serve as basis for the classification process. For classification a range of characteristics of image objects, such as spectral, spatial,
AGILE 2016 – Helsinki, June 14-17, 2016
contextual and textural properties, can be used. This is especially valuable when mapping complex natural features such as landslides and constitutes an advantage over pixelbased approaches. Most often, high resolution (HR) or very high resolution (VHR) optical satellite images are used in combination with a digital elevation model (DEM) and its derivatives such as slope or curvature. However, relatively few studies in the literature so far have used aerial photographs for object-based landslide mapping [7, 8, 9]. Even less research has been done for semi-automatically detecting landslides on panchromatic images, even though the creation of historical landslide inventory maps relies on the analysis of remote sensing data that has been acquired over past few decades and is mostly only available in black and white [10]. In this paper we present a semi-automated OBIA approach for mapping landslides on historical and recent aerial photographs for a landslide-prone study site in New Zealand. The transferability of the method across both panchromatic and 3-band natural color aerial photographs from different years is tested, and the results from semi-automated mapping are compared to the results from visual image interpretation.
2
Study area and data
The ~217 hectare study area is located approximately 5 kilometers southeast of the town of Pahiatua, southeastern North Island, New Zealand. It comprises pastoral hill country on moderately indurated Tertiary sandstone and mudstone, with relief in the order of 100 to 300 m above sea level and slopes typically in the 16 to 25 degree range. Most of the area’s indigenous forest cover was cleared following European settlement in the late 1800s and early 1900s and, as a consequence, rain-triggered shallow landslide erosion is common. Historical aerial photographs were acquired for a range of dates ranging from 1944 to 2011 (Table 1). Aerial photography was supplied as orthorectified digital images with a nominal positional accuracy of 15 meters. Table 1: Aerial photographs used in this study. Acquisition Spatial resolution Spectral date (m/pixel) resolution 31/03/1944 0.4 panchromatic 17/12/1979 0.4 panchromatic 01/05/1997 0.4 panchromatic 16/01/2005 0.75 3-band natural color 25/01/2011 0.4 3-band natural color
3 3.1
Methods Object-based landslide mapping
The semi-automated object-based landslide mapping approach has been developed on the most recent aerial photographs from 2011 and subsequently transferred to the
other images. Analyses have been conducted in eCognition (Trimble) software, defining a set of knowledge-based classification rules. The basic workflow is shown in Figure 2. Figure 2: Workflow for object-based landslide mapping.
First, image objects were created by applying the multiresolution segmentation algorithm. Spectral information (panchromatic band or RGB bands, respectively) and the slope layer were then considered for image segmentation. To increase the transferability of the method across the 3-band natural color and panchromatic images, the spectral values of the RGB bands available for 2011 and 2005 were not used during rule-based classification. Instead, an average or “panchromatic” brightness layer was calculated for the multispectral images by dividing the sum of the three spectral bands by three. For the classification of landslides this brightness/panchromatic layer was mostly used, since landslides appear brighter than their immediate surroundings on the photographs due to the exposure of bare ground [3]. Additionally, slope thresholds were also applied in conjunction with the brightness/panchromatic information. False positives were removed by using spatial properties of image objects such as compactness or length/width together with slope thresholds. Finally, classified polygons smaller than 10 m² were eliminated. The approach has then been transferred to the other aerial photographs, whereby only minor adaptations of the thresholds and small changes regarding the usage of specific image properties were necessary.
3.2
Visual interpretation of landslides
Visual landslide interpretation from the orthorectified digital imagery was carried out on-screen using ArcGIS 10.0 (ESRI). Landslides were digitized at scales ranging between 1:600 and 1:1250. Each landslide was then subdivided visually into ‘scar’ and ‘debris tail’ in an effort to separate sediment sources (scars) from areas receiving sediment (debris tails). As for the semi-automated object-based mapping, the landslides were mapped on each photograph. The ultimate aim of the mapping was to identify all landslides that had occurred since the date of the first photography. The mapping results were stored as polygon shapefiles containing delineated
AGILE 2016 – Helsinki, June 14-17, 2016
landslides, subdivided into scars and debris tails, for each date of photography.
4
Results
When comparing the absolute area of mapped landslides between the semi-automated object-based mapping and the manual mapping, only minor differences were detected (Figure 3). A slight trend towards overestimating the landslide area with OBIA compared to the manual mapping can be recognized for the two panchromatic images from 1979 and 1997, whereas fewer landslides were mapped by OBIA on the two RGB images. Figure 3: Comparison of mapped landslide area (OBIA vs. manual mapping) for each aerial photograph.
During visual interpretation landslides were differentiated into tails and scars. This could not be done with OBIA since there were no distinct characteristics, neither spectral nor spatial, which would have facilitated such a differentiation in a semi-automated manner. Thus, for comparison of the results, only the overall landslide area was considered. The amount of overlapping area and the respective producer’s and user’s accuracies per mapping result are given in Table 2. The manual mapping was taken as reference for the calculation of the accuracy values. A good demonstration of the landslide mapping results for 1944 and 2005 is shown in Figure 4. While the accuracy values are moderate (Table 2), the distribution of the detected landslides over both results matches well (Figure 4). For calculating the accuracy values the absolute overlapping area was used instead of comparing the absolute number of corresponding landslides. The reason for this is that the precise delineation of single landslides – as possible during manual mapping – is an intricate task in semi-
automated analysis since segmentation-derived image objects often do not exactly represent single landslides. Most of the landslides have been correctly detected by OBIA, but the actual delineation of landslide polygons varies slightly between the two methods.
5
Discussion and Conclusions
During visual interpretation, fewer landslide tails than scars were mapped, because tails had frequently grassed over prior to aerial photography being captured, whereas scars tended to take longer to revegetate owing to a lack of remaining soil on the scar faces. The cumulative area covered by landslide scars was considerably less than that covered by tails, reflecting the fact that sediment generated from even small scars is often spread over a relatively large downslope area. Further research is needed to reliably perform such a differentiation of landslide source and deposition area with OBIA. As with manual mapping, semi-automated (OBIA) mapping results would be sensitive to the length of time elapsed between an erosion event and the next available aerial imagery. Imagery taken immediately after a storm (for example, showing fresh landsliding as shown in Figure 1) is best for capturing the full extent of landslide erosion and deposition, but an accurate delineation of the actual source areas (landslide scars) by OBIA may be facilitated with additional imagery taken some weeks after an event in which the depositional tails will have started to revegetate, whilst the scars would still be clearly visible and easily delineated. Running the OBIA method on sequential photography of the same area could potentially address the source-versus-sink delineation issue while also capturing the total areas affected by landsliding. The manual approach shows advantages for delineating single landslides or splitting up compound landslides complexes into separate landslides. This is a challenge in OBIA since image objects created through segmentation rarely correspond to single landslides due to over- or undersegmentation. Advanced split and merge algorithms could be used to refine the delineation of image objects. However, the creation of “meaningful” objects with regard to a particular context or aim can be very complex [11]. Thus, instead of comparing the absolute number of mapped landslides, the overlapping area was used for calculating the mapping accuracy in this study. Although results from manual mapping performed by local experts are often the only reference available, they cannot constitute a completely true reference as their generation depends on various factors [3]. This has to be considered when interpreting accuracy values. Manual mapping, while generally accurate within the limits of image quality, is a very time-consuming process, and any
Table 2: Mapping results (in hectare), overlapping area and producer’s and user’s accuracy per image Aerial photograph OBIA mapping Manual mapping Overlapping Producer’s User’s (year) (ha) (ha) area (ha) accuracy (%) accuracy (%) 1944 2.72 2.83 1.61 56.91 59.22 1979 2.43 1.94 1.15 59.18 47.29 1997 2.92 2.24 1.39 62.09 47.75 2005 14.82 15.84 10.62 67.04 71.67 2011 3.41 4.63 2.55 55.05 74.66
AGILE 2016 – Helsinki, June 14-17, 2016
Figure 4: Landslide mapping results on basis of the aerial photographs from 1944 (above) and 2005 (below). In each case the result from OBIA landslide mapping is shown on the left side (in yellow) and the manual landslide mapping is shown on the right side (in red).
large-scale identification and mapping exercise would likely benefit from a degree of automation. For example, automating the initial delineation of areas of bare ground – a slow, repetitive task – could enable the quick identification of target areas, which then can be interpreted accordingly by an experienced researcher. It is likely that such a hybrid approach combining both semi-automated feature delineation and manual interpretation will produce acceptably accurate mapping results with the potential to greatly reduce the effort required.
Graeme Vial and Peter Hewitt who kindly allowed us to access their Pahiatua properties to carry out field work. New Zealand Aerial Mapping Limited, Aerial Surveys Ltd and Horizons Regional Council (Manawatu, New Zealand) are thanked for supplying us with aerial imagery. The New Zealand mapping was funded in part by a subcontract from AgResearch as part of the Clean Water Productive Land Research programme funded by the New Zealand Ministry of Business, Innovation and Employment contract C10X1006.
References Acknowledgements This research has been partly supported by the Austrian Research Promotion Agency FFG in the Austrian Space Applications Program (ASAP 11) through the project “Land@Slide” (contract no: 847970). We would like to thank
[1] R. C. De Rose, N.A. Trustrum and P. M. Blaschke. Postdeforestation soil loss from steepland hillslopes in Taranaki, New Zealand. Earth Surface Processes and Landforms, 18(2):131-144, 1996.
AGILE 2016 – Helsinki, June 14-17, 2016
[2] J. R. Dymond, A.-G. Ausseil, J. D. Shepherd and L. Buettner. Validation of a region-wide model of landslide susceptibility in the Manawatu-Wanganui region of New Zealand. Geomorphology, 74(1-4):70-79, 2006. [3] D. Hölbling, B. Friedl and C. Eisank. An object-based approach for semi-automated landslide change detection and attribution of changes to landslide classes in northern Taiwan. Earth Science Informatics, 8(2):327-335, 2015. [4] F. Guzzetti, A. C. Mondini, M. Cardinali, F. Fiorucci, M. Santangelo and K.-T. Chang. Landslide inventory maps: New tools for an old problem. Earth-Science Reviews, 112(1-2):42-66, 2012. [5] M. Galli, F. Ardizzone, M. Cardinali, F. Guzzetti and P. Reichenbach. Comparing landslide inventory maps. Geomorphology, 94(3-4):268-289, 2008. [6] M. Baatz and A. Schäpe. Multiresolution Segmentationan optimization approach for high quality multi-scale image segmentation. In J. Strobl, T. Blaschke and G. Griesebner, editors, Angewandte Geographische Informationsverarbeitung XII, pages 12-23. Wichmann, Heidelberg, 2000. [7] J.-Y. Rau, J.-P. Jhan and R.-J. Rau. Semiautomatic object-oriented landslide recognition scheme from multisensor optical imagery and DEM. IEEE Transactions on Geoscience and Remote Sensing, 52(2):1336-1349, 2014. [8] A. Stumpf and N. Kerle. Object-oriented mapping of landslides using Random Forests. Remote Sensing of Environment, 115(10):2564-2577, 2011. [9] M. Moine, A. Puissant and J. P. Malet. Detection of landslides from aerial and satellite images with a semiautomatic method. Application to the Barcelonnette basin (Alpes-de-Hautes-Provence, France). In J. P. Malet, A. Remaitre and T. Bogaard, editors, Landslide Processes: From Geomorphological Mapping to Dynamic Modelling, pages 63-68. Strasbourg, France, 2009. [10] T. R. Martha, N. Kerle, C. J. van Westen, V. Jetten and K. V. Kumar. Object-oriented analysis of multi-temporal panchromatic images for creation of historical landslide inventories. ISPRS Journal of Photogrammetry and Remote Sensing, 67:105-119, 2012. [11] T. Blaschke, G. J. Hay, M. Kelly, S. Lang, P. Hofmann, E. Addink, R. Q. Feitosa, F. van der Meer, H. van der Werff, F. van Coillie and D. Tiede. Geographic ObjectBased Image Analysis - Towards a new paradigm. ISPRS Journal of Photogrammetry and Remote Sensing, 87:180-191, 2014.