in meeting total maximum daily load requirements. Erosion and sedimentation, one source of NPS pollution, is however a com plex natural process and is ...
Sensitivity of a Distributed Watershed Simulation Model to Spatial Scale Misgana K. Muleta, Ph.D., P.E. ; John W. Nicklow, Ph.D., P.E. ; and Elias G. Bekele, Ph.D. Abstract: The results of distributed watershed models could be sensitive to spatial and temporal scales at which inputs and model parameters are aggregated. This paper reports findings of a detailed sensitivity analysis conducted on the U.S. Department of Agriculture’s distributed watershed simulation model, known as the Soil and Water Assessment Tool (SWAT). The Big Creek Watershed, located in southern Illinois, is used for the study. The model is calibrated to improve accuracy of its streamflow and sediment concentration predictions using observed data at two locations in the study watershed. Streamflow and sediment concentrations that are simulated by the calibrated model at various spatial scales of discritization are extracted and compared, and inputs and model parameters responsible for sensitivity of model responses are identified. Several indices that could be used as indicators of model behavior are also derived. In addition, feasibility analysis of SWAT is conducted to see if the watershed simulation model could be used as a component in future decision support models developed to assist in identifying integrative watershed management practices that control agricultural nonpoint source pollutions from watersheds. The major findings of the study are: (1) accuracy of the raw model output (streamflow and sediment yield) is very poor for all delineations indicating the need for careful model calibration; (2) streamflow is relatively insensitive to spatial scale; and (3) sediment generated and sediment that leaves the watershed decreases as spatial scale gets coarser. Unlike the findings of previous studies, sediment yield significantly varies, even when properties of the outlet channel remain practically the same. (4) SWAT’s estimate of sediment yield is sensitive to human activities conducted in subbasins of the watershed, thus indicating the capability of SWAT to evaluate consequences of alternative watershed management practices.
Introduction Comprehensive and systematic management of watersheds could reduce the potential adverse impacts of agricultural nonpoint source (NPS) pollution on water resources and potentially assist in meeting total maximum daily load requirements. Erosion and sedimentation, one source of NPS pollution, is however a com plex natural process and is affected by many environmental and human factors such as soil type, land slope, climate, drainage density, and patterns of human disturbance in the watershed. Some of these environmental variables can be positively impacted with proper planning and management of the watershed, in cluding the use of farming practices that reduce levels of soil disturbance and degree of detachment (e.g., tillage type) and ad
aptation of land uses that reduce soil detachment and subsequent sedimentation. Exploring sound management practices among many alternatives requires, among other systems related analysis tools, a comprehensive watershed simulation model that indicates the environmental and hydrologic consequences of proposed management practices at “appropriate” spatial and temporal scales. The U.S. Department of Agriculture’s Soil and Water As sessment Tool (SWAT) is a comprehensive, spatially distributed, continuous simulator that has become popular in practice and could reveal the role of various management practices in reducing NPS pollution. Most environmental variables that affect erosion and sedimen tation, such as climate, topography, soil, and land use have sig nificant spatial and temporal variability (Wood 1998; Sposito 1998). The mathematical relationships that describe hydrologic processes as a function of these variables are dependent upon the spatial and temporal resolutions used in the modeling process. This implies that the scale at which model inputs and variables are aggregated and at which the algorithms of the model are implemented could have a significant impact on the accuracy of model simulations and on the reliability of the decisions drawn based on these model simulations. From the perspective of water flux or runoff response, for example, it has been recognized (Wood et al. 1988), that at “smaller scales,” actual patterns of topography, soil, land use, and rainfall characteristics are impor tant in governing watershed response. Data demand and the sub stantial effort and computational resources required to execute watershed models limits the scales that can be practically and feasibly handled. A question therefore arises as to the scale that is best suited for model execution, compromising between accuracy,
computational resources, and data availability. This paper pre sents, among other things, a spatial sensitivity analysis in order to investigate answers to the following: • How good is the accuracy of SWAT simulated streamflow and sediment concentration predictions at various spatial scales of discritization, and is it necessary to calibrate the model to improve its prediction accuracy for both streamflow and sedi ment concentrations? • Are SWAT outputs, particularly runoff and sediment generated and leaving the study watershed sensitive to the number of hydrologic response units (HRUs) (the scale at which inputs and parameters are aggregated)? • If the model is sensitive, what input characteristics are most responsible for the sensitivity? • What is the “optimal” number of HRUs for modeling the Big Creek Watershed? Few previous studies have investigated spatial sensitivity of SWAT. Using a watershed located in Texas, Mamillapalli et al. (1996) analyzed the effect of increasing the level of discritization on accuracy of the model outputs for runoff and concluded that increasing the level (i.e., using smaller modeling units) increases the accuracy of simulation. The writers also found that there is a level beyond which the accuracy cannot be improved. Bingner et al. (1997) investigated the effects of subwatershed size on adequately simulating annual flow and fine sediments in the Goodwin Creek Watershed located in Mississippi. Their major conclusion was that subwatershed size does not appreciably affect runoff volume, but they stressed the requirement for an upper limit on size to adequately simulate fine sediments. In addition, FitzHugh and Mackay (2000) have conducted an interesting study that not only analyzed how SWAT outputs behave in response to the spatial extent at which input parameters of the model are aggregated, but also identified the processes responsible for the behavior. Using a watershed located in Wisconsin, the major find ings they derived are that streamflow and outlet sediment yield are not seriously affected by changes in subwatershed size; that the lack of change in outlet sediment yield is due to a stable transport capacity in the lower part of the channel network; and that sediment generation does change substantially with level of watershed discritization. They highlighted that outlet sediment yield is mainly affected by properties of the outlet channel, in spite of other activities within the watershed and the amount of sediment generated. The findings of FitzHugh and Mackay (2000) imply that bas ing watershed management decisions on sediment yield at the outlet of the watershed, as simulated by SWAT, does not discrimi nate among positive and negative human activities carried out in the watershed. In essence, this supports the skepticism about the potential for using sediment yield leaving the watershed to accurately indicate the effects of human activities on upland ero sion. For example, using a watershed located in Wisconsin and applying some empirical approaches to estimate erosion and sedi mentation processes, Trimble (1981) indicated that only seven percent of human-induced sediment left the watershed, with the balance being deposited in the watershed. Under such circum stances, sediment that leaves the watershed could be less sensitive to human activities, and relying on such information to formulate broader management decisions could be misleading. For SWAT to be used as an erosion and sedimentation control tool for the Big Creek Watershed based on watershed scale sediment yield, sedi ment generated from plots in the watershed and sediment leaving the watershed must be sensitive to land use and management practices implemented on every plot of land within the watershed,
whether the land is located at the head or near the mouth of the watershed. Therefore, a feasibility analysis is also included herein to investigate this capability for SWAT.
Watershed Simulation SWAT, a model developed at the USDA’s Blacklands Research Center, is a continuous-time, spatially distributed simulator devel oped to assist water resource managers in predicting impacts of land management practices on water, sediment, and agricultural chemical yields (Neitsch et al. 2001; Arnold et al. 1998; ASCE 1999). SWAT utilizes watershed information such as weather, soil, topography, vegetation, and land management practices to simulate watershed processes that include surface and subsurface flow; erosion and sedimentation of overland as well as channel flows; crop growth for user specified agricultural management practices, and nutrient cycling for various species of nitrogen and phosphorus. The model operates on daily or subdaily time scale. Spatially, the model subdivides a watershed into subwatersheds, or subbasins, based on topographic information of the watershed. The subwatersheds could be further classified into spatial model ing units known as HRUs depending on heterogeneity of the land uses and soil types within the subbasins. At the scale of a HRU, watershed variables such as soil types and properties, land use and related management features, weather, and topographic pa rameters are considered homogeneous. SWAT simulates major hydrologic components and their inter actions as simply and yet realistically as possible (Arnold and Allen 1996). In this study, the Soil Conservation Service (SCS) curve number technique was used for generation of daily runoff volume. Peak runoff rate, the maximum runoff flow rate that oc curs with a given rainfall, is an indicator of the erosive power of a storm and is a vital factor for proper prediction of sediment loss. SWAT calculates the peak runoff rate with the modified ratio nal formula (Williams 1975), expressed as Qpk =
atcQi(DA) 3.6Tc
(1)
where Qpk=peak flow (m3 / s); atc=fraction of daily rainfall that occurs during the time of concentration (Tc) in the subbasin; Qi=surface runoff (mm); DA=drainage area of the subbasin (km2); and 3.6=unit conversion factor. Sediment yield from each subbasin is generated using the modified universal soil loss equa tion (MUSLE), which applies runoff as an erosive factor and is given as y = 11.8 qiQpk(DA)
0.56
KCP(LS)CF
(2)
where y=sediment yield from the subbasin (t); qi=surface runoff volume (mm/ha); Qpk=peak flow rate for the subbasin (m3 / s) from Eq. (1); K=USLE soil erodibility factor, which accounts for erodibility of the soil; C=USLE crop management factor, which accounts for crop type, tillage methods, crop residue treatments, and other agricultural practices; P=USLE support practice factor, which accounts for support practices such as strip cropping, contour farming, and terracing that may reduce soil transporting capacity of the runoff; LS=USLE slope length and steepness factor which accounts for the effect of the subbasin’s slope steep ness and slope length on soil erodibility and soil transport; and CF=course fragment factor which accounts for effect of course fragments such as rocks in the subbasin.
evapotranspiration from January 1990 to August 2001 were ob tained from the midwest climate center (MCC) for nearby climate stations. In order to derive a monthly maximum 30-min rainfall for all months, an input needed to compute a parameter used by SWAT to determine peak runoff rate, a 15-min precipita tion data for the period including January 1971 to April 2002 was also obtained from the MCC for a station located at nearby Murphysboro, Ill. Finally, daily streamflow and daily sediment concentration data were obtained from the Illinois State Water Survey for Perks Road Station (PRS), a gauging station that drains approximately 65% of the watershed, and for Church Road Station (CRS), a station that drains about 18% of the water shed. Daily streamflow and daily sediment concentration data ob tained spans from June 25, 1999 to August 26, 2001 for PRS and April 20, 2000 to August 26, 2001 for CRS. The sediment con centration record was intermittent, and over the spans, a total of only 682 and 413 daily records for PRS and CRS, respectively, were available.
Methodology Fig. 1. Location map of the Big Creek Watershed
One of SWAT’s major strengths in estimating overland erosion and sediment yield is that it updates the MUSLE C factor daily using information from its crop growth model, hence accounting for variation in ground cover during its growth cycle and its effect on erosion. Sediment transport in stream networks is a result of deposition and degradation processes operating simultaneously in the channel. SWAT models these two processes as a function of the peak channel velocity, derived from channel geometry and the peak runoff rate for the subbasin.
The Demonstration Watershed Big Creek Watershed, shown in Fig. 1, is used for demonstration of the spatial sensitivity and feasibility analyses conducted in this study. Located in southern Illinois, this 133 km2 watershed not only contributes significant amounts of flow to the Lower Cache River, but also carries a higher sediment load than other tributar ies located in the area (Demissie et al. 2001). Because of its high sediment yield and influence on the Lower Cache, multiple agencies and organizations have identified the Big Creek Water shed as a priority area for improved watershed management. It is currently undergoing extensive study as part of the Illinois Pilot Watershed Program, through cooperation among the Illinois De partment of Natural Resources (IDNR), the Illinois Department of Agriculture, Illinois Environmental Protection Agency (IEPA), and the Natural Resources Conservation Service IDNR (1998). Application of SWAT to a watershed requires topographic, soil, land use, and climate data for the basin. In addition, mea sured streamflow and sediment concentration data are required to test the accuracy of streamflow and sediment concentration esti mates, and if necessary, to calibrate the model. For the Big Creek Watershed, data included a 10-m resolution digital elevation model (DEM), a 30-m pixel land use maps for the years 1999 and 2000, and a Soil Survey Geographic (SSURGO) soil map. Daily historical data related to precipitation, maximum and minimum temperatures, wind speed, humidity, solar radiation, and potential
The methodology used for the spatial sensitivity analysis consists of forming a series of watershed discritizations from the DEM, each with a different number of subwatersheds, overlaying the land use and soil maps onto the subdivided watershed to further divide the subwatersheds into HRUs, and executing SWAT for each of the watershed delineations. This implies that model inputs and properties that are derived from topography, soils data, and land use could vary from one level of discritization to another, and hence could result in different simulation results. The critical source area (CSA), also known threshold area and defined as the minimum upstream drainage area that is required to initiate a source channel or a stream, is the input parameter used to control the number and size of the subbasins. Once the watershed is di vided into subbasins using various CSA levels, two scenarios were applied to subdivide the subbasins into HRUs. The first scenario assumes that the entire subbasin is covered by the domi nant soil and the dominant land use available in the subbasin, implying that the number of subbasins would be the same as the number of HRUs. In the second scenario, each subbasin is first divided into the number of land uses that cover at least 20% of the subbasin. Then, each of the subdivisions obtained based on the land use coverage are further divided into the number of soil types that cover at least 20% of the subdivision. These final sub divisions are known as HRUs. In other words, threshold value of 20% is used for both land use and soil type to subdivide a subbasin into HRUs. At a level of HRUs, watershed variables such as soil types and properties, land use and related management fea tures, weather, and topographic parameters are considered homogeneous. It should be emphasized that this spatial sensitivity analysis is conducted as a function of properties related to topography, land use, and soil only. The climate data used in the analysis are point estimates (i.e., data observed from a single gauging station), thus assuming uniformity of climate information throughout the water shed. This assumption overlooks the well acknowledged spatial variability of precipitation (Klemes 1983; Barrett 2001). If avail able, using climate data from multiple gauging stations located within the watershed or using data observed by remote sensing technology such as radar could resolve this limitation. Six different levels of discritization were used to investigate spatial sensitivity. Table 1 provides the basic characteristics of
Table 1. Basic Properties of the Watershed Delineations
Case
CSA (ha)
Number of subbasins
Number of HRUs
Average area of HRUs (ha)
1 2 3 4 5 6
50 50 100 100 500 500
118 118 75 75 9 9
352 118 217 75 22 9
35 104 57 164 557 1,363
each discritization. The finest delineation was performed using a threshold area of 50 ha, which is the minimum tolerated by the model when dividing subbasins into HRUs based on the 20% threshold used in this study for land use and soil, and the maximum threshold area investigated was 500 ha. Using data generated for each of these watershed delineations, the model was executed and the required model outputs and parameters were extracted with the help of additional computer code written and incorporated into SWAT. The watershed responses considered in the spatial sensitivity analysis were flow and sediment generated and exiting the watershed. Using the climate, terrain, soils, and land use data described previously, the model was executed for a simulation period of about four years (i.e., January 1, 1998 to August 26, 2001). First, daily streamflows estimated by the model at the stations where measured data is available (i.e., PRS and CRS) were extracted and compared with observed data to test accuracy of the model estimates. Accuracy of the streamflow and sediment concentra tions simulated by the noncalibrated SWAT model was found to be very poor, calling for a careful model calibration exercise. As a result, SWAT was calibrated using an automatic calibration module that uses genetic algorithms optimization (Muleta and Nicklow 2005; Muleta 2003) to improve accuracy of SWAT’s daily streamflow and daily sediment concentration predictions. Once the model was calibrated, annual average values of streamflow components, including surface runoff, lateral flow, and ground water, that are generated from all subbasins of the water shed were evaluated. Annual average streamflow leaving the watershed and the amount that is lost within the channels in the forms of evaporation and/or seepage were also determined. Like wise, annual average sediment generated from all the subbasins in the watershed, mean annual sediment that is deposited/eroded within the reaches of the watershed, mean annual sediment that left the watershed, and daily sediment concentration at PRS and CRS were extracted for each of the six watershed delineations. The accuracy of daily sediment concentration and daily streamflow amounts estimated at PRS and CRS was evaluated using mean annual values and a model efficiency criteria first described by Nash and Sutcliffe (1970) F0 − F F0
(3)
(di − ¯y )2 2 i=1
(4)
Ef = where N
F0 =
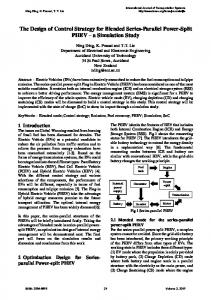
Fig. 2. Subbasins used (Subbasins 1 and 29) for the feasibility analysis
N
F=
(di − y i)2 2 i=1
(5)
where N=total number of data sets; di=observed output for the ith day; y i=actual output as estimated by the model for the ith day; and ¯y =mean value of the measured output. A value of E f could vary from negative infinity to unity, which corresponds to the ideal condition when measured and estimated values per fectly match. It should be noted that the model outputs used to investigate model accuracy, E f values, and mean annual estimates are evaluated based on the days for which measured data of the corresponding estimate (i.e., streamflow or sediment concentra tion) at the corresponding gauging station (i.e., PRS or CRS) is available. This implies that the simulation period spanning from January 1, 1998 to June 25, 1999, a total of about 18 months, was used as a “warm-up” period to diffuse the effect of initial condi tions, such as antecedent soil moisture, on model estimation and accuracy. The feasibility analysis was conducted using a delineation level judged “best” based on accuracy of its simulation results. Land use type and tillage methods were varied for two remote subbasins, Subbasins 1 and 48 in Fig. 2. Both Subbasins 1 and 48 have only one HRU, implying that the entire subbasin is covered by a single land use type and soil type. Subbasin 1 feeds CRS, PRS, and the watershed outlet, while the other subbasin feeds only Little Creek Station (LCS) and the outlet. Consideration of distant subbasins was intentionally performed in order to allow for a fair generalization of the analysis result to the entire water shed; if the model is found to be sensitive to these remote subbasins, the result could be safely generalized to all subbasins in the watershed. Under each condition, the model was executed, and sediment generated from the watershed and sediment leaving the PRS, CRS, LCS, and watershed outlet were extracted and compared.
Table 2. Streamflow Prediction Accuracy of the Watershed Delineations Considered PRS
CRS
Noncalibrated Number of HRUs 352 217 118 75 22 9
Calibrated
Noncalibrated
Calibrated
Observed (mm/year)
Ef
Simulated (mm/year)
Ef
Simulated (mm/year)
Observed (mm/year)
Ef
Simulated (mm/year)
Ef
Simulated (mm/year)
199.3 199.3 199.3 199.3 199.3 199.3
0.21 0.19 0.21 0.22 0.09 0.09
191.1 176.9 208.6 197.4 233.2 233.2
0.71 0.68 0.67 0.65 0.69 0.57
119.5 115.0 95.8 90.0 170.4 81.4
160.8 160.8 160.8 160.8 160.8 160.8
−0.20 −0.52 −0.06 −0.29 −0.80 −0.80
172.2 201.4 94.5 108.9 240.8 240.8
0.27 0.13 0.23 0.12 −1.20 0.30
107.6 129.2 65.1 76.1 202.9 52.5
Results and Discussion Analysis results for streamflow are summarized in Tables 2 and 3. Table 2 presents relative accuracy of streamflow, as simulated by the various levels of discritization at PRS and CRS stations, in terms of E f and mean annual yield. Table 2 provides results ob tained using both noncalibrated SWAT and calibrated SWAT. Based on the results in Table 2, one can appreciate the improvement achieved by the calibration exercise for streamflow. For details of the calibration methodology, the reader may refer to Muleta and Nicklow (2005). Surface runoff, lateral flow, ground water, surface runoff lost in the form of transmission loss and evaporation in tributary channels, and streamflow that left the watershed are listed in Table 3. These streamflow components are predicted using the calibrated model. Unlike E f and the mean annual yields given in Table 2, values in Table 3 are evaluated over the entire simulation period (i.e., January 1, 1998 to April 26, 2002). For the Big Creek Watershed, the model highly under estimated streamflow and indicated that there is no appreciable difference in the estimate across the levels of discritization. Val ues of E f are fairly uniform for all watershed delineations at both PRS and CRS. Generally speaking, streamflow generated and that which left the watershed decreased as spatial scale became coarser. The variation in mean annual streamflow generated between the finest and the coarsest watershed delineations is about 25% excluding the anomaly perceived for the discritization that resulted in 22 HRUs. Sensitivity within the components of streamflow also seems insignificant. Across the spatial scales analyzed, again excluding the case that resulted in 22 HRUs, the maximum variations observed were about 27% for surface runoff, 30% for lateral flow, and 11% for ground water flow. All streamflow, surface runoff, lateral flow, and ground water decrease with decrease in number of HRUs (i.e., as the scale becomes coarser). With regard to streamflow, results of this analysis agree with previous works that studied spatial scale sen sitivity of SWAT (Bingner et al. 1997; FitzHugh and Mackay 2000), which concluded that streamflow is relatively insensitive to spatial scale. Results of the spatial sensitivity analysis conducted for sedi ment are summarized in Tables 4 and 5. Relative accuracy of sediment simulated at PRS and CRS are described in terms of E f and mean annual loads in Table 4 for both noncalibrated and calibrated model. Time series plot of observed and calibrated daily sediment concentration obtained at PRS for the finest delin eation considered in this study is provided in Fig. 3. Only the dates for which observed data are available were involved in cal culation of E f and the observed mean annual loads. Though not as
impressive as streamflow, the calibration effort has significantly improved accuracy of the model’s sediment concentration predic tions, especially at PRS. One thing to note is that the average annual sediment yields are given in mass units whereas the time series plot shown in Fig. 3 is given in concentration units. The E f values are also computed using sediment concentration. To con vert sediment concentration into sediment load (mass units) to determine average annual sediment yield for observed and simu lated values, we had to use observed flow and simulated flow, respectively. Therefore, mean annual sediment yield results reflect simulation uncertainties exhibited by both sediment concentration predictions and streamflow predictions, whereas Fig. 3 and the E f values reveal only the simulation accuracy exhibited by the sediment concentration prediction. Table 5 shows mean annual sediment generated over the entire simulation period from all subbasins and that reached main channels of the watershed; the per centage of sediment load resulting from activities in the reaches (i.e., deposition/degradation); and mean annual sediment load that exited the watershed. From the perspective of model accuracy, discritizations with CSA of 50 and 100 ha seem to work better than the coarser delineations for both streamflow and sediment concentration. Like streamflow, the model highly underestimated sediment yield. Moreover, the results clearly show sensitivity to spatial scale with regard to the amount of sediment generated, the amount of sediment leaving the watershed, and mean sediment loads at PRS and CRS. Sediment generated from the watershed, as well as that which exited the watershed significantly decreased as the spatial scale became coarser except for the perceived anomaly for the scale that resulted in 22 HRUs. Between the finest and the coarsest delineations, for example, sediment generated and sediment exit ing the watershed dropped by about 66 and 87 percent, respec-
Table 3. Components of Streamflow Predicted by the Model Using Various Delineations Flow generated, lost, and exiting the watershed (mm/year) Number of HRUs 352 217 118 75 22 9
Surface
Lateral
Ground
Loss
Exiting
136.3 132.0 122.5 120.7 173.1 98.7
2.0 1.9 1.9 1.8 1.8 1.4
38.0 37.3 36.3 34.0 34.8 33.7
0.6 0.7 1.1 1.3 2.0 2.9
175.7 170.5 159.6 155.2 207.7 130.9
Table 4. Sediment Yield Prediction Accuracy of the Watershed Delineations Considered PRS
CRS
Noncalibrated Number of HRUs 352 217 118 75 22 9
Calibrated
Noncalibrated
Calibrated
Observed (mtons/year)
Ef
Simulated (mtons/year)
Ef
Simulated (mtons/year)
Observed (mtons/year)
Ef
Simulated (mtons/year)
Ef
Simulated (mtons/year)
7,249.6 7,249.6 7,249.6 7,249.6 7,249.6 7,249.6
−52.80 −38.80 −19.80 −10.80 −8.37 −8.37
40,192.6 31,360.9 23,731.6 17,193.9 19,945.1 19,945.1
0.46 0.45 0.41 0.41 0.23 0.06
3,803.5 3,386.0 2,677.7 2,156.7 1,911.6 436.0
969.43 969.43 969.43 969.43 969.43 969.43
−53.4 −39.9 −14.1 −10.2 −952.3 −952.3
14,689.9 14,596.2 4,277.0 5,282.3 58,388.0 58,388.0
−1.08 −0.80 −0.21 −0.30 −4.50 −203.90
2,686.3 2,672.8 1,086.8 1,490.8 4,846.1 687.5
tively. Sediment loads that left the intermediate stations (i.e., PRS and CRS) generally have a similar tendency. These results agree with those of FitzHugh and Mackay (2000) only in the sense that sediment generated from the watershed significantly reduces as spatial scale increases. Unlike the findings of FitzHugh and Mackay (2000), however, results of this analysis clearly show that sediment that leaves the watershed also significantly changed (i.e., reduced) as spatial scale became coarser. More than 75% of the generated sediment is deposited within the reaches of the watershed (see Table 5) indicating the significance of channel activity in predicting sediment yield for the Big Creek Watershed. The percentage of generated sediment that is deposited in the reaches has the tendency to increase as the spatial scale became coarser. The results also confirm that the model, as expected, respects mass balance with respect to flow (see Table 3) as well as sediment yield (see Table 5). Fig. 4 summarizes the spatial sensi tivity analysis for streamflow, sediment generated, and sediment exiting the watershed. Further investigation was carried out in an attempt to better understand the processes or parameters that are responsible for the sensitivity of sediment generated, sediment deposited/eroded in the channels, and sediment leaving the watershed. Such an analysis should start by revisiting the methods used in the model to estimate sediment yield and to route sediment in reaches. As described previously, SWAT uses the MUSLE to determine the sediment (y) that enters a channel from a subbasin. Among the variables used in MUSLE, the surface runoff volume per unit subbasin area (q), peak flow rate for the subbasin (Qpk), drainage area (DA), USLE soil erodibility factor (K), USLE crop manage ment factor (C), and USLE slope length and steepness factor (LS) are the variables that could vary from one spatial scale of aggre gation to another as a function of one or more of the topographic, soil, and land use factors. The P factor was assigned a value of unity throughout this analysis and the remainder of this research.
Surface runoff volume is modeled using the SCS curve number technique, which depends on the CN parameter. In SWAT, the rate of peak flow is related to surface runoff volume, drainage area, and time of concentration, which is the sum of overland flow and channel flow times. Overland flow time of concentration depends mainly on the ratio of subbasin slope length to subbasin slope steepness; whereas the channel flow time of concentration is a function of ratio of slope length to slope steepness of the tributary channel. Assuming a linear relationship between surface runoff and the CN parameter and from knowl edge of Eq. (1), the peak runoff rate could be described as Qpk r
CN(DA) Tc
(6)
From Eq. (2), ignoring the terms that are insensitive to spatial scale, sediment per unit subbasin area that is generated from all subbasins in the watershed over the simulation period (Y) could be described as Yr
1
N
2
Asub,av i=1
[
wi CN1.12 i Ki
( 2 )( T
Ct,i
t=1
DAi1.12 X LSi T.0.56 c,i
)l
(7)
where Asub,av=average area of the subbasin in the watershed for the level of delineation being studied; wi=weighted average area of a subbasin (i.e., ratio of the subbasin area to area of the water shed); N=total number of subbasins in the
Table 5. Sediment Generated, Deposited, and Exiting the Watershed Annual average sediment load (mtons/ha) Number of HRUs 352 217 118 75 22 9
Arriving at channels
Deposited in channels
Exiting watershed
(%) deposited
22.4 20.2 15.9 15.1 225.8 7.7
17.0 15.2 12.1 11.8 206.7 7.0
5.4 5.0 3.8 3.3 19.1 0.7
75.9 75.2 76.2 78.1 91.6 90.8
Fig. 3. Time series plot of observed and simulated daily sediment at PRS for the finest delineation
Table 7. Weighted Average Values of Land Use and Soil Parameters and Indices Number of HRUs 352 217 118 75 22 9
Fig. 4. Spatial sensitivity of streamflow and sediment yield N
Yr
2 i=1
(
T
wi CN1.12 i Ki
Ci,t 2 t=1
)
(8)
watershed; and T=total number of days simulated. As SWAT up dates the C factor daily, average daily value of the factor for a subbasin is evaluated over the simulation period. The right-hand side of Eq. (7) could be decomposed into two categories: (1) variables that depend on topographic factors (e.g., DA, Tc, and LS); and (2) variables that depend on land use and soil factors (e.g., CN, K, and C). Therefore, Eq. (7) could be further simpli fied as Yr
1
N
2
Asub,av i=1
wi
(
DA1.12 i LSi T0.56 c,i
)
(9)
For simplicity, the terms on the right-hand sides of Eqs. (7)–(9) are referred to hereafter as “topo-soil-land use index” (TSLI), “soil-land use index” (SLI), and “topographic index” (TPI), respectively. These three terms, TSLI, SLI, and TPI, are investigated with regard to their role in sediment generation be havior for the six watershed delineations. Weighted average val ues for subbasin slope steepness, slope length, USLE LS factor, average time of concentration for the subbasins, as well as TPI and TSLI values, are given in Table 6. Table 7 presents weighted average values of the USLE’s Kand C factors, CN parameter, and values of SLI for the delineation cases. The relationship between the three indices (TSLI, TPI, SLI) and annual sediment generated per unit area of the watershed (Y) is graphically presented in Fig. 5. Observation of Tables 6 and 7 and Fig. 5 clearly reveals the direct relationship that exists between the indices and Y.
K factor
C factor
Curve number
SLI
0.387 0.388 0.389 0.389 0.422 0.380
0.010 0.009 0.007 0.007 0.006 0.004
70.73 70.58 69.90 69.92 75.74 67.94
0.48 0.44 0.35 0.34 0.35 0.14
Excluding the discritization level that resulted in 22 HRUs, be tween the finest and the coarsest delineations, SLI, TPI, TSLI, and Y reduced by about 71, 55, 76, and 87%, respectively. These results indicate that SWAT parameters that are derived from topo graphic, soil, and land use information significantly vary with the number of HRUs and play a significant role in sediment genera tion. In addition, it is not an overgeneralization to conclude that the derived indices are valuable indicators of SWAT’s sedi ment generation behavior in response to the scale of aggregation. These indices could be evaluated with minimal effort, without requiring additional code writing and a detailed knowledge of the model. The TPI index can be evaluated using the Arcview (ESRI, Redlands, California) interface of the model, without even requir ing model execution. Further analysis was also performed to determine model pa rameters that are sensitive to the discritization level and that could be responsible for model behavior with respect to sedimentation processes within channel reaches, which is a result of deposition and degradation processes occurring in the channel. SWAT uses a modified form of the method by Bagnold (1977) to determine sediment-transport capacity of the streamflow (q sed) within chan nels. The model compares qsed with sediment concentration in the reach at the beginning of the time step and accordingly deter mines the amount of deposition (occurs if sediment concentration exceeds qsed) or degradation (occurs if qsed exceeds sediment con centration). Therefore, deposition and degradation of sediment in channels depends not only on geometry of the channels but also on the upland erosion. The parameters that may describe sensitiv ity of upland erosion to spatial scale have been derived earlier. Here, we will focus only on channel geometry
Table 6. Weighted Average Values of Topographic Parameters and Indices Number of HRUs 352 217 118 75 22 9
Steepness (m/m)
Length (m)
LS factor
Tc (h)
TPI
TSLI
0.0902 0.0903 0.0902 0.0903 0.0905 0.0905
52.9 53.4 52.9 52.9 58.9 58.9
1.59 1.60 1.59 1.60 1.76 1.76
0.40 0.40 0.68 0.76 0.51 1.54
8.76 8.66 5.93 5.47 8.42 3.94
2.65 2.41 1.38 1.21 2.84 0.64
Fig. 5. Relationship between sediment generation, and topographic and land use indices
Table 8. Sensitivity of Channel Properties to Spatial Scale Watershed average
Outlet channel
Number of HRUs
Length (km)
Slope
CHI
% deposited
Length
Slope
CHI
% deposited
352 217 118 75 22 9
1.6288 1.9744 1.6288 1.9744 6.3739 6.3739
0.0075 0.0067 0.0075 0.0067 0.0031 0.0031
0.126 0.066 0.126 0.066 0.003 0.003
75.9 75.2 76.2 78.1 91.6 90.8
1.4290 1.4290 1.4290 1.4290 1.4290 1.4290
0.003 0.003 0.003 0.003 0.003 0.003
0.009 0.009 0.009 0.009 0.009 0.009
0.81 0.93 1.98 2.27 0.86 9.07
(10)
qsed = f 1Vcf2,pk
where qsed=maximum sediment concentration (kg/L) that can be transported by the water; and f 1 and f 2=coefficients. Peak daily channel velocity, Vc,pk, which is evaluated as a function of the channel’s peak discharge, Qc,pk, and flow area, is an influential variable in determination of qsed. An average flow velocity of a reach, Vc,av, which is used to estimate Qc,pk, is evaluated using Manning’s equation: Vc,av =
1/2 AchR2/3 ch (slpch ) Achn
(11)
where Ach=flow area of the channel; Rch=hydraulic radius; de fined as the ratio of effective flow area to wetted perimeter (Pch) of the channel; slpch=slope steepness of the channel; and n=Manning’s roughness coefficient for the reach. SWAT esti mates flow area from flow volume (Volch) in the reach and length of the channel (Lch). Assuming that the dependence of Manning’s roughness coefficient is negligible, Eq. (11) could be reduced to the form Vc,av r
[( ) Volch LchPch
2/3
slp1/2
l
(12)
Wetted perimeter could vary from day to day and from one ap plication scale to another, mainly as a result of flow volume. However, as described previously, streamflow is found to be rela tively insensitive to scale of aggregation. Therefore, effects of both flow volume and flow perimeter are neglected in this analy sis. From Eqs. (10) and (11), and assuming the default value of 1.5 for f 2 in Eq. (10), sediment transporting capacity of reaches, averaged over the entire reaches of the watershed, Qsed, could be described as
fore, that slope steepness and length of reaches play a significant role in channel sedimentation behavior as modeled by SWAT. Furthermore, the CHI, like the TPI, can be evaluated using the Arcview interface of SWAT without full model execution, hence requiring little effort and minimal knowledge about model details. To summarize, for the Big Creek Watershed, sediment gener ated significantly reduced with a decrease in number of HRUs due to sensitivity of model parameters that are derived from to pographic, soil and land use information. Contrary to the finding by FitzHugh and Mackay (2000), this analysis demonstrates that sediment leaving the watershed also significantly decreases with an increase in spatial scale (i.e., decrease in number of HRUs). In addition, this study’s finding regarding the relationship between channel properties and sediment yield conflicts with that of FitzHugh and Mackay (2000) who concluded, “outlet sediment is relatively stable because the parameters of the outlet channel are identical for all watershed delineations.” One can see from Table 8 that parameters of the outlet channel, including CHI, are equal for all the watershed delineations. However, sediment yield varied significantly among the delineations. For example, there is approximately 87% reduction in sediment yield among the finest and the coarsest discritization levels (see Table 5) even though CHI, slope steepness, and channel length remained constant (see Table 8). This study indicates that, at least for the demonstration watershed, channel properties alone are related to the percentage of the incoming sediment that is deposited, but not to the actual amount of deposition. In addition to channel properties, the actual deposition, and therefore sediment yield of
N
Qsed r
slp3/4 1 ch,i N i=1 Lch,i
2
(13)
where N=number of reaches(s) in the watershed. The term on the right-hand side of Eq. (13), termed hereafter the “channel index” (CHI), is investigated for its relationship to the percentage of incoming sediment that is deposited/degraded within reaches of the watershed. Results of this analysis are summarized in Table 8 and Fig. 6. The watershed-average CHI values that are derived by aggregat ing properties of all reaches in the watershed, as well as CHI values derived by considering only the outlet reach are given in Table 8. Fig. 6 is a histogram of the watershed averaged result. The plot indicates the existence of inverse correlation between the percentage of incoming sediment that is deposited and the CHI, reinforcing the expectation that the CHI could be a good indicator of sedimentation behavior in reaches. It can also be said, there
Fig. 6. Relationship between channel index and sediment deposition
Table 9. Sensitivity of Sediment Yield to Human Activity Sediment generated and leaving (mtons/year/ha) Case
Land use/tillage
Original Pasture/no till Sub. 1 Corn/no till Sub. 1 Corn/conven. till Sub. 1 and 48 Corn/no till Sub. 1 and 48 Corn/conven. till
Generated Outlet PRS CRS LCS 20.2 21.9 22.3 23.6 24.1
5.0 5.1 5.1 5.2 5.2
4.5 4.7 4.7 4.7 4.7
5.1 5.8 5.8 5.8 5.8
8.1 8.1 8.1 8.4 8.4
a watershed, is strongly influenced by the amount of sediment generated from the watershed and that which enters the reaches. From the perspective of selecting a discritization level to be used for modeling the Big Creek Watershed, accuracy and com putational efficiency are the primary criteria for evaluation. Tables 2 and 4 indicate that the delineations obtained using CSA of 50 and 100 ha resulted in fairly similar accuracy for both streamflow and sediment yield that is better than the remaining delineations. As a result, the watershed delineation to be used for the remainder of this study will be performed with CSA of 100 ha and will have 20% threshold for land use and soil to subdivide a subbasin into HRUs. Results of the feasibility analysis are given in Table 9, which shows sensitivity of the model’s sediment predictions at the outlet of the watershed, as well as at intermediate locations, to land use change in the most remote subbasin. The sensitivity is more ap parent for outlets located closer to the subbasin where the changes were considered than for the watershed outlet. However, sensitiv ity to tillage type seems to be obscured by the effect of channel processes, particularly deposition. As described earlier, Table 5 indicates that at least 75% of the sediment generated in the wa tershed is deposited in the channels. Likewise, Table 9 shows that even though changing tillage type for both Subbasins 1 and 48 increased the generated sediment slightly, the difference was not big enough to affect the amount of sediment leaving the interme diate stations as well as the watershed outlet. Overall, the feasi bility analysis results demonstrate the suitability of SWAT for use in future decision support models that support comprehensive wa tershed management, at least for the Big Creek Watershed.
Conclusions This paper presented results of a detailed sensitivity and feasibil ity analysis performed for the SWAT model using the Big Creek Watershed. The major findings of the analysis include: • The calibration effort attempted in this study has signifi cantly improved accuracy of SWAT’s streamflow and sedi ment concentration predictions, which was very poor for all delineations. • Streamflow and its components (i.e., surface runoff, lateral flow, and ground water flow) are relatively insensitive to spa tial scale. • Sediment generated and sediment that leaves the watershed decreases with increasing spatial scale. More than 75% of gen erated sediment is deposited in channels and flood plains, and the percentage of deposited sediment increases with spatial scale. • Parameters derived from topographic, soil, and land use are equally responsible for the model’s sediment generation be havior, whereas channel properties (i.e., slope and length)
along with topographic, soil, and land use properties are responsible for sedimentation processes in the channel. • Four indices (TSLI, SLI, TPI, and CHI) were derived that allow investigation of SWAT’s sediment generation and deposition sensitivity to spatial scale with minimal efforts. The indices are valuable indicators of the model’s sedimentation behavior. • Unlike the finding by FitzHugh and Mackay (2000), properties of the outlet channel alone do not describe sediment yields for the Big Creek Watershed. Sediment yield significantly varies, even when channel properties remain practically the same, in dicating the importance of the incoming sediment in addition to channel properties. • The feasibility analysis demonstrates that SWAT’s estimate of sediment yield is sensitive to human activities conducted in subbasins of the watershed. Therefore, SWAT is capable of identifying environmentally friendly land use and management practices and is a suitable watershed simulation model for use as a component of integrative watershed management tools at least for the Big Creek Watershed.
Acknowledgments This material is based upon work supported by the Illinois Coun cil for Food and Agricultural Research and the National Science Foundation (Grant No. BCS-041087).
References American Society of Civil Engineers (ASCE). (1999). GIS modules and distributed models of the watershed, Reston, Va. Arnold, J. G., and Allen, P. M. (1996). “Estimating hydrologic budgets for three Illinois watersheds.” J. Hydrol., 176(1–4), 55–77. Arnold, J. G., Srinivasan, R., Muttah, R. S., and Williams, J. R. (1998). “Large area hydrologic modeling and assessment. Part I: Model de velopment.” J. Am. Water Resour. Assoc., 34(1), 73–89. Bagnold, R. A. (1977). “Bed load transport in natural rivers.” Water Resour. Res., 13(2), 303–312. Barrett, E. C. (2001). “Satellite remote sensing of precipitation: Progress and problems.” Remote sensing and hydrology 2000, M. Owe, K. Brubaker, J. Ritchie, and A. Rango, eds., International Association of Hydrological Sciences (IAHS), Wallingford, U.K., Publication No. 267. Bingner, R. L., Garbrecht, J., Arnold, J. G., and Srinivasan, R. (1997). “Effect of watershed subdivision on simulation runoff and fine sedi ment yield.” Trans. ASAE, 40(5), 1329–1335. Demissie, M., Knapp, V. H., Parmer, P., and Kriesant, D. J. (2001). “Hy drology of the Big Creek watershed and its influence on the Lower Cache River.” Contract Rep. No.2001-06, Illinois State Water Survey, Champaign, Ill. FitzHugh, T. W., and Mackay, D. S. (2000). “Impacts of input parameter spatial aggregation an agricultural non point source pollution model.” J. Hydrol., 236(1–2), 35–53. Illinois Department of Natural Resources (IDNR). (1998). The pilot watershed program: Watershed management, monitoring, and assess ment, Springfield, Ill. Klemes, V. (1983). “Conceptualization and scale in hydrology.” J. Hy drol., 65(1–3), 1–23. Mamillapalli, S., Srinivasan, R., Arnold, J. G., and Engel, B. A. (1996). “Effect of spatial variability on basin scale modeling.” Proc., 3rd Int. Conf./Workshop on Integrating GIS and Environmental Modeling, National Center for Geographic Information and Analysis, Santa Fe, N.M.
Muleta, M. K. (2003). “A decision support system for the management of non-point source pollution from watersheds.” Ph.D. thesis, College of Engineering, Southern Illinois Univ. Carbondale, Carbondale, Ill. Muleta, M. K., and Nicklow, J. W. (2005). “Sensitivity and uncertainty analysis coupled with automatic calibration for a distributed water shed model.” J. Hydrol., 306(1–4), 127–145. Nash, J. E., and Sutcliffe, J. V. (1970). “River flow forecasting through conceptual models. Part I—A discussion of principles.” J. Hydrol., 10(3), 282–290. Neitsch, S. L., Arnold, J. G., Kiniry, J. R., and Williams, J. R. (2001). Soil and water assessment tool theoretical documentation, version 2000, Grassland, Soil and Water Research Service, Temple, Tex.
Sposito, G., ed. (1998). Scale dependence and scale independence in hydrology, Cambridge University Press, Cambridge, U.K. Trimble, S. W. (1981). “Changes in sediment storage in the Coon Creek Basin, driftless areas, Wisconsin, 1853 to 1975.” Science, 214(4517), 181–183. Williams, J. R. (1975). “Sediment routing for agricultural watersheds.” Water Resour. Bull., 11(5), 965–974. Wood, E. F. (1998). “Scale analysis for land-surface hydrology,” Scale dependence and scale independence in hydrology, G. Sposito, ed., Cambridge University Press, Cambridge, U.K. Wood, E. F., Sivapalan, M., Beven, K., and Band, L. (1988). “Effects of spatial variability and scale with implication to hydrologic modeling.” J. Hydrol., 102, 29–47.