Received May 5, 2017, accepted May 12, 2017, date of publication May 19, 2017, date of current version June 28, 2017. Digital Object Identifier 10.1109/ACCESS.2017.2705644
Sensor Fault Classification Based on Support Vector Machine and Statistical Time-Domain Features SANA ULLAH JAN1 , (Student Member, IEEE), YOUNG-DOO LEE1 , JUNGPIL SHIN2 , (Member, IEEE), AND INSOO KOO1
1 Department 2 School
of Electrical/Electronic and Computer Engineering, University of Ulsan, Ulsan 44610, South Korea of Computer Science and Engineering, The University of Aizu, Aizuwakamatsu 965-8580, Japan
Corresponding author: Insoo Koo (
[email protected]) This work was supported by the Business for Cooperative R&D between Industry, Academy, and Research Institute through the Korea Small and Medium Business Administration in 2016 under Grant C0398156.
ABSTRACT This paper deals with the problem of fault detection and diagnosis in sensors considering erratic, drift, hard-over, spike, and stuck faults. The data set containing samples of the abovementioned fault signals was acquired as follows: normal data signals were obtained from a temperature-to-voltage converter by using an Arduino Uno microcontroller board and MATLAB. Then, faults were simulated in normal data to get 100 samples of each fault, in which one sample is composed of 1000 data elements. A support vector machine (SVM) was used for data classification in a one-versus-rest manner. The statistical time-domain features, extracted from a sample, were used as a single observation for training and testing SVM. The number of features varied from 5 to 10 to examine the effect on accuracy of SVM. Three different kernel functions used to train SVM include linear, polynomial, and radial-basis function kernels. The fault occurrence event in fault samples was chosen randomly in some cases to replicate a practical scenario in industrial systems. The results show that an increase in the number of features from 5 to 10 hardly increases the total accuracy of the classifier. However, using ten features gives the highest accuracy for fault classification in an SVM. An increase in the number of training samples from 40 to 60 caused an overfitting problem. The k-fold cross-validation technique was adopted to overcome this issue. The increase in number of data elements per sample to 2500 increases the efficiency of the classifier. However, an increase in the number of training samples to 400 reduces the capability of SVM to classify stuck fault. The receiver operating characteristics curve comparison shows the efficiency of SVM over a neural network. INDEX TERMS Sensor faults, fault detection, support vector machine, drift fault, erratic fault, hard-over fault, spike fault, stuck fault.
I. INTRODUCTION
Recently, modern industry relies on more automatic machinery to increase production as well as reduce labor costs. The automation of industrial systems leads to challenges in an important sector: fault detection and diagnosis. A fault can be expressed as an unusual property or behavior of a machine or system [1]. Early detection of a fault is paramount to preventing connected components of machines from damage. Faults can occur in an actuator or sensor, or it may be due to damage in a mechanical component. Therefore, faults are categorized as actuator faults, sensor faults, or plant faults, depending on the location. The majority of plant faults are 8682
caused by damage in rolling elements, also known as ball bearings, in mechanical systems [2], [3]. Algorithms for fault detection in rolling elements of machines have been explored in a vast number of studies reporting efficient results [2], [4]–[11]. However, sensors also fault frequently leading to serious consequences in terms of safety and plants operation. Therefore, sensor fault detection and classification is very important to ensure safety and reliability of systems. The types of sensor faults dealt with in present study include erratic faults, drift faults, hard-over faults, spike faults, and stuck faults. These faults can be defined as follows: Drift fault – the output of the sensor keeps increasing or decreasing linearly from normal state [12]–[15].
2169-3536 2017 IEEE. Translations and content mining are permitted for academic research only. Personal use is also permitted, but republication/redistribution requires IEEE permission. See http://www.ieee.org/publications_standards/publications/rights/index.html for more information.
VOLUME 5, 2017
S. U. Jan et al.: Sensor Fault Classification Based on SVM and Statistical Time-Domain Features
Hard-over fault – the output of the sensor increases above the maximum threshold. Erratic fault – variance of the sensor output significantly increases above the usual value [12]. Spike fault – spikes are observed in the output of the sensor at fixed intervals. Stuck fault – the sensor’s output gets stuck at a fixed value [12], [16], [17]. Stuck fault can also be expressed as complete failure [13]–[15].
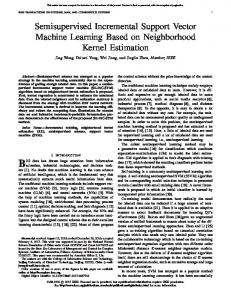
the inner-product kernels make it possible to solve the linearly non-separable cases in a high-dimensional space. Also, the distinctive characteristics of the hyperplane allow a high generalization ability in an SVM. Although, techniques can be applied to sensor fault detection similar to techniques used for rolling element fault detection, the signal characteristics of sensor faults are different from the signal characteristics of rolling elements. Hence, using similar features and techniques does not guarantee the same accuracy in results obtained for rolling element fault detection. A multi-class SVM-based classifier is used to examine the results for sensor fault classification. The five types of sensor faults include drift, hard-over, erratic, spike, and stuck faults. The data were the input given to the SVM in the form of statistical time-domain features, which were extracted from input signals. Figure 2 shows the flowchart for the steps in signal fault detection applied in present study.
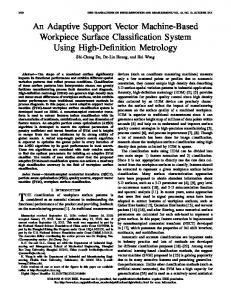
FIGURE 1. Plots of samples of normal and faulty signals.
An example of each fault appears in Figure 1. In addition, some different sensor fault types are identified in different works. For instance, Yu et al. [15] and Dunia et al. [13], both considered precision degradation and bias sensor faults, in addition to drift and complete failure. Similarly, Kullaa [14] presented modelling of seven different sensor fault types: bias, gain, precision degradation, complete failure, noise, and constant output with noise. Yang et al. [12] investigated bias, impact, stuck, cyclic, drift and erratic sensor fault types. Each fault can be occurred depending on the sensor type, application and the reason of fault occurrence. The fault diagnosis approaches can be broadly put into four classes: model-based, signal-based, knowledge-based, and hybrid methods [15], [17]. The knowledge-based techniques [2], [4]–[11] are becoming more attractive in industrial systems due to less hardware redundancy, as compared to other techniques. Furthermore, supervisory control and data acquisition (SCADA) systems are commonly installed in industry, which allow for collection of historical data in large volumes. Recently, artificial intelligence techniques such as neural networks (NN) [4], [6]–[9], K-nearest neighbor (KNN) [2], [6], and the support vector machine (SVM) [6], [19]–[23] have become prominent topics in fault detection. Rauber et al. [6] presented a comparison of the results obtained using these three techniques for fault detection in rolling elements. The advantage of the SVM over other machine learning techniques is its ability to be analyzed theoretically with the help of learning theory concepts, and in addition, an SVM can achieve efficient performance when implemented in practical problems [24], [25]. Furthermore, VOLUME 5, 2017
FIGURE 2. Framework of the applied model for fault detection.
The rest of this paper is organized as follows: Section II presents a brief introduction to the SVM algorithm. In Section III, the data acquisition and feature extraction steps are discussed. Section IV presents the simulation results, and finally, concluding remarks are presented in Section V. II. SUPPORT VECTOR MACHINE
The Support Vector Machine (SVM) was developed from the concepts of statistical learning theory in late 1970s [20], [26]. The SVM primarily deals with two-class classification problems. A linear line or hyperplane is constructed as a decision boundary between the datasets of two classes for classification. The nearest data points to the hyperplane, which 8683
S. U. Jan et al.: Sensor Fault Classification Based on SVM and Statistical Time-Domain Features
impart construction of the hyperplane, are called support vectors. Hence, the algorithm is a support vector machine [27]. The optimized hyperplane can be mathematically expressed as [27] wT x + b = 0, (1)
TABLE 1. Inner-product kernels.
where w is the vector of weights, x is an input vector, and b represents the bias. The equations of the support vectors of each class are given as wT x + b = +1, T
w x + b = −1,
for di = +1, for di = −1,
(2)
where di corresponds to the respective class, i.e., di = +1 for class A, and di = −1 for class B. The optimization problem for training sample {(xi , di )}ki=1 to find the optimal hyperplane is given as min 8(w) =
1 T w w, 2
such that for i = 1, 2, . . . , k.
di (wT xi + b) ≥ 1,
The final decision function can be obtained as follows: ! N X T αo,i (x xi ) + b , f (x) = sign
(3)
(4)
i=1
where x denotes the input vector to be classified and N is the number of support vectors obtained in training phase. The non-negative parameters αo,i are used to define support vectors among input vectors. The linearly non-separable patterns are transformed into a higher dimension feature space, using a mapping function ϕ(x), allowing for classification of the data using the linear hyperplane. The decision function in Eq. (4) can be modified to ! N X f (x) = sign αo,i (ϕ(x)ϕ(xi )) + b . (5) i=1
The inner-product kernel function, defined as K (x, y) = ϕ(x)ϕ(y), is used to reduce the complexity of numerical optimization in high-dimensional space. The decision function can be updated as follows: ! N X f (x) = sign αo,i K (x, xi ) + b . (6) i=1
There are several kernel functions used in SVM for nonlinear pattern classification, such as linear, polynomial, sigmoid, the radial-basis function (RBF), etc. In this work, three kernel functions (linear, polynomial and RBF) are used. The mathematical expressions of these kernel functions are given in Table 1. For multi-class classification problems, the SVM can be used in a one-versus-rest manner [19], [28], [29]. In this approach, m distinct classifiers are formed for m-class classification. In each m-th classifier, the data related to the 8684
FIGURE 3. Experimental setup to obtain data from a TC1047/TC1047A temperature-to-voltage converter using the Arduino Uno board.
m-th class are trained as true values, while the rest of the m − 1 classes are false values. The label of the test dataset is determined by the classifier giving the maximum output value. III. DATA ACQUISITION AND FEATURES EXTRACTION
The data were acquired from the TC1047/TC1047A Precision Temperature-to-Voltage Converter, manufactured by Microchip Technology Inc., available in a 3-pin SOT-23B package. The data were obtained serially through Mathwork’s Matlab from a sensor using the Arduino Uno microcontroller board, shown in Figure 3. The output of sensor was connected to one of the Arduino Uno’s I/O pins. A serial communication link was established between the Arduino Uno and the work station or personal computer (PC). The ‘‘Matlab support package for Arduino hardware’’ supporting tool was used to connect the Arduino with Matlab. The baud rate was set to 9600bps with 8 data bits and 1 stop bit. This results in sampling rate of 1066.6 bps, however, this value is not achieved experimentally due to processing time delay of PC and Arduino Uno. Nevertheless, the sampling rate does not effect the accuracy results as knowledge-based fault diagnosis technique is adopted, which only requires historical data for training. The received data from Arduino Uno was stored in PC for further processing and simulation purposes. The model of the connections between the PC and the Arduino Uno microcontroller and between the Arduino Uno and the temperature sensor is given in Figure 4. At first, a total of 100,000 data elements were obtained at room temperature VOLUME 5, 2017
S. U. Jan et al.: Sensor Fault Classification Based on SVM and Statistical Time-Domain Features
FIGURE 4. Block diagram of the setup to obtain data.
(approximately 20∼22◦ C). A sample of 1000 data elements obtained from the temperature sensor, and then, the output transformed to the equivalent temperature in degrees Celsius is shown in Figure 5. Further, to increase the size and number training samples to 2500 and 500, respectively, 1,250,000 data elements were obtained in second phase using the same experimental setup.
tures that are able to confirm a fault’s existence and identify the fault type and location. Feature selection is an essential step in fault diagnosis [6]. Feature selection techniques have been explored in many studies [30]–[32]. Faulty signal features can be extracted from time-domain analysis, frequencydomain analysis, or time–frequency-domain analysis [2]. Time-domain features are the simplest features, which can easily be extracted, compared to features extracted from the frequency-domain and time–frequency-domain. Also, timedomain features have sufficient information of a fault. Since the work in this paper focuses on sensor fault detection using SVM, for simplicity, the time-domain features used by Rauber et al. [6] were chosen for training and testing SVM. The results show that using these features for selected faults classification is a justifiable choice. TABLE 2. Features used for training and testing the SVM obtained from each sample of N data points xi
FIGURE 5. (a) Temperature-to-voltage converter output data, and (b) corresponding temperature in Celsius.
The temperature-to-voltage converter output, VOUT , for temperature T is given by VOUT = 0.01 × T + 500mV.
(7)
The faults were then induced in the derived temperature data by simulation. First the data were divided into 100 samples, each sample consisting of 1000 data elements. Then, five different types of faults, i.e., drift, hard-over, erratic, spike, and stuck faults, were simulated in the data obtained. We got 100 samples for each of six classes, i.e, normal (no fault) data and the above-named faults. All the samples of each class consisted of 1000 data elements. The resultant dataset consisted of 6∗ 100∗ 1000 data elements for the six classes. Samples consisting of 1000 data elements for each of the six classes are shown in Figure 1. Out of 100 samples, 60 samples from each class were used for training, while the remaining 40 samples were used for testing the SVM. Furthermore, the signals obtained from the sensors were not sufficient for fault detection in the systems [2]. Therefore, the signals were preprocessed to extract signal feaVOLUME 5, 2017
Table 2 shows the definitions of the time-domain statistical feature set used. The ten time-domain statistical features are root mean square (RMS), square root of amplitude (SRA), kurtosis value (KV), skewness value (SV), peakto-peak value (PPV), crest factor (CF), impulse factor (IF), marginal factor (MF), shape factor (SF), and kurtosis factor (KF). The feature pool consists of 100 columns representing 100 samples, where each row consisting of these features is considered a single observation. IV. SIMULATION RESULTS
The SVM-based classifier was trained using svmtrain builtin function in Matlab which is based on one-versus-rest approach for each class. The cost parameter C was set to default (C=1). A sequential minimal optimization (SMO) solver was utilized to obtain the optimal decision boundary. The first 20, 40, and 60 samples of each class were used to train the SVM, separately. Each SVM model was tested by the last 40 samples of each class, which were not used for training. For each case, three different kernel functions were 8685
S. U. Jan et al.: Sensor Fault Classification Based on SVM and Statistical Time-Domain Features
TABLE 3. Accuracy of SVM used for Sensor Fault Detection (%).
FIGURE 6. Plots of one sample of each class where x = 0.
used for training, i.e., linear, polynomial, and the radial- basis function kernel. The order of polynomial kernel function, p = 3 is used whereas, the rbf kernel scaling factor, δ = 1 is used. The fault occurrence interval in a sample is denoted by x. The value of x was varied, in some cases, to represent a practical scenario for fault occurrence. The number of features obtained from the dataset for each class was also varied to observe the impact on the testing results in terms of accuracy. Figure 6 shows the plots of one sample of each of the six classes that were obtained using x = 0. That means that 8686
FIGURE 7. Performance of the SVM by extracting 10 features and using linear, polynomial, and radial-basis function kernels for 20, 40, and 60 training samples.
the fault occurred from the start of the observation. All the testing and training samples were obtained using x = 0 in this case. The samples that were obtained by simulating faults at x = 500 are plotted in Figure 1. The four samples of each class are shows in Figure 7 where the value of x was chosen randomly from 0 to 1000. The variation in the samples due to variation in the value of x can easily be seen in the figure. VOLUME 5, 2017
S. U. Jan et al.: Sensor Fault Classification Based on SVM and Statistical Time-Domain Features
The test results of SVM in terms of percent accuracy for sensor fault detection are given in Table 3. At first, the value of x was kept at zero. The first column represents the value of x for three different conditions, i.e., x = 0, x = 500, and x = 0 ∼ 1000 (randomly chosen between 0 and 1000). The results were obtained by using each kernel function (i.e., linear, polynomial, and RBF). For each case, the results were obtained using the 40 testing samples, while the training samples were varied from 20 to 60, represented by S in the table. Initially, combinations of 5 out of 10 features were selected manually to examine accuracy results for each case. Out of the total 252 cases, the combination including first 5 features (RMS, SRA, KV, SV, and PPV) gave highest accuracy results and, hence, were selected. Finally, all 10 features from the features pool were used to examine the effect on the accuracy of the SVM. The numbers 1, 2, . . . , 6 represent the data class, i.e., normal, erratic, drift, hard-over, spike and stuck faults, respectively. We can see that, when using x = 0, the results are similar for each class irrespective of kernel function and number of training samples. However, for classes 5 and 6 (spike and stuck faults), accuracy was much lower compared to other classes. This seem intuitive, if we see the samples of these classes in Figure 6, because the features used in this work are unable to provide the SVM with a space in which these classes can be separated easily. These results can be improved by using different features or adding more features to the features pool. Also, using different types of kernel function can provide increasingly accurate results. Increasing the value of x also increases the difficulty of classification for each class, as parts of the normal data are added to each class. This can be seen in Table 3 when x is equal to 500. For all the cases of using different kernel functions, and using different numbers of training samples (20, 40, and 60), the accuracy of class 1 is decreased, except for the polynomial kernel function with 40 training samples and using 5 or all the 10 features, which obtained 100% accuracy for class 1. Also, we can see that a further increase in the number of training samples degrades the performance of the SVM. This is the case that reflects the overfitting problem in the training of SVM. Lastly, the accuracy of SVM was obtained using a randomly selected value of x between 0 and 1000. This case is the most important of all, as it is the clone of a practical scenario. The best performance in this case was achieved when the polynomial kernel function was used for training the SVM with 40 training samples and 10 features. A further increase in training samples in this case also degrades performance because of the overfitting problem. Furthermore, the first five features are the ones that has a major contribution in the classification of faults. This statement can be verified by observing the total accuracy results given in Table 4. The total accuracy is defined as the ratio of correct classifications of all classes to the total number of test samples. It can be seen from table that the efficiency of the classifier improves just around 1 to 2% in most of the VOLUME 5, 2017
TABLE 4. Total Accuracy of SVM(%).
improved cases when the number of features is increased from 5 to 10. The highest improvement of 3.68% occurs in the case of linear kernel with 20 training samples for x = 500. Nevertheless, comparing the results obtained using both polynomial and RBF kernels, the accuracy is almost similar for all the cases, i.e., for x taken as 0, 500 or a random number between 0 and 1000. The most important scenario is the one with random value of x, as it can be considered as a practical scenario. In this case, the accuracy results of 87.05% and 87.15% are obtained by using 5 and 10 features, respectively, and 40 training samples with polynomial kernel. Further increase in number of training samples to 60 while using 10 features improves the results to 88.13%. Instead, using 5 features with 60 training samples degrades the performance due to overfitting problem. TABLE 5. Accuracy of SVM(%) with 4-fold CV, 1000 points/sample, 60 Training Samples.
Table 5 shows the results obtained by using 4-fold cross validation (CV) in training phase of SVM. The training data is divided into 4 training data subsets of each class patterns. Each subset is used once for testing and 3 times for training. This technique helps selecting the optimal parameters of SVM assisting to overcome the overfitting problem. The total number of training samples is 60. From Table 5, we can see the effectiveness of CV by comparing the accuracy results with that in Table 3. The accuracy of class 6 increases significantly with CV in the training phase. To obtain the accuracy results in Table 6, the number of data points per samples is increased from 1000 to 2500. The value of x was chosen randomly between 0 and 2500. It can be seen clearly that, increasing the size of sample increases the accuracy of classifier. It seems intuitive as faulty signal portion is increased in input sample as compared to sample of size 1000 data elements. The features, in this case, become more distinctive as compared to the former case and can be easily classified. Furthermore, the number of training samples is 8687
S. U. Jan et al.: Sensor Fault Classification Based on SVM and Statistical Time-Domain Features
TABLE 6. Accuracy of SVM(%) with 4-fold CV, 2500 points/sample, 60 Training Samples.
TABLE 7. Accuracy of SVM(%) with 4-fold CV, 2500 points/sample, 400 Training Samples.
FIGURE 9. ROC of SVM using 10 features, a random x between 0 and 1000, and 40 training samples.
increased to 400 with 2500 data elements per sample. The accuracy results in this case are illustrated in Table 7. The accuracy results in most of the classes increase up to 100%, however, the efficiency to classify class 6 signal decreases in this case. The CV was applied in all cases to obtain the results in Tables 5, 6, and 7. Nevertheless, the accuracy of some cases is degraded by using 400 training samples, such as, class 6. From this observation, it can be safely claimed that using 60 training samples with 4-fold CV is a reasonable choice.
samples from 20 to 40, is shown in Figure 9. The improvement can be seen in both cases of polynomial and RBF kernel functions. The performance of the SVM trained using linear kernel functions was degraded. In this case also, the SVM trained using the polynomial kernel function outperforms the SVM trained using other kernel functions.
FIGURE 10. ROC of SVM using 10 features, a random x between 0 and 1000, and 60 training samples. FIGURE 8. ROC of SVM using 10 features, a random x between 0 and 1000, and 20 training samples.
The receiver operating characteristics (ROC) graph gives the best information about the performance of a classifier [33]. In this work, the ROC graphs were obtained to examine the efficiency of SVM for each case used in this work. Figure 8 shows the ROC of the SVM for linear, polynomial, and RBF kernel functions. The SVM used in this case has the following characteristics: 10 features, 20 training samples, and x randomly selected between 0 and 1000. These properties were used for both training and testing samples. The data samples of the normal class were trained as positive values, while the other classes’ data samples were trained as false values. The best results were obtained by using the polynomial kernel function. A true positive rate of 1 was achieved earliest, with a false positive rate of almost 0.05. The ROC for the same characteristics in the SVM in Figure 8, but with a variation in the number of training 8688
Figure 10 illustrates the ROC performance of the SVM for linear, polynomial, and RBF kernels, using 10 features, 60 training samples, and values of x randomly chosen between 0 and 1000. This is the case where the overfitting problem occurs, and its effect on the performance of the SVM can be seen by a comparative analysis of Figure 9 and Figure 10. The point to be noted is that, in all cases, the SVM trained using the polynomial kernel function achieved the best performance in terms of true-positive rate versus falsepositive rate. To obtain the ROC performance of the SVM trained with the polynomial and RBF kernels, in each case, 5 and 10 features were selected, and the value of x was chosen randomly between 0 and 1000, with 40 training samples, as shown in Figure 11. To observe the difference clearly, the limits of the false-positive rate were selected from 0 to 0.1. The results in this figure strengthen the statement, concluded from Figures 8, 9, and 10, that the SVM trained with the VOLUME 5, 2017
S. U. Jan et al.: Sensor Fault Classification Based on SVM and Statistical Time-Domain Features
for classification of sensor faults considered in this study using the 10 selected time-domain features. V. CONCLUSION
FIGURE 11. ROC of SVM using 5 and 10 features, a random x between 0 and 1000, 40 training samples, and the polynomial and RBF kernels.
polynomial kernel function gives the best performance among all the SVM trained with linear, polynomial, and RBF kernels. Furthermore, the best results are obtained by using the 10 features with 40 training samples.
FIGURE 12. ROC of SVM with polynomial kernel and neural network using 10 features, a random x between 0 and 1000, 40 training samples.
A comparison of ROC curves using SVM with polynomial kernel function and neural network is given in Figure 12. The samples with randomly chosen value of x between 0 and 1000 were used. The output as normal class of classifier was considered as positive result, whereas, the remaining classes samples were treated as negative result. The neural network was implemented in Matlab consisting 4 layers; an input layer, an output layer and two hidden layers. The input layer was composed of 10 nodes each representing a single feature of input sample, the two hidden layers consisting of 5 and 2 neurons and the output layer with a single node giving the resultant score as output. The number of neurons in the hidden layers was chosen based on trial and error by varying from 2 to 10 in both layers. Also, the number of hidden layers was varied from 1 to 2 to choose the optimal case. The backpropagation with Levenberg-Marquardt algorithm was used for training neural network. The target mean-squared error of 1∗ 10−7 was obtained just after 8 iterations by training network one time only. All the initial weight and bias vectors were set to default. It can be seen clearly that SVM gives significantly efficient result as compared to neural network VOLUME 5, 2017
In this paper, the authors identify erratic, drift, hard-over, spike, and stuck faults in sensor faults classification problem. The SVM was used to classify data as normal or faulty, relating to the fault label. The increase in number of training data increase the efficiency of classifier to some point. Further increase may result in overfitting problem. The cross validation techniques is used to overcome this issue. Furthermore, increasing the size of input sample (data elements per sample) increases the accuracy of classifier. The ROC comparison of SVM with NN shows the efficiency of SVM for sensor fault classification. REFERENCES [1] Z. Gao, C. Cecati, and S. X. Ding, ‘‘A survey of fault diagnosis and fault-tolerant techniques—Part I: Fault diagnosis with model-based and signal-based approaches,’’ IEEE Trans. Ind. Electron., vol. 62, no. 6, pp. 3757–3767, Jun. 2015. [2] J. Tian, C. Morillo, M. H. Azarian, and M. Pecht, ‘‘Motor bearing fault detection using spectral kurtosis-based feature extraction coupled with Knearest neighbor distance analysis,’’ IEEE Trans. Ind. Electron., vol. 63, no. 3, pp. 1793–1803, Apr. 2016. [3] M. D. Prieto, G. Cirrincione, A. G. Espinosa, J. A. Ortega, and H. Henao, ‘‘Bearing fault detection by a novel condition-monitoring scheme based on statistical-time features and neural networks,’’ IEEE Trans. Ind. Electron., vol. 60, no. 8, pp. 3398–3407, Aug. 2013. [4] O. Castro, C. Sisamón, and J. Prada, ‘‘Bearing fault diagnosis based on neural network classification and wavelet transform,’’ in Proc. 6th WSEAS Int. Conf. Wavelet Anal. Multirate Syst., Bucharest, Romania, Oct. 2006, pp. 22–29. [5] T. Ince, S. Kiranyaz, L. Eren, M. Askar, and M. Gabbouj, ‘‘Real-time motor fault detection by 1-D convolutional neural networks,’’ IEEE Trans. Ind. Electron., vol. 63, no. 11, pp. 7067–7075, Nov. 2016. [6] T. W. Rauber, F. De A. Boldt, and F. M. Varejáo, ‘‘Heterogeneous feature models and feature selection applied to bearing fault diagnosis,’’ IEEE Trans. Ind. Electron., vol. 62, no. 1, pp. 637–646, Sep. 2015. [7] B. Samanta, ‘‘Artificial neural network based fault diagnostics of rolling element bearings using time-domain features,’’ Mech. Syst. Signal Process., vol. 17, pp. 317–328, Sep. 2003. [8] B. Samanta, ‘‘Gear fault detection using artificial neural networks and support vector machines with genetic algorithms,’’ Mech. Syst. Signal Process., vol. 18, no. 3, pp. 625–644, 2004. [9] B. Sreejith, A. K. Verma, and A. Srividya, ‘‘Fault diagnosis of rolling element bearing using time-domain features and neural networks,’’ in Proc. IEEE Region 10 3rd Int. Conf. Ind. Inf. Syst., vol. 1. Sep. 2008, pp. 1–6. [10] Y. Wang, J. Xiang, R. Markert, and M. Liang, ‘‘Spectral kurtosis for fault detection, diagnosis and prognostics of rotating machines: A review with applications,’’ Mech. Syst. Signal Process., vols. 66–67, pp. 679–698, Apr. 2016. [11] Q. Xiao, Z. Luo, and J. Wu, ‘‘Fault detection and diagnosis of bearing based on local wave time-frequency feature analysis,’’ in Proc. 11th Int. Conf. Natural Comput. (ICNC), 2015, pp. 808–812. [12] J. L. Yang, Y. S. Chen, L. L. Zhang, and Z. Sun, ‘‘Fault detection, isolation, and diagnosis of self-validating multifunctional sensors,’’ Rev. Sci. Instrum., vol. 87, no. 6, p. 065004, 2016. [13] R. Dunia, S. J. Qin, T. F. Edgar, and T. J. Mcavoy, ‘‘Identification of faulty sensors using principal component analysis,’’ Process Syst. Eng., vol. 42, no. 10, pp. 2797–2812, 1996. [14] J. Kullaa, ‘‘Detection, identification, and quantification of sensor fault in a sensor network,’’ Mech. Syst. Signal Process., vol. 40, no. 1, pp. 208–221, Sep. 2013. [15] Y. Yu, W. Li, D. Sheng, and J. Chen, ‘‘A novel sensor fault diagnosis method based on modified ensemble empirical mode decomposition and probabilistic neural network,’’ Measurement, vol. 68, pp. 328–336, May 2015. 8689
S. U. Jan et al.: Sensor Fault Classification Based on SVM and Statistical Time-Domain Features
[16] G. H. Yang and H. Wang, ‘‘Fault detection for linear uncertain systems with sensor faults,’’ IET Control Theory Appl., vol. 4, no. 6, pp. 923–935, 2010. [17] G. X. Zhong and G. H. Yang, ‘‘Fault detection for discrete-time switched systems with sensor stuck faults and servo inputs,’’ ISA Trans., vol. 58, pp. 196–205, Sep. 2015. [18] Z. Gao, C. Cecati, and S. X. Ding, ‘‘A survey of fault diagnosis and fault-tolerant techniques—Part II: Fault diagnosis with knowledge-based and hybrid/active approaches,’’ IEEE Trans. Ind. Electron., vol. 62, no. 6, pp. 3768–3774, Jun. 2015. [19] W. Aoudi, ‘‘Support vector machines: A distance-based approach to multi-class classification,’’ in Proc. IEEE Int. Multidisciplin. Conf. Eng. Technol. (IMCET), Sep. 2016, pp. 1–6. [20] C. J. C. Burges, ‘‘A tutorial on support vector machines for pattern recognition,’’ Data Mining Knowl. Discovery, vol. 2, no. 2, pp. 121–167, 1998. [21] S. R. Gunn, ‘‘Support vector machines for classification and regression,’’ Analyst, vol. 135, no. 2, pp. 230–267, 2010. [22] N. Shahid, S. A. Aleem, I. H. Naqvi, and N. Zaffar, ‘‘Support vector machine based fault detection & classification in smart grids,’’ in Proc. GLOBECOM Workshops (GC Wkshps), 2012, pp. 1526–1531. [23] J. Weston and C. Watkins, ‘‘Support vector machines for multi-class pattern recognition,’’ in Proc. 7th Eur. Symp. Artif. Neural Netw., Apr. 1999, pp. 219–224. [24] S. T. Dumais, ‘‘Using SVMs for text categorization,’’ IEEE Intell. Syst., vol. 13, no. 4, pp. 21–23, Sep. 1998. [25] C. Cortes and V. Vapnik, ‘‘Support-vector networks,’’ Mach. Learn., vol. 20, no. 3, pp. 273–297, 1995. [26] V. N. Vapnik, ‘‘An overview of statistical learning theory,’’ IEEE Trans. Neural Netw., vol. 10, no. 5, pp. 988–999, Sep. 1999. [27] S. Haykin, Neural Networks: A Comprehensive Foundation, 2nd ed. Upper Saddle River, NJ, USA: Prentice-Hall, 1994. [28] W. Z and X. Xue, ‘‘Multi-class support vector machines,’’ in Support Vector Machines Applications, Y. Ma and G. Guo, Eds. Springer, 2014, pp. 23–48. [29] G. Zheng and R. Craven, ‘‘Multiclass support vector machines for power system disturbances classification based on wide-area frequency measurements,’’ in Proc. Conf. IEEE SOUTHEASTCON, Oct. 2011, pp. 68–72. [30] S. Ding, H. Zhu, W. Jia, and C. Su, ‘‘A survey on feature extraction for pattern recognition,’’ Artif. Intell. Rev., vol. 37, no. 3, pp. 169–180, 2012. [31] N. J. Pithadia and V. D. Nimavat, ‘‘A review on feature extraction techniques,’’ in Proc. WiSPNET, 2015, vol. 1. no. 3, pp. 1263–1268. [32] M. Kudo and J. Sklansky, ‘‘Comparison of algorithms that select features for pattern classifiers,’’ Pattern Recognit., vol. 33, no. 1, pp. 25–41, 2000. [33] T. Fawcett, ‘‘An introduction to ROC analysis,’’ Pattern Recognit. Lett., vol. 27, no. 8, pp. 861–874, Jun. 2006.
SANA ULLAH JAN (S’17) received the B.S. degree in electronic engineering from International Islamic University, Islamabad, Pakistan, in 2012. He is currently working toward the M.S. and Ph.D. degrees with University of Ulsan, South Korea. He was a Laboratory Engineer with University of Lahore, Islamabad Campus, Islamabad, Pakistan, from 2012 to 2014. His research areas include wireless sensor networks, visible light communications, applications of bluetooth low energy, machine learning, and fault detection and diagnosis.
8690
YOUNG-DOO LEE received the B.E., M.E., and Ph.D. degrees from the School of Electrical Engineering, University of Ulsan, South Korea, in 2007, 2009, and 2013, respectively. Since 2013, he has been active as a Research Fellow with University of Ulsan. His research interests include cognitive radio, underwater acoustic communication, and next-generation wireless communication systems.
JUNGPIL SHIN (M’99) received the Ph.D. degree in communication engineering from Kyushu University, Japan, in 1999. He became an Associate Professor and a Senior Associate Professor with the School of Computer Science and Engineering, The University of Aizu, Japan, in 1999 and 2004, respectively. His research interests include pattern recognition, character recognition, image processing, and computer vision. He is currently researching the following advanced fields: penbased interaction system, real-time system, oriental character processing, mobile computing, computer education, human recognition, and machine intelligence. He is a member of the ACM, the IEICE, the IPSJ, the KISS, and the KIPS. He served several conferences as a Program Chair and a Program Committee Member for numerous international conferences and serves as a Reviewer for several SCI major journals and an Editor of journals.
INSOO KOO received the B.E. degree from Konkuk University, Seoul, South Korea, in 1996, and the M.S. and Ph.D. degrees from Gwangju Institute of Science and Technology (GIST), Gwangju, South Korea, in 1998 and 2002, respectively. From 2002 to 2004, he was with the Ultrafast Fiber-Optic Networks Research Center, GIST, as a Research Professor. From 2003 to 2004, he was a Visiting Scholar with Royal Institute of Science and Technology, Sweden. In 2005, he joined University of Ulsan, where he is currently a Full Professor. His research interests include next-generation wireless communication systems and wireless sensor networks.
VOLUME 5, 2017