J Neurophysiol 92: 1840 –1855, 2004. First published April 28, 2004; 10.1152/jn.00197.2004.
Shared and Private Variability in the Auditory Cortex Michael R. Deweese and Anthony M. Zador Cold Spring Harbor Laboratory, Cold Spring Harbor, New York 11724 Submitted 1 March 2004; accepted in final form 27 April 2004
DeWeese, Michael R. and Anthony M. Zador. Shared and private variability in the auditory cortex. J Neurophysiol 92: 1840 –1855, 2004. First published April 28, 2004; 10.1152/jn.00197.2004. The high variability of cortical sensory responses is often assumed to impose a major constraint on efficient computation. In the auditory cortex, however, response variability can be very low. We have used in vivo whole cell patch-clamp methods to study the trial-to-trial variability of the subthreshold fluctuations in membrane potential underlying tone-evoked responses in the auditory cortex of anesthetized rats. Using methods adapted from classical quantal analysis, we partitioned this subthreshold variability into a private component (which includes synaptic, thermal, and other sources local to the recorded cell) and a shared component arising from network interactions. Here we report that this private component is remarkably small, usually about 1–3 mV, as quantified by the variance divided by the mean of the ensemble of tone-evoked response heights. The shared component can be much larger, and shows more heterogeneity across the population, ranging from about 0 to 10 mV. The remarkable fact that, at least 5 synapses from the auditory periphery, this variability remains so small raises the possibility that the intervening neural circuitry is organized so as to prevent private noise from accumulating as neural signals propagate to the cortex. INTRODUCTION
Neuronal fidelity can impose important constraints on how the cortex represents information, and on computational strategies. In the visual cortex, repeated presentations of the same sensory stimulus typically elicit highly variable neuronal responses (Buracas et al. 1998; Dean 1981; Heggelund and Albus 1978; Tolhurst et al. 1983; cf. Kara et al. 2000). This unreliability has been proposed to reflect a fundamental and general limitation of cortical architecture (Shadlen and Newsome 1998). In the auditory cortex, however, variability can be much lower. Repeated presentations of the same acoustic stimulus can elicit responses with very low trial-to-trial spike count variability; in some cases, this variability is as low as mathematically possible, given the firing rate (DeWeese et al. 2003). Such reliable responses raise the possibility that cortical computation might not be organized around inherently noisy responses. Cortical spike trains arise from the integration of synaptic inputs generated by other cortical and subcortical neurons. The subthreshold fluctuations in membrane potential associated with these inputs offer a rich source of information about the cellular, synaptic, and circuit processes underlying the suprathreshold variability. Although variability of visual cortical responses has been assessed by means of a variety of intracellular, extracellular, and optical techniques (Ahissar et al. 1992; Anderson et al. 2000a,b; Arieli et al. 1995, 1996; Ferster 1996; Address for reprint requests and other correspondence: A. Zador, Cold Spring Harbor Laboratory, 1 Bungtown Rd., Cold Spring Harbor, NY 11724 (E-mail:
[email protected]). 1840
Lampl et al. 1999; Monier et al. 2003; Tsodyks et al. 1999), variability in the auditory cortex has not received comparable scrutiny. We have measured subthreshold response variability in the auditory cortex using whole cell patch-clamp recording. The rodent auditory cortex provides a convenient experimental system for studying synaptic variability in vivo. Brief tones elicit postsynaptic potentials (PSPs) with a stereotyped form and latency, reminiscent of the electrically evoked PSPs recorded in in vitro preparations such as brain slice and the neuromuscular junction (del Castillo and Katz 1954). This similarity allows us to build on the extensive conceptual framework that has been developed for analyzing synaptic variability in vitro (Katz 1966). Here we report that in some neurons subthreshold variability is very low—a millivolt or less—whereas in others it is much higher. We partitioned this total subthreshold variability into a private component (which includes synaptic, thermal, and other sources local to the recorded cell) and a shared component arising from network interactions (see Fig. 1). We found that the private component was consistently small, usually about 1–3 mV as quantified by the variance over the mean height of evoked responses, even when the total variability was much higher (0 –10 mV). The remarkable fact that, at least 5 synapses from the auditory periphery, the variability remains so small raises the possibility that special mechanisms prevent the noise from growing as the neural signal propagates along this neural pathway (cf. Shadlen and Newsome 1998). Our results help bridge the gap between the phenomenological study of sensory-evoked variability and the synaptic mechanisms underlying this variability. METHODS
To assess the trial-to-trial variability of tone-evoked responses in vivo, we presented 32 brief pure-tone pips of different frequencies and fixed intensity while recording from neurons in the auditory cortex of anesthetized rats. Each pip was presented repeatedly, allowing us to assess the variability of the synaptic response to multiple presentations of each stimulus. We used in vivo whole cell patch-clamp methods (Borg-Graham et al. 1998; Ferster and Jagadeesh 1992; Hirsch et al. 1995; Metherate and Ashe 1993b; Moore and Nelson 1998; Nelson et al. 1994; Zhu and Connors 1999) to record the PSPs evoked by this ensemble of pure-tone pips. We also simultaneously recorded the local field potential (LFP) using a second nearby (⬃0.5 mm) patch electrode, which was instrumental in estimating the relative contributions of shared and private sources of variability. The costs of publication of this article were defrayed in part by the payment of page charges. The article must therefore be hereby marked “advertisement” in accordance with 18 U.S.C. Section 1734 solely to indicate this fact.
0022-3077/04 $5.00 Copyright © 2004 The American Physiological Society
www.jn.org
SHARED AND PRIVATE VARIABILITY IN THE AUDITORY CORTEX
1841
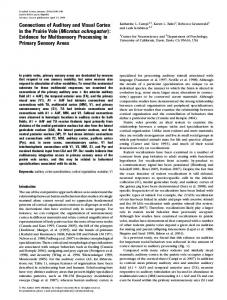
FIG. 1. Postsynaptic cortical responses recorded in the intact animal can be affected both by sources of noise that are private to the recorded neuron (e.g., thermal noise, channel noise, and stochastic vesicle release at the dendritic synapses of the recorded neuron) as well as by fluctuations in the presynaptic spiking input to the neuron, which reflect sources of variability that are shared by other neurons in the brain.
Quantifying response variability Motivated by classical quantal analysis, we quantified the deviations about the mean response to each tone in terms of the variability 2 index q, defined as the ratio of the variance ( psp ) to the mean (psp) 2 of the PSP height, q ⫽ psp /psp. The height of each PSP trace was defined as the difference between the mean value of the trace during the 15-ms window preceding stimulus onset and the peak value of the trace within the 10-ms window centered on the peak of the trialaveraged PSP. The variability index q, in units of millivolts, gives the typical scale of the fluctuations in a form that allows comparison between neurons. This measure allows us to directly compare the measured level of response variability with an estimate of the contribution from a single source of noise private to the recorded neuron— stochastic synaptic release. For comparison, we also express our main results in terms of the coefficient of variation [CV; a unitless measure of variability defined as the ratio of the SD (psp) to the mean (psp) of the PSP height; CV ⫽ psp/psp] at the end of the Variability of large mean responses section of RESULTS. To estimate the relative contributions to the total variability arising from private and shared sources we developed 2 “culling” procedures, and one estimation procedure, which we will now describe (see also Fig. 5, which describes the procedures, and Fig. 6, which illustrates how the procedures fit into the overall logic of our analysis).
LFP-based culling and PSP-based culling procedures In the LFP-based culling procedure, we identified “aberrant” (see Figs. 4 and 5) trials by first rescaling the height of the mean LFP for each trial so as to minimize the root-mean-square (rms) error between the LFP for that trial and the rescaled mean for a 100-ms window beginning 15 ms before the onset of the stimulus. It can be shown that the scale factor that minimizes the rms error is given by the ratio (x, y)/(x, x), where x is the mean LFP and y is the LFP from a particular trial; x and y are vectors in time and (x, y) represents the inner product of x and y. [To see this, take the derivative of the rms error with respect to the scale factor f, and set it to zero, d/df ¥i (xi ⫺ fy)2 ⫽ 0; then solve for f.] Once trials with an rms error above some threshold were identified, the corresponding whole cell records were removed from the synaptic ensemble (see Fig. 5a) and the average variability index, 具q典tones, of the whole cell synaptic response was recalculated, J Neurophysiol • VOL
具qLFP-culled典tones, for all tones that included at least 10 trials that survived the culling procedure. All trials with negative optimal scale factors [i.e., (x, y)/(x, x) ⬍ 0; e.g., trial 15 in Fig. 5a, and trials 3 and 8 in Fig. 5c] were also excluded from the postculling variability analysis. The same procedure was used for PSP-based culling with the whole cell record used in place of the LFP (Fig. 5c). We used PSP shape rather than PSP magnitude as the criterion for culling to avoid inadvertently reducing the variability by preferentially removing the largest (or smallest) PSPs. Culling was largely insensitive to the threshold setting; for all plots and results reported herein, we used a threshold of 0.35 times the peak-to-trough height of each tone’s mean LFP (PSP) response for LFP- (PSP-) based culling. In computing q values after each culling procedure, we avoided undersampling effects by including only those tones with at least 10 trials that remained after culling. In addition, we included only tones that elicited mean PSP heights greater than 3 mV. Because the PSP peak heights were measured relative to the average value of the membrane voltage during the 15 ms preceding the stimulus, our variability analysis was not sensitive to slow fluctuations of the rest potential (Katz 1966). LFP peak heights were also measured relative to the average value of the LFP recording during the 15 ms preceding the stimulus. As a control for the possibility that the variability index was reduced partly because of undersampling after the LFP-based culling procedure, we randomly culled an equal number of traces as the LFP-based culling procedure from each ensemble of responses corresponding to a given neuron and a given tone, and found no effect (after random culling: 具q典neurons ⫽ 4.5 ⫾ 0.1 mV, n ⫽ 20 simulations; compare with the value before culling: 具q典neurons ⫽ 4.6 ⫾ 0.5 mV, n ⫽ 33 neurons; all quantities are mean ⫾ SE unless otherwise specified). Repeating this control for the PSP-based culling procedure did reduce the variability index (after random culling: 具q典neurons ⫽ 3.67 ⫾ 0.02 mV, n ⫽ 20 simulations), despite the fact that the PSP-based culling procedure resulted in substantially fewer trials being culled (29%) than the LFP-based culling procedure (38%). Performing both LFPbased and PSP-based random culling controls on the same data set reduced the variability even further (after random culling: 具q典neurons ⫽ 2.98 ⫾ 0.02, n ⫽ 20 simulations). These reductions did not result from an undersampling bias, but were instead due to the removal of ensembles of responses corre-
92 • SEPTEMBER 2004 •
www.jn.org
1842
M. R. DEWEESE AND A. M. ZADOR
sponding to tones that elicited fewer than 10 nonaberrant PSPs from at least one neuron. This is demonstrated by a second control in which, for each neuron, we take the average of the values for the original, unculled variability index, but only for those tones that would have resulted in at least 10 trials after both culling procedures, and we find that the variability index is reduced by the same amount as we found for the combined random culling control (具q典neurons ⫽ 2.9 ⫾ 0.3 mV; n ⫽ 28 neurons). Hence, the considerable reductions in variability resulting from PSP- and LFP-based culling were not due to undersampling effects. Moreover, roughly half of the reduction from the total variability across the population (具q典neurons ⫽ 4.6 ⫾ 0.5 mV, n ⫽ 33 neurons; Fig. 7c, mean of top histogram) to our best estimate of the private level of variability (具q典neurons ⫽ 1.6 ⫾ 0.2, n ⫽ 28 neurons; Fig. 7c, mean of bottom histogram) was achieved by the identification and removal of those ensembles of responses that were too strongly affected by stimulus-independent population activity to give accurate estimates for the level of private noise. Repeating these controls for a second analysis that was restricted to tones that evoked mean responses of ⱖ15 mV (Fig. 7d), both the random culling control (具q典neurons ⫽ 3.20 ⫾ 0.05 mV, n ⫽ 20 simulations) and the second control (具q典neurons ⫽ 3.2 ⫾ 0.5 mV, n ⫽ 16 neurons) resulted in equivalent increases in the variability index, despite the fact that our best estimate for the private variability (具q典neurons ⫽ 1.5 ⫾ 0.2 mV, n ⫽ 16 neurons; Fig. 7d, bottom) for these high mean tones was extremely close to the private variability we found for the full data set, including all tones with mean responses ⬎3 mV (具q典neurons ⫽ 1.6 ⫾ 0.2, n ⫽ 28 neurons; Fig. 7c, bottom).
LFP-based estimation procedure For many tones, we found that there was still a substantial correlation between the LFP and PSP for the ensemble of trials that remained after LFP-based culling (e.g., Fig. 5b), implying that culling alone did not remove all effects of shared fluctuations. Using linear regression, we computed the best linear fit to the scatter plot across trials of the PSP height plotted as a function of the optimal scale factor computed for the LFP-based culling procedure (described in the last section). The regression line has the minimum possible mean-squared error between any linear fit and the PSP heights, and so provided the optimal linear estimator of the PSP height hi, given the LFP scale factor si, for the ith trial h iest共si兲 ⫽ msi ⫹ b
where m is the slope and b is the y-intercept of the regression line. The residual error between the estimate of the PSP height h est (si), i provided by the regression line, and the actual PSP height hi could not be accounted for by fluctuations in the LFP, at least for our simple linear estimator, and were therefore still potentially the result of private sources of variability. Accordingly, we replaced the variance 2 psp appearing in the numerator of our variability index, q ⫽ 2 N psp /psp, with the mean-squared estimation error, ¥ i⫽1 [hi ⫺ est 2 h i (si)] /(N ⫺ 1), to arrive at a tighter upper bound on the variability due to private sources than was provided by LFP-based culling alone. Here, we normalized the mean-squared estimation error by N ⫺ 1, rather than N (the number of trials remaining after LFP-based culling), to obtain an unbiased estimate of the variance of the residual fluctuations. The linear estimation procedure described above typically overestimates the reduction in the variability index resulting from the removal of shared sources because we use the same data set both to fit the parameters of the linear estimator and to compute the variance of the estimation errors. We corrected for this by repeating the estimation procedure after removing the correlation between the LFPs and PSPs by randomly shuffling the order of the PSPs relative to the LFPs. For example, after PSP- and LFP-based culling, the shuffling estimation control reduced the variability index for the neuron J Neurophysiol • VOL
shown in Fig. 5 from 具qLFP-culled,PSP-culled典tones ⫽ 0.76 mV to 具qLFP-culled,PSP-culled,shuffled,estimation典tones ⫽ 0.74 mV, so about 0.02 mV was attributed to overfitting. We therefore added 0.02 mV to the value obtained after the combined culling procedures and the (unshuffled) LFP-based estimation procedure, 具qLFP-culled,PSP-culled,estimation(uncorrected)典tones ⫽ 0.55 mV, to arrive at the corrected value 具qLFP-culled,PSP-culled,estimation典tones ⫽ 0.57 mV; all reported values in the figures and text have been corrected for overfitting of our linear estimator in this way.
Surgery Sprague–Dawley rats (17–24 days) were anesthetized in strict accordance with the National Institutes of Health guidelines, as approved by the Cold Spring Harbor Laboratory Animal Care and Use Committee. Pentobarbital (65 mg/kg) was used for 17 of the whole cell recordings; diazepam (5 mg/kg) was also used in 3 of these cases. For the 17 remaining neurons, recordings were performed under urethane (1.5 g/kg) after surgery performed under ketamine (60 mg/kg) and medetomedine (0.50 mg/kg). We found no significant difference between the neuronal variability observed during these 3 protocols (pentobarbital alone: q ⫽ 3.7 ⫾ 0.7 mV, n ⫽ 13 neurons; pentobarbital and diazepam: q ⫽ 6.1 ⫾ 2.8 mV, n ⫽ 3 neurons; urethane: q ⫽ 5.0 ⫾ 0.6 mV, n ⫽ 17 neurons; all quantities are means ⫾ SE unless otherwise specified), and only a small, although statistically significant, difference in the private component of the variability for pentobarbital alone and urethane (pentobarbital alone: qPSP-culled,LFP-culled&estimation ⫽ 1.1 ⫾ 0.1 mV, n ⫽ 12 neurons; pentobarbital and diazepam: qPSP-culled,LFP-culled&estimation ⫽ 1.5 ⫾ 0.6 mV, n ⫽ 3 neurons; urethane: qPSP-culled,LFP-culled&estimation ⫽ 2.2 ⫾ 0.3 mV, n ⫽ 13 neurons). We therefore pooled all data for our group statistics. After the animal was deeply anesthetized, it was placed in a custom naso-orbital restraint that left the ears free and clear. Local anesthetic was applied to the scalp, and a 1 ⫻ 2-mm craniotomy and durotomy were performed above the left auditory cortex. A cisternal drain was performed before the craniotomy. Before the introduction of electrodes, the cortex was covered with physiological buffer (in mM: NaCl, 127; Na2CO3, 25; NaH2PO4, 1.25; KCl, 2.5; MgCl2, 1; glucose, 25) mixed with 1.5% agar. Temperature was monitored rectally and maintained at 37°C using a feedback-controlled blanket (Harvard Apparatus). Breathing and response to noxious stimuli were monitored throughout the experiment, and supplemental dosages of pentobarbital or urethane were provided when required.
Stimuli Stimulation delivery followed essentially the same protocol as in DeWeese et al. (2003). Stimuli consisted of 25-ms pure-tone pips of 32 different frequencies (logarithmically spaced between 2 kHz and 46,731 Hz) with 5-ms 0 to 100% cosine-squared ramps applied to the onset and termination of each pip. All 32 tones were repeatedly presented at 65 dB in a fixed pseudo-random order at a rate of 2 tones/s. All experiments were conducted in a double-walled sound booth (IAC). Free-field stimuli were presented using a System II (TDT) running on a host PC connected to an amplifier (Stax SRM 313), which drove a calibrated electrostatic speaker (Stax SR303). The speaker was placed 6 cm to the right of, and at the same elevation as, the rat’s head. The head was rotated to the right by an angle between 60 and 90° about the rostral– caudal axis, so that the plane of the craniotomy was nearly horizontal.
LFP and whole cell patch-clamp recording We used standard blind whole cell patch-clamp recording techniques, modified from brain slice recordings (Stevens and Zador 1998). Membrane potential was sampled at 4 kHz in current-clamp
92 • SEPTEMBER 2004 •
www.jn.org
SHARED AND PRIVATE VARIABILITY IN THE AUDITORY CORTEX
mode (I ⫽ 0) using an Axopatch 200B amplifier (Axon Instruments) with no on-line series resistance compensation. Data were acquired using an Igor-based system (written by B. Sabatini), controlling a National Instruments card on a Dell PC computer. For some whole cell recordings, recording pipettes were filled with an internal solution consisting of (in mM): KCl, 10; K-gluconate, 140; HEPES, 10; MgCl2, 2; CaCl2, 0.05; Mg-ATP, 4; Na2-GTP, 0.4; Na2-phosphocreatine, 10; BAPTA, 10; and biocytin, 1%; pH ⫽ 7.25; diluted to 290 mOsm. The remaining whole cell recordings had an additional 1% biocytin, but did not include the 10 mM KCl. For all whole cell recordings used in the variability analysis, the fast sodium channel blocker QX-314 (5 mM), which also blocks some other activityevoked conductances, was added to the intracellular solution to block sodium channels, and therefore prevent spiking. Consequently, spiking was rare in these neurons; trials containing the occasional spike were excluded from the variability analysis. QX-314 was not used for the recordings after tetrodotoxin (TTX) application. Electrodes were pulled from filamented, thin-walled borosilicate glass (1.5 mm OD, 1.17 mm ID; World Precision Instruments) on a vertical Narishige 2-stage puller. Resistance to the bath was 3–5 M⍀ before seal formation. Recordings were performed throughout auditory cortex at electrode depths ranging from 180 to 834 microns below the cortical surface; results did not vary systematically with electrode depth. Local field potentials (LFPs) were recorded using a second whole cell electrode (filled with the physiological buffer described above in Surgery) and a second Axopatch 200B. LFP electrodes were placed roughly 0.550 mm below the cortical surface within about 0.5 mm of the whole cell electrode. Of the 61 neurons recorded for the variability analysis, 33 (from 21 animals) passed our criteria for inclusion: recordings had to be stable for at least 10 consecutive repetitions of each of the 32 tones; the rest potential had to be at or below ⫺55 mV, corrected for the liquid junction potential, which we calculated to be 12 mV for our internal solution; and at least one tone had to evoke a mean response ⬎3 mV. We presented 18 ⫾ 2 repetitions (mean ⫾ SE, n ⫽ 33 neurons; range ⫽ 10 to 63 repetitions) of each tone to every neuron that was used in our variability analysis. Twenty-nine of the 33 neurons in the variability data set met the additional criterion for inclusion in the LFP-based culling analysis: the simultaneously recorded LFP had to be stable and robust. We found no correlation between response variability and access resistance (qR-series⬎median ⫽ 4.2 ⫾ 0.7 mV, n ⫽ 17 cells; qR-series⬍median ⫽ 4.9 ⫾ 0.7 mV, n ⫽ 16 cells; median access resistance ⫽ 60 M⍀). Input resistance ranged from 19 to 141 3–5 M⍀ (median ⫽ 64 3–5 M⍀). Rest potential ranged from ⫺58 to ⫺92 mV (median ⫽ ⫺70), after being corrected for the liquid junction potential. Of the 21 neurons recorded after TTX application, 6 recordings had sufficiently low recording noise to allow unambiguous detection of miniature excitatory postsynaptic potentials (mEPSPs).
1843
RESULTS
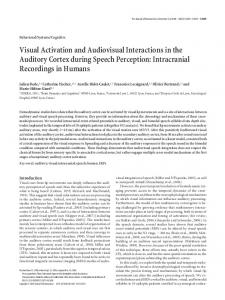
To assess the trial-to-trial variability of tone-evoked responses in vivo, we presented 32 brief pure-tone pips of different frequencies and fixed intensity while recording from neurons in the auditory cortex of anesthetized rats. Each pip was presented repeatedly, allowing us to assess the variability of the synaptic response to multiple presentations of each stimulus. We used in vivo whole cell patch-clamp methods (Borg-Graham et al. 1998; Ferster and Jagadeesh 1992; Hirsch et al. 1995; Metherate and Ashe 1993b; Moore and Nelson 1998; Nelson et al. 1994; Zhu and Connors 1999) to record the PSPs evoked by this ensemble of pure-tone pips. Stereotypy of tone-evoked subthreshold responses In all neurons, tones evoked brief short-latency PSPs, similar to those observed both in vitro (Atzori et al. 2001; Hefti and Smith 2000) and in vivo, in response to electrical stimulation (Metherate and Ashe 1993a; Mitani et al. 1985). These stereotyped responses differ markedly from typical sensory stimulusevoked responses in the visual cortex, where responses are less precisely locked to the stimulus and often last for hundreds of milliseconds (Ferster and Jagadeesh 1992). Figure 2a shows the mean response to each of 32 different tones, ranging in frequency from 2 to 47 kHz. For this neuron, the latency from stimulus onset to the peak of the mean response ranged from 27 to 42 ms, and the peak height ranged from 1.2 to 18 mV across the stimulus ensemble. Rescaling and shifting these mean responses reveal that they are all strikingly similar in shape (Fig. 2b), despite their widely disparate absolute sizes and latencies. The similarity of the mean tone-evoked responses elicited by different tones was characteristic of many auditory neurons from which we recorded. We often also observed a striking similarity among the individual PSPs recorded on different
TTX application For the recordings of mEPSPs, a standing pool of 1.0 mM TTX in a physiological buffer (see Surgery above) was applied to the surface of the cortex while playing 65-dB stimuli and monitoring the LFP. Whole cell recordings were attempted only after complete abolition of all evoked and spontaneous LFP responses. As is commonly done when measuring miniature PSPs in vitro, we used TTX to prevent spiking in any of the neuron’s presynaptic fibers. Subsequently, the only PSPs we observed were the result of the stochastic, spontaneous release of individual synaptic vesicles. Spontaneous release events are statistically independent, so simultaneous release events are infrequent—at the level of chance—allowing us to obtain a rough estimate of the distribution of the sizes of individual mEPSPs. J Neurophysiol • VOL
FIG. 2. In vivo sensory evoked synaptic responses to different acoustic tones can have different magnitudes and latencies, but similar shapes. A: in vivo whole cell current-clamp recording (with QX-314 in the recording pipette to prevent spiking) of one neuron’s mean response to each of 32 different 25-ms, 65-dB tones (time course of stimulus envelope at bottom). Each trace is the mean response to 20 presentations of the same tone. Frequencies of the 32 tones are logarithmically spaced between 2,000 and 46,731 Hz. B: 32 mean responses shown in the last panel have very similar shapes once their heights have been normalized, and they have been aligned vertically and horizontally.
92 • SEPTEMBER 2004 •
www.jn.org
1844
M. R. DEWEESE AND A. M. ZADOR
trials in response to the same tone. Thus for some neurons, the trial-to-trial variability of the PSPs elicited by repeated presentations of the same tone was remarkably low (Fig. 3a). These responses make only small deviations about the mean, and the response on each trial looks like a scaled version of the stereotyped average response. Note that in this figure, responses have been neither shifted in time nor rescaled. Trial-to-trial response variability We quantified the deviations about the mean response to each tone in terms of the variability index q, defined as the ratio 2 of the variance ( psp ) to the mean (psp) of the PSP height, 2 q ⫽ psp /psp. The variability index q, in units of millivolts, gives the typical scale of the fluctuations in a form that allows comparison between neurons. The total variability of the responses shown in Fig. 3a was 0.23 mV. Averaging across tones, the total variability for this neuron was 0.88 mV (Fig. 3a, inset), and was comparably low (1–2 mV) in about a fifth (7/33) of the neurons in our sample (Fig. 3b). Note that because the index q is based on the total response variability, it reflects not only on the real underlying response variability, but also on any additional artifactual noise introduced by the experimental apparatus, such as electrical noise. The index q thus represents an overestimate of the total variability, which in this case (Fig. 3a) is most likely ⬍0.23 mV.
The neuron shown in Fig. 3a was among the most reliable we recorded. Across the population, the variability index ranged over more than an order of magnitude, from ⬍1 to ⬎10 mV; about half (18/33) of the neurons showed a high variability index (4 –12 mV; Fig. 3b). Variability showed no systematic dependency on recording depth. Thus whereas the subthreshold activity of some auditory neurons provided a faithful and reliable reflection of the acoustic stimulus, the activity of others did not. Partitioning variability into private and shared components We partitioned this total subthreshold variability into a private component (which includes synaptic, thermal, and other sources local to the recorded cell) and a shared component arising from network interactions. There are many private sources of noise, including synaptic variability arising from stochastic quantal release, as well as from channel and thermal components (DeFelice 1981; Manwani and Koch 1999, 2001). Under some conditions, private sources such as these result in synaptic responses that consist of a small amount of noise superimposed on a stereotyped PSP. Private variability arises from fundamental biophysical limitations on neuronal processing, and therefore represents a lower bound on the total variability—a “noise floor” below which the total variability cannot fall. Shared sources, by contrast, arise from network
FIG. 3. For some cortical neurons, in vivo trial-to-trial variability of sensory-evoked synaptic responses is low. A: for the same neuron as in Fig. 2, synaptic responses to 20 consecutive presentations of the same tone were clustered tightly about the mean (thick gray trace); each black trace represents a single trial. For this tone, the variability index q32 kHz ⫽ 0.23 mV. Responses were aligned vertically by setting the mean value during the 15 ms preceding stimulus onset to zero, but note that responses were neither shifted in time nor rescaled. Average variability across tones was low (具q典tones ⫽ 0.88 mV) for this cell, as illustrated by the frequency histogram of variability indices for all 26 tones that produced a mean postsynaptic potential (PSP) ⬎3 mV (inset: mean indicated by dashed line). B: roughly a fifth (7/33) of the neurons exhibited low variability when averaged across tones (1 mV ⬍ q ⬍ 2 mV), whereas about half (18/33) were much more variable (4 mV ⬍ q ⬍ 12 mV).
J Neurophysiol • VOL
92 • SEPTEMBER 2004 •
www.jn.org
SHARED AND PRIVATE VARIABILITY IN THE AUDITORY CORTEX
interactions, and are common to a population of neurons (Abbott and Dayan 1999; Arieli et al. 1996; Gawne and Richmond 1993). In this view, private variability represents true “noise”—a real, irreversible corruption of the signal— whereas shared fluctuations might include a computationally significant signal. The division of total variability into private and shared components can be understood in the context of the following thought experiment. Suppose it were possible to measure the activity of all the neurons in the brain—all except for one lone test cortical neuron. Suppose further that one could deduce the full circuit diagram of the brain, including complete knowledge of synaptic connectivity, strengths, and so forth. Under these conditions, how well could one predict the input to the spikegenerating mechanism of that lone test neuron based on all past activity of the rest of the neurons in the circuit? If the brain were a completely deterministic and noiseless device, then the time course of the somatic membrane potential of the test neuron could be predicted with perfect accuracy. On the other hand, if the membrane potential of the test neuron could not be predicted perfectly, the prediction error would necessarily be ascribed to noise introduced privately by that lone neuron. This experiment, then, would reveal the extent to which neural responses are truly noisy, and thereby shed light on the strategies developed to compute in the face of noise. This thought experiment suggests the partitioning of a neuron’s subthreshold response variability into 2 components. The total trial-to-trial variability (Vtotal) of the synaptic response to repeated presentations of the same sensory signal can be thought of as the sum of private (Vprivate) and shared (Vshared) components V total ⫽ Vprivate ⫹ Vshared
(1)
Private refers to all sources that cause fluctuations only in the neuron under study, whereas shared refers to sources that produce correlated fluctuations—fluctuations that occur in several neurons at once. In terms of our thought experiment then, Vtotal represents the lone test neuron’s response variability across all trials regardless of how the other neurons in the brain respond, whereas Vprivate represents the trial-to-trial variability of the residual “prediction error”—the discrepancy between the predicted response of the neuron based on all other brain activity, and the actual response of the neuron. From Eq. 1, Vshared is just the difference between these quantities; it represents the residual variability that cannot be accounted for by private noise sources alone. Thus in practical terms, Eq. 1 defines what we mean by the shared component of the total variability Vshared. No matter how one chooses to quantify variability, the other 2 variables in the equation can always be defined as follows: Vtotal ⫽ V[P(r)] and Vprivate ⫽ V[P(r 兩 AP)], where V[ 䡠 ] is the functional used to quantify variability, P(r) is the average probability distribution of a neuron’s responses (r) after a particular stimulus, and P(r 兩 AP) is the conditional distribution of the neuron’s responses given complete knowledge of the presynaptic action potentials (AP) that occurred on a given trial. Vshared, then, is whatever variability is left over after the private component has been accounted for: Vshared ⫽ Vtotal ⫺ Vprivate. If we choose J Neurophysiol • VOL
1845
variance (or variance normalized by the mean across all trials) as our measure of variability, and if all shared contributions (s) and private contributions (p) to the neuron’s response are statistically independent (具sp典 ⫽ 具s典具p典, where 具. . .典 represents an average across trials) and additive (r ⫽ s ⫹ p), then Vshared reduces to V[P(s)] so that: V[P(r)] ⫽ V[P(s)] ⫹ V[P(p)], as one would intuitively expect. Partitioning variability based on the LFP With these ideas in mind, we noticed that in many cases the largest fluctuations in the whole cell records did not seem to be merely rescaled versions of the canonical response, but seemed instead qualitatively different (Fig. 4, a and c). Such aberrant trials were largely responsible for the higher variability indices in these neurons. The existence of such aberrant responses suggested that some fraction of the variability exhibited by the more variable neurons was a consequence of trial-to-trial variation of the presynaptic spiking input, rather than of noise sources private to each neuron. To the extent that shared, circuit-wide fluctuations cause these aberrant responses, one might expect the activity of nearby neurons to be similarly affected (Buracas et al. 1998; Lampl et al. 1999). We therefore devised a procedure to estimate the contribution to each neuron’s variability from shared sources. This procedure relied on a second glass electrode, positioned near (⬃0.5 mm) the primary whole cell electrode, to record simultaneously the LFP. The LFP provides a gross measure of the correlated synaptic input to a region (Arieli et al. 1996; Buracas et al. 1998); it reflects only those sources of variability that are shared by many neurons. This procedure consisted of 2 operations, which we will call “culling” and “estimation” (Fig. 6). Culling can be thought of as a way of removing outliers (aberrant responses) from the ensemble, whereas estimation can be thought of as an attempt to explain the residual variability with a linear model. For the culling procedure, we first identified individual LFP responses that did not conform to the canonical shape obtained by averaging all the LFP responses to the same tone (Fig. 5a; see METHODS). For each LFP elicited by a particular tone, we rescaled the average LFP for that tone, and then excluded those traces for which the mean-squared error between the particular response and rescaled average exceeded a threshold. The whole cell records corresponding to these aberrant LFP traces were then removed from the synaptic ensemble, and the variability index of the whole cell synaptic response was recalculated. Across the population, the distribution of errors between individual LFP traces and the mean response was not strictly bimodal for all neurons, but rather formed a continuum between dramatically aberrant responses (e.g., Fig. 4) and responses in which the deviations were smaller. Across our sample, LFP-based culling reduced the mean variability by 35% (from 4.8 ⫾ 0.5 to 3.1 ⫾ 0.1 mV; n ⫽ 29 neurons), yet there was still a correlation between the LFP and the whole cell record for the subset of unculled trials (Fig. 5b), implying that not all shared sources of variability were accounted for by LFP-based culling alone. We exploited this remaining correlation by devising a second procedure to estimate the trial-to-trial fluctuations in the whole cell record based
92 • SEPTEMBER 2004 •
www.jn.org
1846
M. R. DEWEESE AND A. M. ZADOR
FIG. 4. For some neurons, stimulus-independent, circuit-wide activity strongly affected evoked cortical responses on some trials. A: an example of a neuron that exhibited large fluctuations as a result of shared sources of input variability. Most of the PSPs (top) were well described as rescaled versions of the mean response (upper green trace), but one PSP (top red trace) was qualitatively different. Simultaneously recorded local field potentials (LFPs; bottom) from a second nearby (⬃0.5 mm) electrode followed the same pattern: the LFP (lower red trace) corresponding to the aberrant PSP was also an outlier, indicating a shared source of variability. B: scatter plot of the root-mean-squared (rms) error of the LFP vs. the rms error of the PSP shows that the aberrant LFP and whole cell traces in the previous panel are both outliers in terms of their rms errors. For both LFPs and PSPs, the rms error was computed between the voltage trace on a given trial and the rescaled mean response for the duration of the 100-ms interval beginning 15 ms before stimulus onset; the mean was optimally rescaled for each trace so that large rms errors indicate aberrant shapes, not unusually large or small response sizes (see METHODS and Fig. 5 for further details). Dashed vertical (dashed horizontal) line indicates the threshold used for LFP- (PSP-) based culling. In this example, PSP-based culling removes only the most aberrant trace, whereas LFP culling removes that trace and 3 others. C: an example of a set of responses from the same neuron as in the previous 2 panels containing an aberrant trial that happens to pass very close to the peak of the mean response; for this tone, PSP-based culling increased the variability index (q9.2 Hz ⫽ 0.47 mV, q9.2 Hz-PSP-culled ⫽ 0.57 mV). Although PSP-based culling reduced the tone-averaged variability for all but one neuron, variability increased after PSP-based culling for at least one tone in half (18/33) of the population.
on the fluctuations in the LFP responses. By substituting the PSP variance appearing in the numerator of the variability index with the mean-square error of this LFP-based estimate, we obtained a better estimate of the contribution to the total variability arising from private sources (see METHODS). The combined effect of the LFP-based culling and estimation procedures was to reduce the variability by an average of 40% across the population (qLFP-culled&estimation ⫽ 2.9 mV ⫾ 0.3 mV; n ⫽ 29 neurons; Fig. 7, a and c). In fact, these procedures reduced the variability in almost all (26/29) neurons, and in some cases the reduction was dramatic—more than a 3-fold reduction (6.3 to 1.7 mV). As with LFP-based culling alone, such large reductions were observed only when the total variability was large; when the total variability was already small (⬃1 mV), these procedures typically had little or no effect, consistent with the idea that the total variability was close to the noise floor for these neurons. We emphasize that any reduction of the variability index (recorded by the whole cell electrode) obtained by LFP-based culling and estimation arose from the elimination of sources that were not private to the neuron, given that the evidence for J Neurophysiol • VOL
excluding or estimating a response from the PSP ensemble relied solely on activity recorded on an independent, second (LFP) electrode. We wondered whether differences in the total variability among different neurons in our sample might have arisen from gross differences in the state of the animal during the experiment (e.g., because of different anesthesia levels). If this were the case, one might expect that neurons in which the total variability was high would be associated with high variability in the simultaneously recorded LFP as well. We therefore compared the CV of a simultaneously recorded LFP of the more variable neurons (CV ⫽ 0.66 ⫾ 0.06; n ⫽ 14 neurons; mean ⫾ SE) and the less variable neurons (CV ⫽ 0.74 ⫾ 0.09; n ⫽ 15 neurons). We found no significant difference (P ⫽ 0.5; Student’s t-test) between the associated LFPs; in fact, there was a slight trend in the opposite direction. Thus differences in the total variability across the neuronal population cannot be readily explained by gross, state-dependent differences evident in the LFP. Our data, then, are consistent with a model in which aberrant events in the LFP are reflected better in some neurons than in others.
92 • SEPTEMBER 2004 •
www.jn.org
SHARED AND PRIVATE VARIABILITY IN THE AUDITORY CORTEX
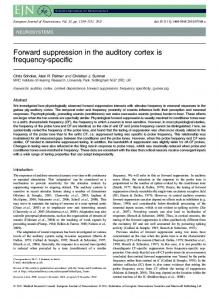
FIG. 5. Detailed examples of the LFP- and PSP-based culling procedures used to determine the contribution of shared, circuit-level fluctuations to each neuron’s total subthreshold variability. A: LFP-based culling procedure. For each presentation of a given tone, we rescaled the height of the mean LFP for that tone (top green trace) so as to minimize the rms error between the rescaled mean trace (left green traces) and the LFP for that trial (left black traces); for each trial, the simultaneously recorded whole cell trace (from a different neuron than that in previous figures) is shown on the right. On trials 3, 8, and 15, the rms error was greater than the threshold, so the whole cell traces for these trials were rejected (red traces with “No” symbols), or “culled,” from the ensemble of PSPs before repeating the variability analysis (see METHODS for further details). B: for the same neuron as in the last panel, a scatter plot of PSP height vs. LFP height for all 60 responses to the same tone that were not removed during the LFP-based culling procedure shows a clear correlation between the 2 variables (linear fit in red), indicating that LFP-based culling did not remove the effect of all shared sources of variability. C: PSP-based culling procedure. For each presentation of a given tone, we rescaled the height of the mean PSP for that tone (top green trace) so as to minimize the rms error between the rescaled mean trace and the PSP for that trial (black traces). On trials 3, 8, and 10, the rms error was greater than the threshold so these traces were rejected (red traces with “No” symbols) from the ensemble of PSPs before the variability analysis was repeated. Optimally rescaling the mean response before computing the rms error ensures that traces are culled based on their shape rather than their size, thus avoiding the confound of trivially reducing the variability by systematically removing the largest (or smallest) traces.
J Neurophysiol • VOL
92 • SEPTEMBER 2004 •
www.jn.org
1847
1848
M. R. DEWEESE AND A. M. ZADOR
FIG. 6. Schematic showing the basic steps in estimating the private contribution to the total variability. For each neuron’s set of responses to a given tone, we first quantify the total variability by computing the ratio of the variance to the mean (variability index) of the heights of the full ensemble of PSPs (top). Height of each PSP is computed at the highest point within a 10-ms window (vertical gray bar) centered on the peak of the mean PSP trace. Second, we use the simultaneously recorded LFP, recorded about 0.5 mm away from the recorded neuron, to identify trials that were strongly affected by shared, circuit-wide fluctuations (LFP-based culling procedure; see METHODS and Fig. 5a); these “aberrant” trials are removed from the PSP ensemble (middle). Third, we use a simple LFP-based estimation procedure (see METHODS and Fig. 5b) to predict the height of the PSPs (small vertical black bars within the gray bar at bottom) for all unculled trials. Finally, we take the ratio of the variance of the errors between the true PSP heights and our LFP-based estimate, and divide by the mean PSP height to arrive at an upper bound on the amount of variability attributable to private sources alone. To obtain our “best estimate” of the variability attributed to private noise sources, we repeat the above procedure after first performing the PSP-based culling procedure (see METHODS and Fig. 5c).
Partitioning variability based on PSP shape Although the LFP-based culling and estimation procedures effectively reduced variability in some neurons, in other neurons they had little effect, even when the total variability was large. This apparent failure could have been attributable to real heterogeneity in the noise floor for different neurons, or to a failure of the LFP-based procedures themselves. That we see J Neurophysiol • VOL
any effect at all by culling and estimation based on the LFP might seem surprising because the activity monitored by the LFP electrode need not reflect the population causing the aberrant activity. For example, it is possible that LFP-based culling would have been more effective in some recordings if the LFP electrode had been positioned closer to the whole cell recording electrode.
92 • SEPTEMBER 2004 •
www.jn.org
SHARED AND PRIVATE VARIABILITY IN THE AUDITORY CORTEX
1849
FIG. 7. Circuit-wide fluctuations can account for over 80% of the trial-to-trial variability of sensory-evoked synaptic responses in vivo, yet all neurons had comparable levels of private noise. A: scatter plot of the upper bound on the private variability provided by qLFP-culled&estimation (the variability index after the LFP-based culling and estimation procedures) as a function of the total variability q (the variability index of the original data set) shows that the combined LFP-based operations reduced the variability index by as much as 71%, and nearly always resulted in a reduction (total variability ⫽ 具q典neurons ⫽ 4.6 ⫾ 0.5 mV, n ⫽ 33 neurons; upper bound on private noise ⫽ 具qLFP-culled&estimation典neurons ⫽ 2.9 ⫾ 0.3 mV, n ⫽ 29 neurons; uncertainties are SE values across cells). Error bars in figure are ⫾SE across tones. B: scatter plot of our best estimate of the private variability, qPSP-culled,LFPculled&estimation, as a function of the total variability q, demonstrates that PSP-based culling followed by the LFP-based culling and estimation procedures reduced the variability by as much as 85%, and that the level of variability attributed to private noise sources was comparable, and low, for all neurons (best estimate of private variability ⫽ 具qPSP-culled,LFP-culled&estimation典neurons ⫽ 1.6 ⫾ 0.2 mV, n ⫽ 28 neurons). C: a frequency histogram (top) of the tone-averaged variability index q shows that roughly half of the neurons were highly variable, whereas others displayed low variability. LFP-based culling and estimation procedures performed alone (middle) and following PSP-based culling (bottom) revealed that shared sources of variability accounted for the wide disparity across the population; all neurons had comparable levels of private noise (same data as in Figs. 3b and 7, a and b replotted; histogram means indicated by dashed lines). Roughly half of this reduction in variability was attributed to the identification and removal of those tones that elicited fewer than 10 nonaberrant trials from neurons most susceptible to network fluctuations (see METHODS). D: same as the previous panel, except that here we include data only from tones that evoked mean PSPs of ⱖ15 mV, which would have been more likely to affect the variability of the neuron’s spiking output than other tones. Total variability of these responses was less than that of the full data set (top; 具q典neurons ⫽ 2.9 ⫾ 0.4 mV, n ⫽ 19 neurons), but the upper bound on the private variability provided by the LFP-based culling and estimation procedures (middle; 具qLFP-culledandestimation典neurons ⫽ 1.9 ⫾ 0.3 mV; n ⫽ 16 neurons), as well as the combined PSP- and LFP-based procedures (bottom; 具qPSP-culled,LFP-culled&estimation典neurons ⫽ 1.5 ⫾ 0.2 mV; n ⫽ 16 neurons), resulted in nearly the same level of private variability as the combined procedures on the full data set (b, and bottom of c).
We therefore adopted an alternative culling procedure based on the shape of the PSP itself (Fig. 5c; see METHODS). Motivated by the stereotyped time course of the PSP (Figs. 3a and 4, a and c), we reasoned that the aberrant responses identified by the LFP recording might also give rise to similarly aberrant PSP responses. Culling based on PSP shape (also called temJ Neurophysiol • VOL
plate-based selection) is sometimes used in in vitro brain slice experiments to distinguish stimulus-evoked and spontaneous responses (Dobrunz and Stevens 1997; Liao et al. 1992). In brain slices, however, PSP-culling typically leads to only a relatively small reduction in variability, in that the amount of spontaneous activity is usually quite small.
92 • SEPTEMBER 2004 •
www.jn.org
1850
M. R. DEWEESE AND A. M. ZADOR
The PSP-based culling procedure was similar to LFP-based culling: For each PSP elicited by a particular tone we rescaled the average PSP for that tone, excluded those traces for which the mean-squared error between them exceeded a threshold, and then recomputed the variability index for the remaining PSP responses. By relying on the shape, rather than the magnitude, of individual PSPs, we avoided the artifactual lowering of variability that might have occurred had we simply removed the largest (or smallest) PSPs. On average, PSP-based culling reduced the variability index to a level comparable to that of the combined LFP-based procedures (qPSP-culled ⫽ 2.2 ⫾ 0.3 mV; n ⫽ 33 neurons), but there were differences. As with the LFP-based procedures, PSP-based culling had little effect on the least variable neurons; in fact, PSP-based culling was slightly less effective for these neurons. However, for the more variable neurons, the reduction in variability after PSPbased culling was slightly more systematic—in almost all (32/33) neurons, the variability index after PSP-based culling was at most about 3 mV, compared with several higher values of about 5 mV for the combined LFP-based procedures (Fig. 5, a–c). A likely explanation for the greater efficacy of PSP-based culling for the most variable neurons is that it necessarily monitors the appropriate population of inputs. By contrast, LFP-based procedures can identify only the subset of shared fluctuations that affect neurons in the vicinity of the second (LFP) electrode, although they are more effective at removing smaller shared fluctuations within this subset because of the greater sensitivity of the LFP-based estimation procedure compared with culling. We note that PSP-based culling could conceivably be influenced by both private and shared noise sources and consequently does not, unlike the LFP-based culling and estimation procedures, provide an upper bound on the private noise contribution to the variability index. Nevertheless, it seems in practice unlikely that private noise sources could induce trial-to-trial variability in PSP height—particularly under conditions when many active conductances are blocked with QX-314—while at the same time preserving the precise waveform of the PSP. Moreover, the fact that both culling procedures were effective seems noteworthy, given that neither is mathematically constrained to reduce the variability at all; indeed, each procedure actually increased the variability in some cases (e.g., see Figs. 4c, 7a). We thus view the LFP- and PSP-based procedures as complementary approaches: the LFP-based procedures provide a bound, but are blind to some shared sources of variability that can be quite significant, whereas PSP-based culling effectively removes all strong sources of shared variability, but is generally insensitive to small fluctuations. Combining both of these approaches resulted in an even greater reduction in variability (qPSP-culled,LFP-culled&estimation ⫽ 1.6 ⫾ 0.2 mV; Fig. 7, b and c), most likely providing a more accurate estimate of the true underlying variability attributable to private sources than either the LFP- or PSP-based method performed alone. Variability of large mean responses In all of the preceding analysis, we included responses to all tones from every neuron, provided we had at least 10 trials and mean responses of at least 3 mV for any given tone. However, tones that elicit larger PSPs on average probably have a stronger effect on the variability of the spiking outputs of the recorded neuron because these are more likely to evoke PSPs in the range of spike threshold. We therefore repeated the above analyses for the subset of tones with mean responses of ⱖ15 mV. As shown in Fig. 7d, J Neurophysiol • VOL
the total variability of these large mean responses (具q典neurons ⫽ 2.9 ⫾ 0.4 mV, n ⫽ 19 neurons) was less than that of the full set of responses, yet they displayed the same level of private noise (具qPSP-culled,LFP-culled&estimation典neurons ⫽ 1.5 ⫾ 0.2 mV; n ⫽ 16 neurons) as the average tone. In fact, for these high mean responses, the upper bound on the level of private noise provided by the LFP-based procedures alone (具qLFP-culled&estimation典neurons ⫽ 1.9 ⫾ 0.3 mV; n ⫽ 16 neurons) was in agreement with our best estimate for the private noise level. Expressed in terms of the coefficient of variation, the total variability of the high mean responses (具CV典neurons ⫽ 0.37 ⫾ 0.03, n ⫽ 19 neurons) was lower than the total variability of the full data set (具CV典neurons ⫽ 0.73 ⫾ 0.04, n ⫽ 33 neurons). However, the private contribution to the variability of the large mean responses (具CVPSP-culled,LFP-culled&estimation典neurons ⫽ 0.27 ⫾ 0.01, n ⫽ 16 neurons) was also significantly lower than the private contribution to the full data set (具CVPSP-culled,LFP-culled&estimation典neurons ⫽ 0.41 ⫾ 0.02, n ⫽ 28 neurons), in contrast to what we found for the variability index. Thus the variability index is apparently a more consistent measure of private variability for different mean response sizes. Spontaneous events veto evoked responses Our finding that spontaneous circuit activity interacts with evoked sensory responses is consistent with earlier reports using optical and electrophysiological methods (Arieli et al. 1995, 1996; Buracas et al. 1998). However, these earlier studies found a positive correlation between spontaneous and evoked responses: greater ongoing activity preceding the sensory stimulus resulted in an enhancement of the evoked response. Based on this, one might have expected that the magnitude of spontaneous activity reflected in the LFP preceding the stimulus would have been positively correlated with the strength of the tone-evoked PSP. Surprisingly, we found instead just the opposite: there was a systematic negative correlation (correlation coefficient ⫽ ⫺0.14 ⫾ 0.02; n ⫽ 29 neurons). Furthermore, we found that the magnitude of spontaneous subthreshold membrane potential events preceding the stimulus was anticorrelated with the strength of tone-evoked responses in 91% (30/33) of the neurons in our sample (correlation coefficient ⫽ ⫺0.22 ⫾ 0.03; n ⫽ 33 neurons; Fig. 8, c and d). A striking example of this effect is shown in Fig. 8, a and b (see also Fig. 4, a and c and trials 3, 8, and 10 of Fig. 5), where both the whole cell record and the LFP reveal a large spontaneous event preceding the stimulus, but no response after the onset of the tone. It is as if the spontaneous event “vetoed” the evoked response. The occurrence of this type of behavior in the whole cell record was typically mirrored by the LFP, implying that the veto involved and affected a population of neurons. Thus one might think of this phenomenon as a circuit-level veto of evoked responses. This circuit-level veto has not been previously described, and its role is at present uncertain (but see Loebel and Tsodyks 2002; Tsodyks et al. 2000). Comparison to the contribution from stochastic synaptic release The most reliable neuron showed an average total variability of 0.88 mV, and the most reliable response elicited in
92 • SEPTEMBER 2004 •
www.jn.org
SHARED AND PRIVATE VARIABILITY IN THE AUDITORY CORTEX
1851
FIG. 8. Substantial spontaneous activity preceding the stimulus is correlated with a diminished or aberrant evoked response. A: for the same neuron as in Fig. 5, most of the 63 responses (black traces) to the same tone look like rescaled versions of the mean response (green trace), but some, like the red trace, have an aberrant shape. B: here the red aberrant trace from the previous panel is extended forward and backward in time (top trace); the red half of the trace begins at stimulus onset. Expanded timeline shows that this aberrant response follows a large spontaneous event that preceded the stimulus. Both the large spontaneous event and the apparent absence of an evoked response are mirrored by the LFP (bottom trace), which was recorded about 0.5 mm away, indicating that this preclusion phenomenon affects a large population. Mean evoked PSP and LFP traces (green) are shown for comparison. C: for the same neuron as in the previous panels, the size of the maximum spontaneous event during the 100 ms preceding each stimulus presentation is anticorrelated with the magnitude of the evoked response. d: magnitude of the maximum spontaneous event preceding the stimulus is anticorrelated with the evoked PSP for 91% (30/33) of the population (correlation coefficient ⫽ ⫺0.22 ⫾ 0.03; n ⫽ 33 neurons).
this neuron was 0.23 mV. In what sense are these numbers small? To address this question, we can try to relate these in vivo values to the many possible biophysical sources of private noise, including thermal, channel, synaptic, and J Neurophysiol • VOL
others. Theoretical work suggests that synaptic variability arising from stochastic synaptic release may be the dominant source of private noise (Manwani and Koch 2001; Zador 1998).
92 • SEPTEMBER 2004 •
www.jn.org
1852
M. R. DEWEESE AND A. M. ZADOR
Under the assumptions of classical quantal analysis (Katz 1966), the variability index can be interpreted in terms of the quantal model of synaptic release. In particular, if all the noise were the result of quantal fluctuations and if the assumptions of quantal analysis were met, then the variability index q would be equal to the quantal size—the response elicited by a single vesicle of neurotransmitter. In practice, the variability index as we have defined it operationally includes other noise sources as well, so the experimentally measured variability index q will typically be greater than the quantal size. We therefore compared the measured variability to that expected from quantal fluctuations. Following classical quantal analysis, we recorded spontaneous PSPs in vivo while evoked activity was silenced with TTX to obtain an independent estimate of the quantal size. The mean spontaneous mEPSP, Qmini, provides an approximation of Q, the average response elicited by a single vesicle of evoked neurotransmitter, under the simplest quantal assumptions. Our estimate of the distribution of mEPSPs in vivo (Qmini ⫽ 0.39 ⫾ 0.08 mV; n ⫽ 6 neurons) is consistent with some previous estimates (0.35 mV) obtained in vitro (Gil et al. 1999; see also Stevens and Zador 1998; but cf. Pare et al. 1997). The width of the distribution of mEPSPs sizes (CV ⫽ 0.36 ⫾ 0.03; n ⫽ 6 neurons) may have been attributable to electrotonic effects, as well as to intrinsic variability in quantal size across different synapses and at the same synapse (Bekkers et al. 1990). We did not record spontaneous miniature PSPs in the same set of neurons used in the variability analysis presented above. Moreover, for any given neuron, the distribution of synapses reflected by an observed mEPSP distribution might well be different from the subset of synapses participating in stimulusevoked responses. Accordingly, we interpret Qmini merely as a rough estimate of the contribution of stochastic release to response variability. For 42% (14/33) of the neurons, at least one tone elicited responses whose variability index q was within a factor of 2 of the 0.38 mV expected from stochastic release alone. In the most extreme cases (e.g., Fig. 3a), effectively all of the variability could be ascribed to stochastic release. Our experimental results thus support the idea that a single private noise source, stochastic quantal release, may constitute the largest single source of private noise in vivo. The remarkable fact that, at least 5 synapses from the auditory periphery, variability can approach the theoretical lower limit raises the possibility that special mechanisms prevent the noise from growing as the neural signal propagates along this neural pathway (cf. Shadlen and Newsome 1998). DISCUSSION
Using whole cell patch-clamp recording, we have performed the first analysis of the synaptic variability underlying soundevoked responses in the auditory cortex. We partitioned the variability of subthreshold membrane potential fluctuations into private and shared components. We found that the private component was surprisingly small, about 1–3 mV, and relatively homogeneous across the population. The shared component was often much larger, and showed more heterogeneity across the population, ranging from about 0 to 10 mV. The remarkably low level of private variability suggests that cortiJ Neurophysiol • VOL
cal neurons may operate in the low-noise regime, and that the large variability typically observed during sensory-evoked responses need not reflect an irreversible corruption of the sensory signal. It has long been known that the activity of individual neurons can be well correlated with the network in which they are embedded, indicating that shared variability can be large. For example, both spiking and intracellular activity can be strongly correlated with the electrical (e.g., EEG) or optical measures of population activity, during both evoked and spontaneous activity (Thatcher and John 1977). In one early but striking demonstration, the time course of the poststimulus time histogram (PSTH) evoked in visual cortical neurons by light flashes was found to replicate exactly the time course of the local field potential recorded from the same electrode (Fox and O’Brien 1965). Similarly, nearby neurons often show correlations in spiking activity (Harris et al. 2003; Zohary et al. 1994). The correlation between activity in single neurons has been perhaps most vividly demonstrated by simultaneous intracellular recordings of spontaneous subthreshold fluctuations in visual cortex (Lampl et al. 1999). Thus the existence of such shared fluctuations is not surprising. What is surprising is how little unexplained residual neuronal variability remains in the synaptic input to a single neuron after accounting for the variability in the population activity. Indeed, this residual variability approaches the lower limit set by a single source of private noise, the fluctuations associated with stochastic quantal synaptic transmission. Variability of cortical representation What is signal and what is noise in a neuronal response? Because the earliest single-unit recordings (Hubel and Wiesel 1959; Werner and Mountcastle 1963), sensory-evoked responses in both the awake and anesthetized cortex have generally been found to be highly variable: the same stimulus typically elicits a different response on each presentation. Even in the auditory cortex, where binary spiking approaches the mathematical lower limit of variability possible for a given firing rate (DeWeese et al. 2003), some variability remains. Consistent with the present findings, some auditory cortical neurons respond to complex stimuli with low-variability subthreshold responses, whereas others are more variable (Machens et al. 2004). The origins and significance of cortical variability have been widely debated (Diesmann et al. 1999; Kistler and Gerstner 2002; Manwani and Koch 1999; Marsalek et al. 1997; Mazurek and Shadlen 2002; Pouget et al. 2000; Shadlen and Newsome 1998; Softky and Koch 1993; Stevens and Zador 1998). Sensory physiologists often find it convenient to assume that any stimulus-locked neural activity is signal, and that any fluctuation around that activity is noise. This view, however, presupposes that the job of each neuron in sensory cortex is to encode sensory stimuli as accurately as possible. Over the last decade, a series of experiments has shown that much of the trial-to-trial variability can be attributed to population activity, raising the possibility that what is noise from the experimenter’s perspective need not be noise from the perspective of the animal (Arieli et al. 1995, 1996; Harris et al. 2003; Lampl et al. 1999; Tsodyks et al. 1999).
92 • SEPTEMBER 2004 •
www.jn.org
SHARED AND PRIVATE VARIABILITY IN THE AUDITORY CORTEX
One manifestation of what we have called shared variability is correlated neuronal activity, which has been documented in a wide variety of experimental preparations using a range of recording techniques. In the visual cortex of awake behaving monkeys, for example, some of the trial-to-trial variability in the stimulus-locked response can be accounted for by the activity of nearby neurons recorded simultaneously using extracellular methods (Zohary et al. 1994). Similar methods have revealed correlations in the auditory (deCharms and Merzenich 1996; Eggermont and Smith 1995) and somatosensory (Steinmetz et al. 2000) cortices. Correlations have been variously interpreted as an impediment to (Zohary et al. 1994) or essential for (deCharms and Merzenich 1996) efficient sensory representation, or as a target for nonsensory (attentional) modulation (Steinmetz et al. 2000). Using intracellular methods, we have been able to quantify directly the relative contribution of shared and private variability to the voltage fluctuations that provide the input to the neuron’s spike generating mechanism. By contrast, studies in which only the spiking activity from a pair of neurons is measured must invoke additional—and often strongly modeldependent—assumptions to make inferences about the correlational structure of synaptic input. The reason is that, by definition, recording from a pair of neurons provides an estimate only of the second-order (i.e., pairwise) structure of the synaptic input; moreover, even in the limited context of pairwise interactions, it provides evidence about only a single pair (i.e., about only a single element out of the entire matrix describing all interactions between all pairs of neurons). Theoretical work has shown that the details of correlational structure can determine the effect of correlations on representations (Abbott and Dayan 1999). Because we have direct access to the neuron’s membrane potential, we can circumvent the need to make additional assumptions about the correlational structure of the inputs. We have also uncovered a marked heterogeneity in the partitioning of variability across auditory cortical neurons (Fig. 7): whereas some neurons operated near the limit set by private noise, in others shared fluctuations were the dominant source (ⱕ85%) of variability. This heterogeneity raises the possibility that different neurons may play different roles in sensory processing. For example, less variable neurons might provide a more faithful representation of the input signal, whereas more variable neurons might provide a substrate for the integration of signals from the sensory periphery with feedback signals from higher cortical regions. Interpretation in terms of classical quantal analysis Under the assumptions of classical quantal analysis (Katz 1966), the variability index q can be interpreted in terms of the quantal model of synaptic release. The simplest form of this model makes 2 central assumptions. First, stimulus-evoked release of neurotransmitter packets at each of N excitatory synapses is assumed to be statistically independent, with a uniform release probability p, and a uniform quantal size (usually interpreted as the response to a single packet) Q; and second, unitary EPSPs add linearly. Under these assumptions, if N is sufficiently large and p sufficiently small, EPSP heights will be Poisson distributed, with a mean of NpQ, and a variance J Neurophysiol • VOL
1853
of NpQ2; the variability index q is then equal to the quantal size, q ⫽ var/mean ⫽ NpQ2/NpQ ⫽ Q. If all the noise were attributable to quantal fluctuations, and if the assumptions of this simple quantal analysis were met, then the variability index q would be exactly equal to the quantal size Q. In practice, however, these idealized assumptions are never completely satisfied in any experimental system: deviations from these simplifying assumptions plague all quantal analyses and may cause the experimentally measured index q to misestimate the contribution of stochastic quantal release to the total variability. On the one hand, deviations from the (low-p, high-N) Poisson limit, truncation of the miniature distribution for small responses, and sublinear summation lead to an overestimate of the contribution of stochastic release to the total variability. On the other hand, other factors lead to an underestimate of the contribution of stochastic release to q, including for instance synapse-to-synapse nonuniformity (Brown et al. 1976) of quantal size and release probability (Dobrunz and Stevens 1997). This effect will be particularly strong if the release probability p is positively correlated with quantal size Q (Schikorski and Stevens 1997). Similarly, any experimental sources of noise, including recording noise, can artifactually inflate the total variance and likewise lead to an underestimate of the relative effect of quantal release. In addition to the deviations noted above, our results were subject to a deviation not usually encountered in quantal analysis. Because the present experiments were carried out in vivo, we could not isolate a pure excitatory component, so tone-evoked responses consisted of a mix of excitatory and inhibitory PSPs. Indeed, recent results (Wehr and Zador 2003) indicate that the tone-evoked inhibitory conductance is typically nearly as large as its excitatory counterpart, and arrives nearly synchronously (2–3 ms) with it. The effect of these inhibitory inputs is to decrease the mean response while increasing its variance, leading thereby to an underestimate of the contribution of quantal release to the total variability. Taken together, these deviations from the ideal quantal assumptions—particularly the presence of a large and balanced inhibitory component to the evoked response—suggest that the experimentally measured distribution of miniature PSPs, Qmini, provides a conservative estimate for the expected contribution of stochastic release to the total recorded variability q. Speculation on the role of shared variability The presence of significant shared response variability in the sensory cortex is not—at least in hindsight—surprising. The number of neurons in the primary auditory cortex greatly exceeds the number of auditory nerve fibers, even though the amount of information represented by the cortex about the acoustic world cannot exceed the amount of information encoded at the periphery. This excess “representational bandwidth” available to the cortex implies that sensory information need not be lost, even if the activity of most cortical neurons is only loosely coupled to the sensory stimulus. For example, if neurons in the auditory cortex outnumbered those in the auditory nerve by 100:1 but were otherwise similar, then each cortical neuron could carry 1% of the information carried by a typical auditory nerve fiber without loss of total information. Simple considerations such as these suggest that sensory cod-
92 • SEPTEMBER 2004 •
www.jn.org
1854
M. R. DEWEESE AND A. M. ZADOR
ing efficiency does not, by itself, strongly constrain cortical representations. We have observed substantial, circuit-wide fluctuations in sensory-evoked synaptic responses, simultaneously affecting many neurons in auditory cortex. Thus we have identified a potential “signal,” available to many neurons, made possible by the excess representational bandwidth in the cortex. Because the present experiments were conducted in the anesthetized preparation, they cannot address directly the role that this shared variability may play in the awake animal. However, shared variability has been observed in awake animals—in the visual cortex, for example, some of the trial-to-trial variability in the stimulus-locked response can be accounted for by the preceding LFP (Buracas et al. 1998), or by the activity of nearby neurons recorded simultaneously (Zohary et al. 1994). If the magnitude of the shared contribution to neuronal variability in the awake preparation is confirmed to be comparable to what we report here, then it will clearly be key to understand what role, if any, it plays. One possibility is that this shared variability might represent a nonsensory signal. The ability of stimulus-independent influences, such as attention (Reynolds et al. 2000; Treue and Maunsell 1996), to modulate sensory responses is well established. Indeed, the stimulus-independent component of the correlation between neuronal response and behavior—sometimes interpreted as the result of noise in sensory cortex biasing a decision (Britten et al. 1996)—might instead reflect a signal from other brain areas carrying information about bias or intention (Steinmetz et al. 2000). Shared fluctuations in the behaving animal might thus represent a conduit for the highlevel modulation of sensory responses. Alternatively, the shared component might simply represent noise (Zohary et al. 1994). One way this could arise is if the information encoded in the shared variability were, for some reason, unavailable for useful computation. For example, in a completely deterministic neural circuit operating in a chaotic regime, all variability is shared, yet it is hard to imagine how this could be exploited. However, our results demonstrate that shared variability is easily identified, even with the crude assays available to us as experimentalists; the cortex, with vastly more subtle mechanisms available to it, may well have evolved a means of exploiting this excess bandwidth. Thus it seems to us plausible that shared variability may carry a useful, nonsensory signal. GRANTS
This work was supported by grants from the National Institutes of Health, the Sloan Foundation, the Packard Foundation, and the Mathers Foundation to A. M. Zador and by a Swartz fellowship to M. R. DeWeese. REFERENCES
Abbott LF and Dayan P. The effect of correlated variability on the accuracy of a population code. Neural Comput 11: 91–101, 1999. Ahissar E, Vaadia E, Ahissar M, Bergman H, Arieli A, and Abeles M. Dependence of cortical plasticity on correlated activity of single neurons and on behavioral context. Science 257: 1412–1415, 1992. Anderson JS, Lampl I, Gillespie DC, and Ferster D. The contribution of noise to contrast invariance of orientation tuning in cat visual cortex. Science 290: 1968 –1972, 2000a. Anderson JS, Lampl I, Reichova I, Carandini M, and Ferster D. Stimulus dependence of two-state fluctuations of membrane potential in cat visual cortex. Nat Neurosci 3: 617– 621, 2000b. Arieli A, Shoham D, Hildesheim R, and Grinvald A. Coherent spatiotemporal patterns of ongoing activity revealed by real-time optical imaging J Neurophysiol • VOL
coupled with single-unit recording in the cat visual cortex. J Neurophysiol 73: 2072–2093, 1995. Arieli A, Sterkin A, Grinvald A, and Aertsen A. Dynamics of ongoing activity: explanation of the large variability in evoked cortical responses. Science 273: 1868 –1871, 1996. Atzori M, Lei S, Evans DI, Kanold PO, Phillips-Tansey E, McIntyre O, and McBain CJ. Differential synaptic processing separates stationary from transient inputs to the auditory cortex. Nat Neurosci 4: 1230 –1237, 2001. Bekkers JM, Richerson GB, and Stevens CF. Origin of variability in quantal size in cultured hippocampal neurons and hippocampal slices. Proc Natl Acad Sci USA 87: 5359 –5362, 1990. Borg-Graham LJ, Monier C, and Fregnac Y. Visual input evokes transient and strong shunting inhibition in visual cortical neurons. Nature 393: 369 –373, 1998. Britten KH, Newsome WT, Shadlen MN, Celebrini S, and Movshon JA. A relationship between behavioral choice and the visual responses of neurons in macaque MT. Vis Neurosci 13: 87–100, 1996. Brown TH, Perkel DH, and Feldman MW. Evoked neurotransmitter release: statistical effects of nonuniformity and nonstationarity. Proc Natl Acad Sci USA 73: 2913–2917, 1976. Buracas GT, Zador AM, DeWeese MR, and Albright TD. Efficient discrimination of temporal patterns by motion-sensitive neurons in primate visual cortex. Neuron 20: 959 –969, 1998. Dean AF. The variability of discharge of simple cells in the cat striate cortex. Exp Brain Res 44: 437– 440, 1981. deCharms RC and Merzenich MM. Primary cortical representation of sounds by the coordination of action-potential timing. Nature 381: 610 – 613, 1996. DeFelice LJ. Introduction to Membrane Noise. New York: Plenum Press, 1981. del Castillo J and Katz B. Quantal components of the end-plate potential. J Physiol 124: 560 –573, 1954. DeWeese MR, Wehr M, and Zador AM. Binary spiking in auditory cortex. J Neurosci 23: 7940 –7949, 2003. Diesmann M, Gewaltig MO, and Aertsen A. Stable propagation of synchronous spiking in cortical neural networks. Nature 402: 529 –533, 1999. Dobrunz LE and Stevens CF. Heterogeneity of release probability, facilitation, and depletion at central synapses. Neuron 18: 995–1008, 1997. Eggermont JJ and Smith GM. Rate covariance dominates spontaneous cortical unit-pair correlograms. Neuroreport 6: 2125–2128, 1995. Ferster D. Is neural noise just a nuisance? Science 273: 1812, 1996. Ferster D and Jagadeesh B. EPSP–IPSP interactions in cat visual cortex studied with in vivo whole-cell patch recording. J Neurosci 12: 1262–1274, 1992. Fox SS and O’Brien JH. Duplication of evoked potential waveform by curve of probability of firing of a single cell. Science 147: 889 – 890, 1965. Gawne TJ and Richmond BJ. How independent are the messages carried by adjacent inferior temporal cortical neurons? J Neurosci 13: 2758 –2771, 1993. Gil Z, Connors BW, and Amitai Y. Efficacy of thalamocortical and intracortical synaptic connections: quanta, innervation, and reliability. Neuron 23: 385–397, 1999. Harris KD, Csicsvari J, Hirase H, Dragoi G, and Buzsaki G. Organization of cell assemblies in the hippocampus. Nature 424: 552–556, 2003. Hefti BJ and Smith PH. Anatomy, physiology, and synaptic responses of rat layer V auditory cortical cells and effects of intracellular GABA(A) blockade. J Neurophysiol 83: 2626 –2638, 2000. Heggelund P and Albus K. Response variability and orientation discrimination of single cells in striate cortex of cat. Exp Brain Res 32: 197–211, 1978. Hirsch JA, Alonso JM, and Reid RC. Visually evoked calcium action potentials in cat striate cortex. Nature 378: 612– 616, 1995. Hubel DH and Wiesel TN. Receptive fields of single neurones in the cat’s striate cortex. J Physiol 148: 574 –591, 1959. Kara P, Reinagel P, and Reid RC. Low response variability in simultaneously recorded retinal, thalamic, and cortical neurons. Neuron 27: 635– 646, 2000. Katz B. Nerve Muscle and Synapse. New York: McGraw-Hill, 1966. Kistler WM and Gerstner W. Stable propagation of activity pulses in populations of spiking neurons. Neural Comp 14: 987–997, 2002. Lampl I, Reichova I, and Ferster D. Synchronous membrane potential fluctuations in neurons of the cat visual cortex. Neuron 22: 361–374, 1999. Liao D, Jones A, and Malinow R. Direct measurement of quantal changes underlying long-term potentiation in CA1 hippocampus. Neuron 9: 1089 – 1097, 1992.
92 • SEPTEMBER 2004 •
www.jn.org
SHARED AND PRIVATE VARIABILITY IN THE AUDITORY CORTEX Loebel A and Tsodyks M. Computation by ensemble synchronization in recurrent networks with synaptic depression. J Comput Neurosci 13: 111– 124, 2002. Machens CK, Wehr MS, and Zador AM. Linearity of cortical receptive fields measured with natural sounds. J Neurosci 24: 1089 –1100, 2004. Manwani A and Koch C. Detecting and estimating signals in noisy cable structure, I: neuronal noise sources. Neural Comput 11: 1797–1829, 1999. Manwani A and Koch C. Detecting and estimating signals over noisy and unreliable synapses: information-theoretic analysis. Neural Comput 13: 1–33, 2001. Marsalek P, Koch C, and Maunsell J. On the relationship between synaptic input and spike output jitter in individual neurons. Proc Natl Acad Sci USA 94: 735–740, 1997. Mazurek ME and Shadlen MN. Limits to the temporal fidelity of cortical spike rate signals. Nat Neurosci 5: 463– 471, 2002. Metherate R and Ashe JH. Ionic flux contributions to neocortical slow waves and nucleus basalis-mediated activation: whole-cell recordings in vivo. J Neurosci 13: 5312–5323, 1993a. Metherate R and Ashe JH. Nucleus basalis stimulation facilitates thalamocortical synaptic transmission in the rat auditory cortex. Synapse 14: 132– 143, 1993b. Mitani A, Shimokouchi M, Itoh K, Nomura S, Kudo M, and Mizuno N. Morphology and laminar organization of electrophysiologically identified neurons in the primary auditory cortex in the cat. J Comp Neurol 235: 430 – 447, 1985. Monier C, Chavane F, Baudot P, Graham LJ, and Fregnac Y. Orientation and direction selectivity of synaptic inputs in visual cortical neurons: a diversity of combinations produces spike tuning. Neuron 37: 663– 680, 2003. Moore CI and Nelson SB. Spatio-temporal subthreshold receptive fields in the vibrissa representation of rat primary somatosensory cortex. J Neurophysiol 80: 2882–2892, 1998. Nelson S, Toth L, Sheth B, and Sur M. Orientation selectivity of cortical neurons during intracellular blockade of inhibition. Science 265: 774 –777, 1994. Pare D, Lebel E, and Lang EJ. Differential impact of miniature synaptic potentials on the soma and dendrites of pyramidal neurons in vivo. J Neurophysiol 78: 1735–1739, 1997. Pouget A, Dayan P, and Zemel R. Information processing with population codes. Nat Rev Neurosci 1: 125–132, 2000.
J Neurophysiol • VOL
1855
Reynolds JH, Pasternak T, and Desimone R. Attention increases sensitivity of V4 neurons. Neuron 26: 703–714, 2000. Schikorski T and Stevens CF. Quantitative ultrastructural analysis of hippocampal excitatory synapses. J Neurosci 17: 5858 –5867, 1997. Shadlen MN and Newsome WT. The variable discharge of cortical neurons: implications for connectivity, computation, and information coding. J Neurosci 18: 3870 –3896, 1998. Softky WR and Koch C. The highly irregular firing of cortical cells is inconsistent with temporal integration of random EPSPs. J Neurosci 13: 334 –350, 1993. Steinmetz PN, Roy A, Fitzgerald PJ, Hsiao SS, Johnson KO, and Niebur E. Attention modulates synchronized neuronal firing in primate somatosensory cortex. Nature 404: 187–190, 2000. Stevens CF and Zador AM. Input synchrony and the irregular firing of cortical neurons. Nat Neurosci 1: 210 –217, 1998. Thatcher RW and John ER. Functional Neuroscience: Foundations of Cognitive Processes. Hillsdale, NJ: Erlbaum, 1977. Tolhurst DJ, Movshon JA, and Dean AF. The statistical reliability of signals in single neurons in cat and monkey visual cortex. Vision Res 23: 775–785, 1983. Treue S and Maunsell JH. Attentional modulation of visual motion processing in cortical areas MT and MST. Nature 382: 539 –541, 1996. Tsodyks M, Kenet T, Grinvald A, and Arieli A. Linking spontaneous activity of single cortical neurons and the underlying functional architecture. Science 286: 1943–1946, 1999. Tsodyks M, Uziel A, and Markram H. Synchrony generation in recurrent networks with frequency-dependent synapses. J Neurosci 20: RC50, 2000. Wehr M and Zador AM. Balanced inhibition underlies tuning and sharpens spike timing in auditory cortex. Nature 426: 442– 446, 2003. Werner G and Mountcastle VB. The variability of central neural activity in a sensory system, and its implications for the central reflection of sensory events. J Neurophysiol 26: 958 –977, 1963. Zador A. Impact of synaptic unreliability on the information transmitted by spiking neurons. J Neurophysiol 79: 1219 –1229, 1998. Zhu JJ and Connors BW. Intrinsic firing patterns and whisker-evoked synaptic responses of neurons in the rat barrel cortex. J Neurophysiol 81: 1171–1183, 1999. Zohary E, Shadlen MN, and Newsome WT. Correlated neuronal discharge rate and its implications for psychophysical performance. Nature 370: 140 –143, 1994.
92 • SEPTEMBER 2004 •
www.jn.org