Keywords: signal setting design model, application, evacuation conditions. ... node models and an application of a dynamic traffic assignment model are.
Risk Analysis VII
PI-443
Signal setting design on a road network: application of a system of models in evacuation conditions F. A. Marcianò, G. Musolino & A. Vitetta Mediterranea University of Reggio Calabria, Italy
Abstract This paper presents an application of a system of models and procedures for signal setting design on a road network in evacuation conditions. The system of models, based on a what-to approach, generates signal setting parameters taking into account users behaviour at path choice level. The application has been executed on a real experimental test site with the objectives of validating the system of models and minimizing evacuation times. Keywords: signal setting design model, application, evacuation conditions.
1 Introduction This work is part of research project SICURO, carried out by the Laboratory for Transport Systems Analysis of Mediterranea University of Reggio Calabria (Italy). The general objective is risk reduction in urban areas in terms of exposure through the definition and implementation of evacuation procedures [1, 2]. The results concern the development of models, procedures and guidelines that support transport planning in evacuation conditions. Specific research lines defined in SICURO concern travel demand [3, 4], planning processes and guidelines [5, 6], paths of emergency vehicles [7, 8], pedestrian outflow from buildings [9], transport supply and demand-supply interaction. As regards the last research line, the specification and calibration of link and node models and an application of a dynamic traffic assignment model are reported in [10] and [11]; they present advancements concerning link and node models calibration through data observed during a real-world evacuation experiment. A selection of decision support systems is compared in [12], testing their response capabilities to help validate procedures in evacuation conditions. WIT Transactions on Information and Communication Technologies, Vol 43, ©2010 WIT Press www.witpress.com, ISSN 1743-3517 (on-line) doi:10.2495/RISK100381
PI-444 Risk Analysis VII More recently, a system of models and procedures, conceived according to a what-to approach, for signal setting design of road intersections with endogenous estimation of path flows has been proposed in [13]. In the sphere of the research line above described, this paper presents an application of the system of models and procedures proposed in [13]. The application has two main objectives: to validate the system of models through observations executed during a real-world evacuation experiment and through simulation results obtained by means of a what-if modelling approach; to verify the effectiveness of signal setting design on a road network in reducing evacuation times from an urban area. The paper is articulated in four sections. Section 2 presents a classification of signal setting design models. Section 3 describes the proposed system of models, focusing on the procedure of signal setting parameters generation. Section 4 illustrates the experimental evacuation test site, the defined scenarios and some results of the model application. The last section reports the final remarks.
2 Classification The signal setting problem considers at least one of the following design variables: green time on each access and cycle time durations, with exogenous stages; green time and schedule (initial instants of green times and green time on each access) and cycle time durations; offset between each couple of adjacent intersections. Signal setting design models may be classified according to two criteria [14]. The first concerns the signal setting strategies (or signal setting design parameters), which may be based on flows, with two main objectives o minimization of total delay; o maximization of capacity factor; arrival times. The second is connected to the intersections which may be: isolated, interacting along an arteria or on a network. Different combinations of design variables, signal setting strategies and intersections give rise to the classes of models presented in Table 1. In the sphere of network design problem [23–26], several studies are presented in literature on signal setting design by means of genetic algothims. Some papers report applications of genetic algorithms with no driver re-routing [27, 28], other papers include driver re-routing [29, 30]. Genetic algorithms are applied in order to optimize traffic signal and transit priority settings in [31].
3 Proposed system of models The proposed system of models for signal setting parameters design (design model) generates and simulates potential solutions in order to optimize an
WIT Transactions on Information and Communication Technologies, Vol 43, ©2010 WIT Press www.witpress.com, ISSN 1743-3517 (on-line)
PI-445
Risk Analysis VII
Table 1:
Intersections
Variables Green time
Isolated
Green time and schedule
Arteria
Offset
Network
Green time and offset
Signal setting design models. Signal setting strategies flows Max capacity factor
Min delay
Arrival times
Webster [16], SIGCAP[17], SIDRA [18], OSCADY [19]
SIGSET[15]
MOVA
SICCO [20] MAXBAND [21], MULTIBAND TRANSYT [22], SCOOT
------
---
As isolated intersections
OPAC, UTOPIA
(source: [14])
Design model c
y
d
Solution generator
Simulation
y*
sAT y
RT
Figure 1:
Inputs, parameters and outputs of the design model.
objective function. The design model is schematically presented in figure 1, in terms of elements which feed the model, inputs and parameters, and elements provided by the model, outputs. Inputs are related to the transport system and, in particular, travel demand (vector of demand flows, d), transport costs (vector of link costs on noncongested network, c, and vector of saturation flows on each access, sAT), an initial configuration of signal setting parametres (vector, y). Parameters are represented by the matrix of network topology, , and a vector of transport models paramaters, . Output is the configuration of the best signal setting parameters (vector of solutions at equilibrium, y*, that optimizes the objective function). Vector, y, is composed by three classes of design parameters: cycle duration (assuming that all intesections have a common cycle time or a sub-multiple) o common duration of basic cycle for all intersections; o sub-multiples of the basic cycle for each intersection; WIT Transactions on Information and Communication Technologies, Vol 43, ©2010 WIT Press www.witpress.com, ISSN 1743-3517 (on-line)
PI-446 Risk Analysis VII phases duration and timing (every couple of the following parameters for each access, assuming that amber time is exogenous) o red time; o green time in term of initial and final instant of green time; offsets o number of offsets (both absolute and related to each couple of intersections), which depends on the duration of the basic cycle. The solution procedure is devolopped with a genetic algorithm. A polulation of solutions is tested in each iteration. In the solution polulation the generic vector y is indicated with ys. The design procedure operates according to a multi-level structure gruped into two main interacting procedures: current vector of signal setting parameters, ys, is generated through a solution generator procedure; vectors ys are then simulated by means of a simulation procedure, which reproduces the response of the transportation system to the current configuration of signal setting parameters, in terms of origin-destination path flows and costs at equilibrium. The response of the transport system, for each solution ys, is sintetized in a global network indicator, RT, which represents the objective function to be optimized. Therefore, the solutions are compared and evaluated in terms of the values of the objective function. The solution generator procedure belongs to the category of genetic algorithms (figure 2).
NO
START
Stopping YES it? test
END
Generation Population_M Population_G
Population_M Mutation
% MUT
s ( population)varAND (not simulated) ff SIMULAZIONE
Population_C
ys
Simulation ff
RT,s
Crossover
% CRO
Population_R Reproduction Figure 2:
Structure of the solution generator procedure.
WIT Transactions on Information and Communication Technologies, Vol 43, ©2010 WIT Press www.witpress.com, ISSN 1743-3517 (on-line)
Risk Analysis VII
PI-447
The procedure starts with an initial set of solutions, grouped into a randomly generated population (population_G). Each solution, ys, feeds a simulation procedure for the estimation of total delay, RT,s. Afterwards, population evolves through three operators (or evolution functions), which are sequentially applied. Reproduction consists in selecting a sub-set of solutions from the population, the best should survive and create new offspring (population_R). Crossover selects genes from parent chromosomes and creates new offspring (population_C). Then, the mutation takes place and it changes randomly the new offspring, in order to prevent all solutions in the population falling into the local optimum of solved problems (population_M). Once a new set of solutions is generated, a stopping test evaluates whether a new iteration must be performed or not, according to some stopping criteria. The procedure ends with the identification of vector, y*, containing the configuration of signal setting parameters that minimizes the objective function, or the total delay of the vehicles on the network, RT.
4 Application An application has been executed on the experimental evacuation test site defined in SICURO, with the objectives to validate the design model, through observed data and results from a what-if modelling approach, and to minimize evacuation times operating on signal setting design of a network of intersections. 4.1 Experimental evacuation test site and scenarios definition The design model has been applied on the transport system of the central area of Melito di Porto Salvo, which is a town in the south of Italy. The municipality has an area of 35.30 km2, 10483 inhabitants and 2432 employees. An incident was reproduced in reality and it concerned an heavy vehicle with leaking hazardous goods inside the urban area during the morning period of an average working-day. As the potential disaster was announced, the evacuation took place in the surrounding area, where public offices (town hall, primary school…), residential and commercial activities were located, and the emergency vehicles started to rescue weak users (see [32–34]). Evacuation operations, executed according the municipal evacuation plan, were monitored and evaluated (see [35–37]). The road transport system was monitored during the evacuation through videocameras located along selected links and nodes and the application of the proposed system of models required the previous built-up of a network model (see [10–12]) and a travel demand model (see [38–40]). The latter allowed the estimation of origin-destination matrices related to evacuation demand and to travel demand in ordinary conditions. After the network built-up and travel demand flows estimation, a coordinated network of traffic signals on six selected intersections was introducted in order to regulate the vehicles access to the evacuation area (figure 3). Traffic signals, according to the geometry of the intersections, have signal plans with two stages. The design model has been applied considering two signal setting scenarios: WIT Transactions on Information and Communication Technologies, Vol 43, ©2010 WIT Press www.witpress.com, ISSN 1743-3517 (on-line)
PI-448 Risk Analysis VII
Figure 3:
Graph, evacuation area and location of traffic signals.
(current) scenario, where signal setting parameters were defined in order to reproduce the existing priority rules at the intersections (that are were all not-signalized); design scenario, where traffic signals operate with the configuration of signal setting parameters provided as output of the design model, y*.
4.2 Results The results obtained running the design model for the two signal setting scenarios are presented and discusses below in terms of a set of indicators belonging to three classes (see [10]): demand-supply interaction o global delay of vehicles on the network; o evacuation time; transport system evolution during evacuation o number of vehicles approaching the refuge area; link and node o temporal profiles of vehicular flows on each access of the intersection. The simulation model, devolopped in this work and used inside the design model, allowed to estimate a global delay of vehicles on the network of 52312 [vehic h] and an vacuation time of 33 [min] in the current scenario. In the design scenario, the estimated global delay was 18118 [veic h], with a reduction of 71% in relation to current scenario, and the estimated evacuation time was 25 [min], with a reduction of 24% (table 2). WIT Transactions on Information and Communication Technologies, Vol 43, © 2010 WIT Press www.witpress.com, ISSN 1743-3517 (on-line)
Risk Analysis VII
PI-449
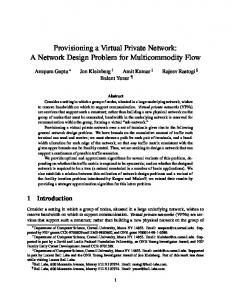
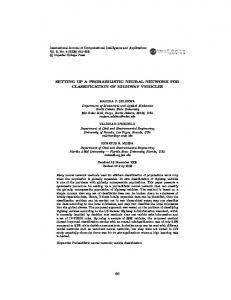
The number of vehicles approaching the refuge area on each five-minutes time slice for the two signal setting scenarios is plotted in figure 4. The plots show that, during the first ten minutes, a larger number of vehicles approached the refuge area in the current scenario than in the design one, due to lower waiting times at nodes. Afterwards, the increasing evacuation demand caused a decay of network performances in the current scenario, due to an increment of congestion levels. In the design scenario, signal settings parameters, optimized according to the increasing vehicular flows, allow to a larger number of vehicles to reach the refuge area, with a subsequent reduction of evacuation time. In order to show the potentialities of the simulation procedure, which incorporates a dynamic supply-demand interaction model, as an example, the estimated temporal profiles of vehicular flows at node 12 of the network (see figure 3) are plotted in figure 5. Table 2:
Signal setting scenarios: demand-supply interaction indicators. Indicators Global delay [vehic h] Evacuation time [min] 33 52312 25 18118 - 65% – 24%
Scenario Current Design
= (Xcurrent-Xdesign)/Xcurrent
90
current
80
design
70
[vehicle]
60 50 40 30 20 10 0 0
5
10
15
20
25
30
35
Time [min]
Figure 4:
Signal setting scenarios: number of vehicles approaching the refuge area.
WIT Transactions on Information and Communication Technologies, Vol 43, ©2010 WIT Press www.witpress.com, ISSN 1743-3517 (on-line)
PI-450 Risk Analysis VII The estimated variation of evacuation time between signal setting scenarios was compared with the one estimated between two network topology scenarios, previously defined in SICURO and simulated through a what-if model (see [10–12]). The two network topology scenarios are: current scenario, where the network topology was the one operating in ordinary condition, with intersections regulated through priority rules; design scenario where network topology was modified in order to prevent historical travel demand from crossing the evacuation area (see [12]). Evacuation time in the network topology design scenario is reduced of 14%. This reduced variation, compared to the one between signal setting scenarios, indicates that (design) interventions on signal setting parameters could be more effective than interventions on network topology in reducing evacuation time for this specific experimental evacuation test site.
5 Final remarks A system of models and procedures for signal setting design on a road network has been applied on a real experimental evacuation test site with the objectives to validate the modelling components and to minimize evacuation times. The simulations showed remarkable reductions in terms of total delay of vehicles on the network and of evacuation time in the signal setting design scenario, emphasized by the small dimensions of the network with few paths alternatives. The comparison with network topology scenarios indicates that interventions on signal setting parameters could be more effective than interventions on network topology for the examined experimental evacuation test site.
3000
[veic/h]
2500
0
50
100
150
200
250
300
[sec] Vehicular flow at stop line
Figure 5:
Exiting vehicular flow
Saturation flow
Signal setting scenarios: temporal profiles of vehicular flows at node 12 (see figure 3).
WIT Transactions on Information and Communication Technologies, Vol 43, ©2010 WIT Press www.witpress.com, ISSN 1743-3517 (on-line)
Risk Analysis VII
PI-451
Further research concerns the development of the system of models in order to allow an integrated design of signal setting and network topology parameters and the model validation through the definition of integrated design scenarios on a real test site in evacuation conditions.
References [1] Russo F. & Vitetta A., Risk evaluation in a transportation system. International Journal of Sustainable Development and Planning, 1 (2), pp. 170-191, 2006. [2] Russo F. & Vitetta A., Safety of users in road evacuation: General methodology and main results. Proc. of Urban Transport XIII, Urban Transport and the Environment in the 21st century, Brebbia C. A. (ed.), WIT Press, Southampton, pp. 763-772, 2007. [3] Russo F. & Chilà G., Dynamic approaches to demand model in evacuation conditions. Proc. of Urban Transport XVI, Urban Transport and the Environment in the 21st century, Brebbia C. A. (ed.), WIT Press, Southampton, pp. 303-312, 2010. [4] Russo F. & Chilà G., A sequential dynamic choice model to simulate demand in evacuation conditions. Proc. of Seventh International Conference on Computer Simulation in Risk Analysis and Hazard Mitigation, Brebbia C. A. (ed.), WIT Press, Southampton, 2010. [5] Russo F. & Rindone C., Evaluation methods for evacuation planning. Proc. of Urban Transport XVI, Urban Transport and the Environment in the 21st century, Brebbia C. A. (ed.), WIT Press, Southampton, pp. 335-343, 2010. [6] Russo F. & Rindone C., Data Envelopment Analysis (DEA) for evacuation planning. Proc. of Seventh International Conference on Computer Simulation in Risk Analysis and Hazard Mitigation, Brebbia C. A. (ed.), WIT Press, Southampton, 2010. [7] Polimeni A., Quattrone A. & Vitetta A., A tool for tracing emergency vehicles during evacuation, Proc. of Urban Transport XVI, Urban Transport and the Environment in the 21st century, Brebbia C. A. (ed.), WIT Press, Southampton, pp. 325-333, 2010. [8] Polimeni A., Quattrone A. & Vitetta A., An approach to design vehicle routes in evacuation conditions. Proc. of Seventh International Conference on Computer Simulation in Risk Analysis and Hazard Mitigation, Brebbia C. A. (ed.), WIT Press, Southampton, 2010. [9] Di Gangi M. & Velonà P., Safety of users in road evacuation: pedestrian out flow models in a building. Proc. of Urban Transport XIII, Urban Transport and the Environment in the 21st century, Brebbia C. A. (ed.), WIT Press, Southampton, pp. 803-812, 2007. [10] Vitetta A., Musolino G. & Marcianò F. A., Safety of users in road evacuation: Supply and demand-supply interaction models for users. Proc. of Urban Transport XIII, Urban Transport and the Environment in the 21st century, Brebbia C. A. (ed.), WIT Press, Southampton, pp. 783-792, 2007.
WIT Transactions on Information and Communication Technologies, Vol 43, ©2010 WIT Press www.witpress.com, ISSN 1743-3517 (on-line)
PI-452 Risk Analysis VII [11] Vitetta A., Musolino G. & Marcianò F. A., Safety of users in road evacuation: calibration of cost functions and simulation. Proc. of Urban Transport XIV, Urban Transport and the Environment in the 21st century, Brebbia C. A. (ed.), WIT Press, Southampton, pp. 715-725, 2008. [12] Vitetta A., Musolino G. & Marcianò F.A., Safety of users in road evacuation: Modelling and DSS for transport supply and supply-demand interaction. Proc. of Sustainable Development and Planning IV, vol.1, Brebbia C. A. (ed.), WIT Press, Southampton, pp. 475-484, 2009. [13] Marcianò F.A., Musolino G. &Vitetta A., A system of models for signal setting design of a signalized road network in evacuation conditions. Proc. of Urban Transport XVI, Urban Transport and the Environment in the 21st century, Brebbia C. A. (ed.), WIT Press, Southampton, pp. 313-323, 2010. [14] Cantarella G. E. & Vitetta A., La regolazione di intersezioni stradali semaforizzate: metodi ed applicazioni, FrancoAngeli, Milan, 2010. [15] Allsop R.E., SIGSET: A computer program for calculating traffic capacity of signal-controlled road junctions. Traffic Engineering & Control, 12, pp. 58-60, 1971. [16] Webster F.V., Traffic Signal Setting, Road Research Laboratory Technical Paper 39, London, UK, 1958. [17] Allsop R.E., SIGCAP: A computer program for assessing the traffic capacity of signal-controlled road junctions. Traffic Engineering & Control, 17, pp. 338-341, 1976. [18] Akcelik R. & Besley M., SIDRA user guide, Part 2, Input, ARRB Transport Research Ltd., Report No. WDTE91/012B, Victoria, Australia, 1992. [19] Burrow I.J., OSCADY: a computer program to model capacities, queues and delays at isolated tra.c signal junctions, TRRL Report, 105, Transport and Road Research Laboratory, Crowthorne, 1987. [20] Improta G. & Cantarella G.E., Control systems design for an individual signalised junction. Transportation Research 18B, pp. 147-167, 1984. [21] Little J.D.C., Kelson M.D. & Gartner N.H., MAXBAND: A program for setting signals on arteries and triangular networks. Transportation Research Record, 795, pp. 40-46, 1981. [22] Robertson D.I., ‘TRANSYT’ method for area traffic control. Traffic Engineering and Control, 10, pp. 276–81, 1969. [23] Cantarella G.E. & Vitetta, A., The multi-criteria road network design problem in an urban area. Transportation, 33 (6), pp. 567-588, 2006. [24] Russo F. & Vitetta A., An assignment model with modified Logit, which obviates enumeration and overlapping problems. Transportation, 30 (3), pp. 177-201, 2003. [25] Russo F. & Vitetta A., A topological method to choose optimal solutions after solving the multi-criteria urban road network design problem. Transportation, 33 (4), pp. 347-370, 2006. [26] Cantarella G.E. Pavone, G. & Vitetta A., Heuristics for urban road network design: Lane layout and signal settings. European Journal of Operational Research, 175 (3), pp. 1682-1695, 2006.
WIT Transactions on Information and Communication Technologies, Vol 43, ©2010 WIT Press www.witpress.com, ISSN 1743-3517 (on-line)
Risk Analysis VII
PI-453
[27] Foy M., Benekohal R.F. & Goldberg D.E., Signal timing determination using genetic algorithms. Transportation Research Record, 1365, pp. 108– 115, 1992. [28] Park B., Messer C. J. & Urbanik T., Enhanced genetic algorithm for signal timing optimization of oversaturated intersections. Transportation Research Record, 1727, pp. 32–41, 2000. [29] Ceylan H. & Bell M.G.H., Traffic signal timing optimization based on genetic algorithm approach, including drivers’ routing. Transportation Research, Part B, 38(4), pp. 329–342, 2004. [30] Teklu F., Sumalee A. & Watling D., A Genetic Algorithm Approach for Optimizing Traffic Control Signals Considering Routing. Computer-Aided Civil and Infrastructure Engineering, 22, pp. 31-43, 2007. [31] Stevanovic J., Stevanovic A., Martin P.T. & Bauer T., Stochastic optimization of traffic control and transit priority settings in VISSIM. Transportation Research, Part C, 16, pp. 332–349, 2008. [32] Vitetta A., Quattrone A. & Polimeni A., Safety of users in road evacuation: design of path choice models for emergency vehicles. Proc. of Urban Transport XIII, Urban Transport and the Environment in the 21st century, Brebbia C. A. (ed.), WIT Press, Southampton, pp. 803-812, 2007. [33] Vitetta A., Quattrone A. & Polimeni A., Safety of users in road evacuation: algorithms for path design of emergency vehicles, Proc. of Urban Transport XIV, Urban Transport and the Environment in the 21st century, Brebbia C. A. (ed.), WIT Press, Southampton, pp. 727-737, 2008. [34] Vitetta A., Quattrone A. & Polimeni A., Safety of users in road evacuation: Modelling and DSS for paths design of emergency vehicles. Proc. of Sustainable Development and Planning IV, vol.1, Brebbia C. A. (ed.), WIT Press, Southampton, pp. 485-495, 2009. [35] Russo F. & Rindone C., Safety of users in road evacuation: planning internal processes and guidelines. Proc. of Urban Transport XIII, Urban Transport and the Environment in the 21st century, Brebbia C. A. (ed.), WIT Press, Southampton, pp. 825-834, 2007. [36] Russo F. & Rindone C., Safety of users in road evacuation: the logical framework approach in evacuation planning. Proc. of Urban Transport XIV, Urban Transport and the Environment in the 21st century, Brebbia C. A. (ed.), WIT Press, Southampton, pp. 751-760, 2008. [37] Russo F. & Rindone C., Safety of users in road evacuation: Modelling and DSS for LFA in the planning process. Proc. of Sustainable Development and Planning IV, vol.1, Brebbia C. A. (ed.), WIT Press, Southampton, pp. 453-464, 2009. [38] Russo F. & Chilà G., Safety of users in road evacuation: demand models. Proc. of Urban Transport XIII, Urban Transport and the Environment in the 21st century, Brebbia C. A. (ed.), WIT Press, Southampton, pp. 773782, 2007. [39] Russo F. & Chilà G., Safety of users in road evacuation: RP vs. SP surveys in demand analysis. Proc. of Urban Transport XIV, Urban Transport and
WIT Transactions on Information and Communication Technologies, Vol 43, ©2010 WIT Press www.witpress.com, ISSN 1743-3517 (on-line)
PI-454 Risk Analysis VII the Environment in the 21st century, Brebbia C. A. (ed.), WIT Press, Southampton, pp. 703-713, 2008. [40] Russo F. & Chilà G., Safety of users in road evacuation: Modelling and DSS for demand. Proc. of Sustainable Development and Planning IV, vol.1, Brebbia C. A. (ed.), WIT Press, Southampton, pp. 465-474, 2009.
WIT Transactions on Information and Communication Technologies, Vol 43, ©2010 WIT Press www.witpress.com, ISSN 1743-3517 (on-line)