Significance Test for Feature Subset Selection on Image Recognition Qianren Xu1, M. Kamel1, and M.M.A. Salama2 1 Dept. of System Design Engineering, University of Waterloo, 200 University Avenue West, Waterloo, Ontario, N2L 3G1, Canada
[email protected],
[email protected] 2 Dept. of Electrical and Computer Engineering, University of Waterloo, 200 University Avenue West, Waterloo, Ontario, N2L 3G1, Canada
[email protected]
Abstract. This paper proposes a novel feature selection method based on significance test (ST). Statistical significant difference between (or among) classes, such as t statistic in Student test and F statistic in ANOVA, is utilized to measure pattern recognition ability of individual features. The feature significance level during a feature selecting procedure is used as feature selection criterion, which is determined by the product of the significant difference level and the independent coefficient of the candidate feature. An algorithm of maximum significant difference and independence (MSDI) and strategies of monotonically increasing curve (MIC) are proposed to sequentially rank the feature significance and determine the feature subset with minimum feature number and maximum recognition rate. Very good performances have been obtained when applying this method on handwritten digital recognition data. Keywords. Feature selection, maximum significant difference and independence (MSDI), significance test, t-test, ANOVA, correlation
1
Introduction
Feature selection is the process of determining relevant features from the original feature set for a pattern recognition problem. One way to select the optimal features from given initial feature subset is to exhaustively evaluate the recognition rate for all possible combinations of features. But, in the case of large number of features, such as some image recognition that may have hundreds of features, this exhaustive search strategy is impractical because of its time consuming. In order to avoid the exhaustive search, intermediate results or feature selection criteria have been introduced for this purpose. For instance, features can be selected based on the mutual information criterion [1], or by using fuzzy region analysis [2]. However, it has been showed that no non-exhaustive sequential feature selection procedure can be guaranteed to produce the optimal subset [3]. This paper proposes a new feature selection method of the non-exhaustive sequential selection type in order to obtain better pattern recognition performance. A. Campilho, M. Kamel (Eds.): ICIAR 2004, LNCS 3211, pp. 244–252, 2004. © Springer-Verlag Berlin Heidelberg 2004
Significance Test for Feature Subset Selection on Image Recognition
245
In the following section, the measurements related with the criteria of feature selection are presented in Section 2.1 and 2.2, and selection procedures based on the significance level of features are proposed in Section 2.3 and 2.4. Experimental results and a comparison with the mutual information feature selection method are discussed in Section 3.
2
Methodology
The significance test (ST) method for feature selection involves a sequential selection procedure of maximum significant difference and independence (MSDI). MSDI first selects the feature with the most significant difference between (or among) classes as the first feature, and then every new feature is selected by maximizing the product of individual pattern separability and independence coefficient between the candidate and already selected feature. After the procedure of MSDI, monotonically increasing curve strategy (MIC) can be used to delete useless features in the feature subset selected by MSDI. 2.1 Measurement of Pattern Separability on Individual Features The significance of difference between (or among) classes is used to estimate the ability of pattern recognition of a feature. Various statistical significance tests can be used to determine the level of significant difference. Significant Difference Between Two Classes It is straightforward that the significance of the difference (sd) between classes is in proportion to the difference of their means and in inverse proportion to the variance of their distribution,
sd =
difference between two classes . distributi on variance
(1)
Assuming data set has two classes x (1) and x ( 2) with the number m of features, and
x (1) and x ( 2) have n(1) and n( 2 ) instances respectively,
x (1)
x (1)11 x (1) 21 = # x (1) m1
x (1)12 x (1) 22 # x (1) m 2
x (1)1n(1) x ( 2)11 x " x (1) 2 n(1) ( 2 ) 21 , x ( 2) = % # # " x (1) mn(1) x ( 2) m1 "
x ( 2)12 x ( 2) 22 # x ( 2) m 2
x ( 2)1n( 2 ) " x ( 2) 2 n( 2 ) . % # " x ( 2) mn( 2 ) "
(2)
If the two classes are distributed normally, the significance of the difference between the two classes on feature i can be statistically estimated by the t statistic of the Student test [4]
246
Q. Xu, M. Kamel, and M.M.A. Salama
ti = | x(1) i − x( 2 )i |
s(21) i n(1) + s(22) i n( 2) , i = 1, 2, ... , m,
(3)
where s is the standard deviation used to measure the variance of the distribution
n s i = ∑ ( x ij − x i ) 2 (n − 1) , i = 1, 2, ... , m. j =1
(4)
Significant Difference Among More than Two Classes When there are more than two classes, the overall significant difference can be estimated by the variance among these classes and variance within classes, variance among classes . sd = (5) variance within classes We assume that there are c classes x (1) , x ( 2 ) , ..., x ( c ) with the number m of features. F statistic in ANOVA (analysis of variance) [4] can be used to measure the significant difference (5) for the all classes on feature i,
Fi = ms ai2 s wi2 , i = 1, 2, ... , m, where
(6)
sai and swi are the standard deviations used to measure the variance of the
distribution among classes and within classes respectively
c sai = ∑ ( x( k ) i − xi ) 2 (c − 1) , k =1
c m swi = ∑∑ ( x( k ) ij − x( k )i ) 2 c (m − 1) . k =1 j =1
(7)
2.2 Measurement of Independence Between (or Among) Features We define independence between features x u and x v as
ind uv = 1 − ruv2 ,
(8)
where ruv is the Pearson correlation coefficient [4], n n n ruv = ∑ ( xuj − xu )( xvj − xv ) ( xuj − xv ) 2 ∑ ( xuj − xv ) 2 . (9) ∑ j =1 j =1 j =1 The independence between multiple features x u1 , x u 2 , ... x up and x v can be estimated
by the independence between multiple regression x vˆ and x v
ind u1u 2...up⋅v
n = 1 − ∑ ( x vˆj − x vˆ )( x vj − x v ) j =1
2
n n 2 2 ∑ ( x vˆj − x vˆ ) ∑ ( x vj − x v ) , j =1 j =1
(10)
Significance Test for Feature Subset Selection on Image Recognition
247
where u1, u 2, ..., up represent the already-selected features xu1 , xu 2 , ..., xup ; xvˆ is the regression predicted feature ( xvˆ = a + b1 xu1 + b2 xu 2 + ... + b1 xup ); xv is the candidate feature. The independence above is estimated within class, and the overall independence on the all classes can be estimated by the mean of these independence levels.
ind uv =
1 c ∑ ind (k )uv . c k =1
(11)
2.3 Measurement of Feature Significance We defined the feature significance as the contribution of a candidate on improving pattern recognition when the candidate feature is added to feature subset. The measurement of feature significance can be reasonably estimated by the product of significant difference between (or among) classes and the independence level between the candidate feature and the already-selected feature(s),
sf = sd × ind .
(12)
The significant difference (sd) represents the pattern separability of individual features, which can be estimated by t statistic (t-test) or F statistic (ANOVA). The independence level ind ( 0 ≤ ind ≤ 1 ) can be viewed as the weight of feature significance in a specific procedure. When ind = 1 (the feature is totally not correlative with the already-selected features), the feature significance will be equal to the significance difference value ( sf = t or sf = F ). When ind = 0 (the feature can be obtained from the linear combination of the already-selected features), the feature significance will be set to 0 ( sf = 0 ), as this kind of feature is useless for improving pattern recognition even when its calculated significance of difference might be high. 2.4 Maximum Significant Difference and Independence Algorithm Maximum significant difference and independence (MSDI) is a forward stepwise procedure; it starts from the first feature with the most significant difference in the original feature set, and then adds the most significant feature at a time. The selection procedure of the MSDI algorithm is described as follows: 1) Compute the significant difference (sd) between (or among) classes on all original features; 2) Choose the first feature with the maximum sd
1st _ feature ⇐ max( sd ) ; 3)
(13)
Compute the independence (ind) between every candidate feature and the already-selected feature;
248
4)
Q. Xu, M. Kamel, and M.M.A. Salama
Compute the level of feature significance ( sf = sd × ind ) on every candidate feature, then select the feature with the maximum sf value as the second feature;
2nd _ feature ⇐ max( sf ) ; 5)
(14)
If the already-selected feature subset reaches the maximum number of features, terminate the procedure, otherwise go to step 3.
2.5 Monotonically Increasing Curve Strategy After the original features are ranked by MSDI, a performance curve can be drawn by the recognition rate vs the size of the feature subset. Generally, the curve tends to increase (in overall trend) at first, after reaching the maximum, and then it tends to decrease. The curve can be divided into two parts by the maximum point. Ideally, the curve monotonically increases in the first part and decreases in the second part. However, the selected feature subset (the first part of curve) usually still has a few “bad” or “not good” features, and the curve is not perfectly monotonic. In order to reach maximum pattern recognition rate with the minimum size of feature subset, we can delete the features that have “no good” contribution to the recognition performance, and make the curve monotonic. One strategy to make the curve monotonically increasing is to sequentially delete the “not good” features as follows: 1) Delete the leftmost feature that has “no good” contribution to the increasing of recognition rate, the index of the deleting feature (idl) is determined by
idl = min(id ), id ∈ { i | f (i ) ≤ f (i − 1)} ,
(15)
where i is the rank of feature significance in already-selected feature subset, id is the index set of “not good” feature, f(i) is the rate of recognition; 2) Plot the performance curve again with the new feature subset; 3) Repeat the procedure until the part of the curve before the maximum point is strictly monotonically increasing. Another more computationally effective is as follows: 1) Delete all of the features that has “no good” contribution to the increasing of recognition rate, the index set (id) of deleting features is determined by
i d ∈ { i | f (i ) ≤ f (i − 1)},
2) 3)
(16)
where i is the rank of feature significance in already-selected feature subset, f(i) is the rate of recognition; Plot the performance curve again with the new feature subset; Repeat the procedure until the part of curve before the maximum point is strictly monotonically increasing.
Significance Test for Feature Subset Selection on Image Recognition
3
249
Experimental Results
We have used the dataset of handwritten numeral recognition from UCI Machine Learning Repository (http://www.ics.uci.edu/~mlearn/MLRepository.html) It consists of 649 features on handwritten numerals (`0'--`9'). These 649 features distribute over the following feature sets: 76 Fourier coefficients of the character shapes, 216 profile correlations, 64 Karhunen-Love coefficients, 240 pixel averages in 2 x 3 windows, 47 Zernike moments, 6 morphological features. There are 200 patterns per class (for a total of 2,000 patterns) in the data set, and we randomly use half as training set and remaining data as testing set on every class. We used a probabilistic neural network (PNN) [5] as a classifier. 1
Rate of recognition
0.8
MSDI + MIC MSDI
0.6
MSD Random ranking 0.4
0.2 0
10
20
30
40
50
Number of features
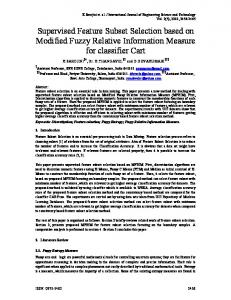
Fig. 1. The performance curve of pattern recognizing the handwritten numerals by maximizing significant difference (MSD), maximizing significant difference and independence (MSDI), and monotonically increasing curve (MIC) strategy
Fig. 1. shows the 50 relation between the rate of recognition and the number of features used. Only first features are plotted in the figure, and the performance of PNN for every number of features is on the optimal condition. We can see that the recognition performance of maximizing significant difference (MSD) is much better than that of random ranking, because MSD selected the feature subset with maximum individual pattern seperability. The performance of maximizing significant difference and independence (MSDI) is further improved comparing that of maximizing significant difference (MSD). MSDI considers both of the pattern separability of individual features and the correlation between the candidate feature and the already-selected features, which discards redundant features and thus reaches better rate of recognition with less number of features than MSD does. Fig. 1 also shows the results after the
250
Q. Xu, M. Kamel, and M.M.A. Salama
monotonically increasing curve (MIC) strategy is applied on the feature subset selected by MSDI, which makes the performance curve monotonic and obtains higher rate of recognition with less number of features than MSDI only. The mutual information (MI) feature selection method [1] is applied in the same data set for comparison, p
I v = I v ( yc ; xv ) − β × ∑ I v ( xu ; xv ) ,
(17)
u =1
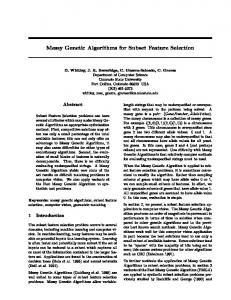
where β regulates the relative importance of the MI between the candidate feature and the already-selected features with respect to the MI between the feature and the output class. β is recommended between 0.5 and 1.0 [1]. However, by searching β between all range of 0 to 1, we find out that the optimal value is on β = 0.2 and the performance on β = 0.5 (within the range 0.5 to l.0) is only suboptimal. Fig. 2. shows that our MSDI is much better than MI in this handwritten numeral recognition problem on two aspects: a) MSDI (before the MIC procedure) obtains better recognition than MI does in the range of large feature number (feature number >5); b) MSDI is more computationally effective than MI method, one reason is that the MI need to search , which is time consuming since it involves classifier learning. 1
0.9
Rate of recognition
MSDI 0.8
MI (β=0.2) MI (β=0.5)
0.7
0.6
0.5
0.4
0
10
20
30
40
50
Number of features
Fig. 2. The performance curve of pattern recognizing the handwritten numeral by maximizing significant difference and independence (MSDI) and mutual information (MI)
We have also used another handwritten digital dataset also from UCI Machine Learning Repository. 32x32 bitmaps are divided into non-overlapping blocks of 4x4 size, the number of pixels is counted in each block in the range 0 to16, and it generates 8x8 matrix (that is 64 features). Training set in the database has 3823 patterns totally. We randomly use half of every class in the training set as actually training set
Significance Test for Feature Subset Selection on Image Recognition
251
1
0.9
Rate of recognition
MSDI MI (β=0.2) MI (β=0.4) MI (β=0.6)
0.8
0.7
MI (β=0.8) MI (β=1.0)
0.6
0.5
0.4
0
10
20
30
40
50
60
Number of features
Fig. 3. The performance curve of pattern recognizing the optical handwritten digits by maximizing significant difference and independence (MSDI) and mutual information (MI)
and remaining data as testing set. Fig. 3. shows that the curves are almost monotonic increase in all range of number of features, which means that almost all the feature positively contribute to pattern recognition. Although all features are “good” features, they have different significance to contribute on pattern recognition procedure. Fig. 3. also shows the results of MI at different β values, and the optimal β is between 0.1 ~ 0.2. The performance of MI at the optimal condition is close to that of MSDI on this example.
4
Conclusion
The paper shows that the significance test (ST) feature selection has very good performance in the image field (the handwritten digital recognition), and MSDI (even before the MIC procedure) can obtain better performance with more effective computation than MI. In fact, the ST can be applied to any supervised classification, and the significant difference can utilize different statistical model in accordance with the properties of the original data set.
References 1.
Battiti, R.: “Using mutual information for selecting features in supervised neural net learning,” IEEE Trans. Neural Network. vol 5, (1994) 537-550
252 2.
3. 4. 5.
Q. Xu, M. Kamel, and M.M.A. Salama Thawonmas, R., Abe, S.: “A novel approach to feature selection based on analysis of fuzzy regions,” IEEE Trans. Systems, Man, and Cybernetics Part B, vol 27, (1997) 196207 Cover, T.M., Van Campenhout, J.M.: “On the Possible Orderings in the Measurement Selection Problem,” IEEE Trans. Systems, Man, and Cybernetics, vol. 7, (1977) 657-661 Wonnacott, R.J., Wonnacott, T.H.: Introductory Statistics. 4th ed. John Wiley & Sons (1996) Wasserman, P.D.: Advanced Methods in Neural Computing, Van Nostrand Reinhold, New York (1993) 35-55