ous simulation model coupled with an optimization engine. ..... Hill Climb is a local search heuristic algorithm that changes a single element in each iteration ...
Proceedings of the 2013 Winter Simulation Conference R. Pasupathy, S.-H. Kim, A. Tolk, R. Hill, and M. E. Kuhl, eds
SIMULATION BASED OPTIMIZATION OF JOINT MAINTENANCE AND INVENTORY FOR MULTI-COMPONENTS MANUFACTURING SYSTEMS Abdullah Alrabghi Ashutosh Tiwari
Abdullah Alabdulkarim
Manufacturing and Materials Department Cranfield University Cranfield, UNITED KINGDOM
Mechanical Engineering Department Majmaah University Majmaah, SAUDI ARABIA
ABSTRACT Maintenance and spare parts management are interrelated and the literature shows the significance of optimizing them jointly. Simulation is an efficient tool in modeling such a complex and stochastic problem. In this paper, we optimize preventive maintenance and spare provision policy under continuous review in a non-identical multi-component manufacturing system through a combined discrete event and continuous simulation model coupled with an optimization engine. The study shows that production dynamics and labor availability have a significant impact on maintenance performance. Optimization results of Simulated Annealing, Hill Climb and Random solutions are compared. The experiments show that Simulated annealing achieved the best results although the computation time was relatively high. Investigating multi-objective optimization might provide interesting results as well as more flexibility to the decision maker. 1
INTRODUCTION
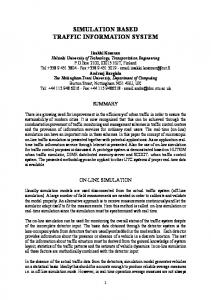
Maintenance plays a vital role in sustaining and improving asset availability, which in turn affects the total output production of the system. A large and growing body of literature has investigated the optimization of maintenance in manufacturing systems. Dekker (1996) conducted a comprehensive review of maintenance optimization models and applications. It is interesting to note that simulation optimization was not mentioned in his research, rather, the focus was on mathematical modeling only. As the complexity of maintenance systems has increased, the limitation of mathematical modeling became apparent as many maintenance policies are not analytically traceable (Garg and Deshmukh 2006, Nicolai and Dekker 2008). In a recent review, Sharma and Yadava (2011) discussed the published maintenance optimization models. They observed that the use of simulation has been an emerging trend which changed the maintenance view. This is mainly because simulation allows experimentation and better understanding of complex systems (Sebastian 2006). Simulation based optimization (Rogers 2002) is an approach that consists of two main elements: a simulation model and an optimization engine. As shown in Figure 1, the optimization engine provides the simulation model with the decision variables. The simulation runs and provides the optimization engine with the objective function. Depending on the optimization algorithm the optimization engine will conduct an analysis and provide the simulation model with a new set of variables seeking to improve the objective function. This cycle will continue until a condition is met. For example a specific number of evaluations without improvement in the objective function.
978-1-4799-2076-1/13/$31.00 ©2013 IEEE
1109
Alrabghi, Tiwari, and Alabdulkarim
Optimization objective
Variables Optimization engine
Simulation model
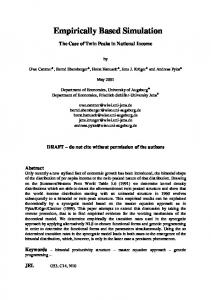
Figure 1: Simulation based optimization approach. Alrabghi and Tiwari (2013) systematically classified the published literature on simulation based optimization in maintenance. Their study highlight that the vast majority of researchers optimize maintenance assuming maintenance resources are readily available including spare parts. However, research has consistently shown the significance of optimizing maintenance and spare parts jointly. Kabir and Farrash (1996) optimized maintenance jointly and separately with spare parts. Their study shows that separate optimization of maintenance and spare parts policies do not lead to global minimum costs. Similarly, the work of Sarker and Haque (2000) and Bruzzone and Bocca (2012) confirm this finding. Van Horenbeek et al. (2012) review the literature on joint maintenance and optimization systems. Their study confirms the preference of simulation optimization to solve a problem with such a complex and stochastic nature. They observe that the research focus is on single-unit systems with few studies examining multi-components systems, usually assuming identical units. In addition, they suggest that simulation coupled with more sophisticated optimization techniques such as simulated annealing might decrease computational time and provide superior results. Figure 2 shows an overview classification of published literature and the focus of this research is illustrated by the shaded boxes. Maintenance optimization Mathematical modelling
Simulation
Without spare parts
With spare parts
Singlecomponent
Multicomponents
Figure 2: Classification of published literature and the focus of this research. Attempts to optimize maintenance and spare parts in multi-component systems through simulation optimization are shown in Table 1. Sarker and Haque (2000) examined a manufacturing system comprising of identical units and compared optimization results jointly with spare parts policies and separately. In fact, with the exception of Ilgin and Tunali (2007), all remaining studies assumed units to be identical and independent which does not reflect the complexity of real manufacturing systems. Similarly, it is apparent that studies assumed that maintenance technicians are always available. Discrete event simulation was expected to dominate as it is the most popular technique in modeling manufacturing systems (Jahangirian
1110
Alrabghi, Tiwari, and Alabdulkarim et al. 2010). Studies either used a single optimization algorithm (Chen, Hsu, and Chen 2006; Ilgin and Tunali 2007) or conducted design of experiments (Sarker and Haque 2000; Boulet, Gharbi, and Kenn 2009). Table 1 also shows how the present study complements the previous research by the inclusion of labor, modeling through combined discrete event and continuous simulation and examining three optimization algorithms. Table 1: Review of simulation based optimization of joint maintenance and spare parts in multicomponents systems. Paper (Sarker and Haque 2000) (Chen, Hsu, and Chen 2006) (Ilgin and Tunali 2007) (Boulet, Gharbi, and Kenn 2009)
Non-identical
Labor
Simulation technique
Optimization algorithm
No
No
Discrete event
Design of experiment
No
No
Discrete event
Scatter search
Yes
No
Discrete event
Genetic algorithms
No
No
Discrete event
Design of experiment
Current research
Yes
Yes
Combined discrete event and continuous
Simulated Annealing, Random Solutions and Hill Climb
The aim of this paper is to explore specific gaps observed in the previous literature by optimizing preventive maintenance and spare provision policy under continuous review in a non-identical multicomponent manufacturing system through a combined discrete event and continuous simulation model coupled with an optimization engine. Three optimization algorithms are compared and examined, namely, Simulated Annealing, Random Solutions and Hill Climb. 2
PROBLEM DEFINITION
Notations: Mcn SPn Sn Qn PMfreqn Labor
Machine n Spare part for machine n Reorder level for SPn Order quantity for SPn Preventive maintenance frequency for machine n Number of maintenance technicians
Preventive Maintenance (PM) costs less than Corrective Maintenance (CM) and requires considerably shorter periods. Unlike CM, PM is scheduled therefore it can be accommodated in both production and maintenance plans. The main question is how often a machine should be maintained (see Figure 3). Overmaintaining machines leads to unnecessary halts and costs. On the other hand, under-maintaining leads to unplanned breakdowns that results in chaos and expensive impacts.
1111
Alrabghi, Tiwari, and Alabdulkarim
Corrective maintenance
Preventive maintenance
Breakdown threshold
Breakdown threshold
degradation
degradation
PMfreqn
time
time
Figure 3: Comparison of CM and PM. In theory, the most effective solution is to schedule PM to be conducted just before a machine breaks down. In practice that is impossible partly because the machine degradation is a stochastic process. Other challenges include production dynamics in multi-component systems. While PM is planned through a fixed time frame, the machine degradation increases only when it is in use. However, the machine could become idle if there are not any parts to be processed as a result of another breakdown that occurred in the production line. The problem becomes more complex when considering spare parts and labor availability. Spare parts availability affect maintenance performance considerably. Shortage of spare parts increases machines unavailability. On the other hand, keeping a large inventory of spare parts might lead to unnecessary costs. One of the methods to control inventory is the continuous review spare provision policy includes (s, Q) where Q units are ordered each time the stock level reaches s. In this study, we investigate a non-identical multi-component manufacturing system with the aim of optimizing joint preventive maintenance and spare provision policy under continuous review (s, Q) through simulation based optimization, namely a combined discrete event and continuous simulation model coupled with an optimization engine. 3 3.1
SIMULATION MODEL Simulation Technique
A combined discrete event and continuous simulation model is developed using the available simulation package within the research group: Witness 12 manufacturing performance edition, which is a product of Lanner Group. Manufacturing systems are in general discrete event systems where the state of the system changes according to events (Sebastian 2006). Additionally, discrete event simulation has been successfully applied to model various types of manufacturing systems including maintenance systems (Jahangirian et al. 2010). Continuous simulation, on the other hand, is used to model systems that change continuously over time (Robinson 2007). This is particularly true for the machine degradation process where machines deteriorate continuously over time when in use. 3.2
Overview of the Manufacturing System
A model of a manufacturing system consisting of 6 non-identical machines is developed as illustrated in Figure 4. A buffer exists after the following machines: machine 1, machine 2, machine 3 and machine 4, and machine 5. Parts are pulled into the manufacturing system through machine 1 and machine 2 in parallel. The output of machine 1 is stored in a buffer until machine 3 becomes available. Similarly, the output of machine 2 is stored in a buffer until machine 4 becomes available. The output of both machine 3
1112
Alrabghi, Tiwari, and Alabdulkarim and machine 4 is stored in a buffer and is assembled in machine 5 when it becomes available. Finally, the output of machine 5 is stored in a buffer until machine 6 becomes available which then ships the final product out of the system.
Mc1
Mc3 Mc5
Mc2
Mc6
Mc4 Figure 4: Overview of the simulation model.
Failure patterns for machines are assumed to follow Weibull and Exponential, two of the most widely used distributions to model lifetime in reliability and maintenance engineering (Ben-Daya 2009). Cycle times follow Triangular distribution and vary between machines. Repair times for CM and PM tasks follow a Uniform distribution and vary between machines as well. All related distributions along with their parameters are shown in Table 2. Table 2: Cycle times, breakdown patterns and repair times for the manufacturing system. Machine
Cycle time
Breakdown pattern
CM duration
PM duration
Mc1 Mc2 Mc3 Mc4 Mc5 Mc6
Triangle(3, 6, 12) Triangle(4, 5, 11) Triangle (3,9,10) Triangle (5,9,10) Triangle (7,9,13) Triangle (5,10,14)
Weibull(2, 3) Weibull(4, 2) Weibull(2, 2.5) Weibull (3,1) NegExp (2.5) NegExp (3)
IUniform (1,3) IUniform (1.2,3.5) IUniform (1.7,2.3) IUniform (1.5,3) IUniform (0.7,2.5) IUniform (1,2.2)
IUniform (0.2,1) IUniform (0.8,2.5) IUniform (1,1.5) IUniform (1,1.5) IUniform (0.5,1.6) IUniform (0.4,1.8)
Spare provision policy is under continuous review and it includes (s, Q) where Q units are ordered each time the stock level reaches s. Lead times are stochastic and follow a uniform(72, 168) distribution. All machines are subject to CM when their degradation reaches a specific threshold. They are also subject to PM at predetermined intervals (PMfreqn). PM and CM cannot occur at the same time. If a machine is broken down, all PM activities will be postponed until the machine is fixed. On the other hand, if a machine is undergoing preventive maintenance it will not be working and thus its degradation level remains constant. Maintenance tasks are assumed to be perfect where the machine becomes as good as new after maintenance actions. In addition, machines are assumed to deteriorate only when in use. A typical machine degradation cycle is shown in Figure 5. The machine will degrade as long as it is in use. If there are not any parts to be processed due to the breakdown of a preceding machine or due to shortages of raw materials, the machine will become idle and hence its degradation level remains constant. If the degradation level reaches the breakdown threshold the machine will stop working instantly and it will be repaired as soon as there are available spare parts and labor. Repair time for CM is always longer than the repair time for PM as shown above in Table 2. On the other hand, PM is conducted periodically every Pmfreqn unit of time. Observing machine degradation in the simulation leads to the conclusion that production dynamics and labor availability have a significant impact on maintenance performance.
1113
Alrabghi, Tiwari, and Alabdulkarim Machine degradation
Breakdown threshold
Working
Idle
Working
Waiting for spare parts or labour
CM
Working
PM
Time
Figure 5: A typical machine degradation cycle. 3.3
Cost Formulation
Total Cost can be divided into three subcategories as follows: Total Cost= maintenance cost+ spare parts cost+ unavailability cost where Maintenance cost = PM cost + CM cost, and, Spare parts cost= order cost+ holding cost. Maintenance cost includes the cost of both preventive and corrective maintenance tasks and is incurred whenever these tasks are executed. The cost of spare parts includes the cost of ordering which is incurred whenever the inventory for SPn falls below the reorder level sn and the cost of holding which is incurred for every unit of time a spare part spends in the inventory. On the other hand, unavailability cost is incurred for every time unit a machine is not available due to maintenance tasks, shortage of spare parts or waiting for labor. The costs are constant during the simulation and are as follows:
Corrective maintenance = 2000/task, Preventive maintenance = 750/task, Holding cost = 2/unit/hour, order cost = 100/order, Unavailability penalty = 300/ unavailable machine hour.
Hours were considered to be the time units for the simulation. The model was run for 10 years = 87600 hours with a warm up period of 1 year = 8760 hours and 3 replications. 4 4.1
OPTIMIZATION PROBLEM Problem Formulation
A single objective optimization of both preventive maintenance and spare parts is formulated. The objective is minimizing the Total Cost as detailed in the previous section. 19 decision variables are defined for this problem as follows: 1