Simulation Studies on Transient Model for Biofilter operated in Periodic Mode B.V. Babu* and Smita Raghuvanshia Department of Chemical Engineering Birla Institute of Technology & Science Pilani 333031 (Rajasthan) India
Abstract Biofiltration of off-gases containing Volatile Organic Compounds (VOCs) is a reliable and cost effective technology for VOCs removal. Due to many inherent advantages, most of the industries operate biofilters under the periodic conditions (highly transient). Taking the importance of such operation into account, a model is developed based on the transient conditions. In this study, a Linear Driving Force (LDF) model is used, which takes into account both mechanisms (adsorption and biodegradation) involved in biofiltration process. The rate equation is given by the modified three-parameter Monod-type expression. The results obtained from the present model are validated with the experimental data and the results obtained from earlier model reported in the literature. The simulations are also carried out to understand the influence of various important parameters such as inlet VOCs concentrations, bed height and gas velocity on the biofiltration process operated in the periodic mode. Keywords: Biofiltration, Adsorption, Modeling, Periodic Operation, Three-Parameter Monod Kinetics, Transient Behavior
1. Introduction Biofiltration technology utilizes the microorganisms to biologically degrade Volatile Organic Compounds (VOCs) and odor contained in waste air streams [1, 2]. Biofiltration is a process that is the combination of all the basic mechanisms such as absorption, adsorption, and degradation and desorption of gas phase pollutants. Many investigators have developed mathematical models of biofilters and biotrickling filters in their efforts to understand and improve reactor performance. While there has been significant success among investigators in describing and understanding laboratory results, no single model has become of a standard that is generally accepted [3]. There have been various models ______________________________________________________________________________
* Corresponding Author: Assistant Dean - ESD & Head - Chemical Engineering Department, BITS, Pilani-333031, India. Email:
[email protected]; Phone:+91-1596-245073 Ext. 205/224; Fax : +91-1596-244183; Homepage: http://discovery.bits-pilani.ac.in/discipline/chemical/BVb/ a
Lecturer, Chemical Engineering Department, BITS, Pilani- 333031, India. Email:
[email protected]
1
reported in the literature describing the biofiltration. Ottengraf and Oever (1983) model is based on developments made from biodegradation of non-adsorbable substrates in submerged biofilms [4].
Zarook and Baltzis (1994a) have
developed a transient model for the biofiltration of a single VOC taking into consideration the effects of oxygen and interactive biodegradation kinetics [5]. Zarook et.al., (1997) observed that a general transient biofiltration model should incorporate dispersion, diffusion, reaction and adsorption phenomena [6]. In practical applications, most of the biofilters operate in highly transient condition, as VOC emission level in any plant is unlikely to be constant. However under transient conditions, adsorption process needs to be explicitly accounted for in the model development. The models often assume that the uncovered surface of the solid support, is biologically inert and remains in direct contact with the gas phase and adsorbs the pollutants. Therefore in the periodic mode of operation, adsorption becomes one of the important phenomenon that need to be addressed. Nomenclature: Ci odor concentration in gas phase, g/m3 DL dispersion coefficient, m2/s H bed height, m kig-ads overall mass transfer coefficient, 1/s Km saturation constant, g/m3 m2 partition coefficient of odor between gas and solid phase, dimensionless N power exponent qi solid phase concentration of contaminant in the biofilter, g/m3 * qi solid phase concentration of contaminant in the solid phase, g/m3 rs reaction rate, g/m3s t working time, s V volumetric flow rate, m3/s w gas velocity, m/s x distance, m porosity of the bed, m3/m3 rate constant of biofiltration process, 1/s Subscripts Ads adsorbent i component Superscript * equilibrium
2
So the objective of this research paper is to develop a model which incorporates the adsorption phenomenon as well as the biodegradation occurring in the biofiltration in the periodic mode of operation. In the present study, the pollutants considered are Methyl Ethyl Ketone (MEK) and Butanol. The model is validated using laboratory-scale experimental data presented in previous paper [7]. Model simulations are then used as a design tool for the calculation of design variables (e.g. degradation capacity, degradation efficiency) as a function of operating parameters (e.g. inlet pollutant load, residence time, length of the column). The present model deals with the three-parameter Monod type expression for the rate kinetics of biodegradation, which is found to be more suitable for transient behavior of biofilter. 2. Mathematical Model In this work, periodic operation of biofilter is considered. In periodic mode of operation, biofilm is less developed due to nutrient shortage. The Linear Driving Force (LDF) approach is being applied, which focuses on the adsorption phenomena to approximate the pollutant inter-phase transport. It has been seen that some of the specific parameters concerning with the biofilm are not well understood. The LDF model does not allow for the effect of varying pollutant concentration on the amount of microorganisms involved in the biodegradation and hence additionally affecting its rate. In the present work the kinetics for the biodegradation is expressed by the modified three-parameter Monod type expression. To formulate a generalized model, following assumptions are made: 1. The axially dispersed plug flow for the gas phase is assumed. 2. A linear driving force to approximate the pollutant interphase transport is assumed and it allows for the pollutant adsorption and biodegradation in the support or biotic phase using the first order kinetics with no oxygen limitation. Based on the above assumptions, mass balance equation for gas phase is given by Eq.1:
3
∂C ∂t
i =D L
∂ 2C
∂C i − w i − 1 − ε [k (q * − q )] = 0 ig − ads i i ε ∂x ∂x 2
(1)
with initial and boundary conditions (Eqns. 2-4)
Ci ( x,0) = 0
DL
∂C i ∂z
(
= − w Ci x=0
∂C
i ∂x
(2) 0−
− Ci
0+
)
(3)
=0
(4)
x =H
The mass balance for the solid phase is given by Eq.5:
∂q
i =k (q* − q ) − r ig − ads i i s ∂t
(5)
The initial condition to solve this equation is given by Eq.6:
qi ( x,0) = 0
(6)
The adsorption of the organic pollutants on the packing material is given by the linear isotherm by Eq.7:
C * q = i i m
(7)
2
As the biophase is not explicitly present in the model, this effect is taken into account by expressing the rate of biodegradation as given in Eq.8:
q
N
i r =µ s K +q m
(8)
i
3. Solution Algorithm The set of partial differential equations (Eqns. 1 & 5) along with their respective initial and boundary conditions (Eqns. 2, 3, 4, 6 & 7) and rate equation (Eqn. 8) are numerically solved by applying finite difference explicit method. Finite difference technique has been successfully applied to solve such type of partial
4
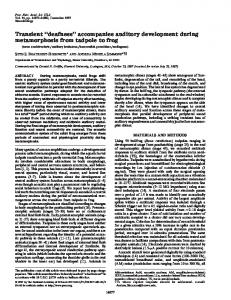
differential equations in other studies [8, 9,10,11,12]. An algorithm to solve these equations are developed and implemented into a computer program using MATLAB (v.6.1) software. The same parameters reported by Chmiel et al. (2005) are used for simulation of the present model [7]. 4. Results and Discussion A model is developed that described results in the form of breakthrough curves, which represents the outlet VOCs concentration at different times based on different operating conditions. 4.1. Comparison of model predictions with experimental data The performance of present model is carried out by comparing the results obtained with the experimental and modeling results given by Chmiel et al. (2005) in Fig. 1.
0.10
Outlet Concentration (C)
0.08 Present Model (@) Experimental Value (@) Chmiel et al. (2005)(@) Present Model ($) Experimental Value ($) Chmiel et al. (2005)($)
0.06
0.04
0.02
0.00 0
1000
2000
3000
4000
5000
6000
Time (s)
Fig. 1: Comparision between the present model, experimental value and model reported by Chimel et.al (2005) for MEK (@) and Butanol ($).
5
Same parameters given by Chmiel et al (2005) are used and some parameters (see Table-1) are assumed which were not given in the literature. The standard deviation for MEK is obtained as 0.00242 for the present model and 0.00414 for Chmiel et al (2005) model, which is less as compared to the model represented by Chmiel et al (2005). It is evident from the results obtained that the present model gives better results as compared to the reported model. Based on the good agreement of the proposed model predictions with the experimental results, simulations are carried out for a wide range of concentration for MEK (0.04 -0.1 g/m3) and butanol (0.02 – 0.05 g/m3), Table-1: Model parameters value for simulation
S.No.
Parameter
Butanol
MEK
1.
kig-ads (1/s)
0.001
0.003
2.
N (-)
1.5
1.35
3.
µ (g2-N/m3-Ns)
1.25X10⁻³
0.4 X10⁻³
4.
Km (g/m3)
0.555
0.025
5.
Dl (m2/s)(#)
5 X10⁻⁴
5 X10⁻⁴
6.
m2 (-)
4 X10⁻⁴
2 X10⁻³
7.
(-)
0.65
0.58
# The value is taken from Zarook et al., 1997 [6] as this value is not reported in Chmiel et al., 2005 [7]
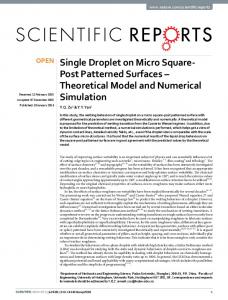
respectively. The simulations are also carried out to understand the influence of various important parameters such as inlet VOC concentration, bed height and residence time on the biofiltration process operated in the periodic mode. 4.2 Effect of Inlet Concentration The effect of the inlet concentrations of VOCs on the performance of biofilter in terms of breakthrough curves is shown in Fig. 2. The breakthrough curves are obtained for the inlet VOC concentrations ranging from 0.04 to 0.1g/m3 for MEK and 0.02 to 0.05g/m3 for butanol respectively. It is observed that as the inlet
6
VOCs concentration increases, the break point time decreases. For MEK, as the inlet concentration increases from 0.04 to 0.1 g/m3, the breakpoint time decreases from 90 to 15 sec. For butanol, as the inlet concentration increases from 0.02 to 0.05 g/m3, the breakpoint time decreases from 1400 to 1280 sec. These trends could be explained with the fact that at higher value of concentration, the driving force for mass transfer is higher which results in attaining the equilibrium faster. 3
Cin = 0.10 g/m (@)
0.10
3
Cin = 0.07 g/m (@) 3
Cin = 0.04 g/m (@)
Outlet Concentration (C), g/m
3
3
Cin = 0.05 g/m ($)
0.08
3
Cin = 0.035g/m ($) 3
Cin = 0.02 g/m ($) 0.06
0.04
0.02
0.00 0
1000
2000
3000
4000
5000
Time (s)
Fig. 2: Effect of inlet VOCs concentration on breakthrough curves for MEK (@) and Butanol ($)
4.3 Effect of Bed Height The effect of bed height on the effluent VOCs concentration is presented for bed height from 0.4 m to 0.6 m Fig. 3. It is observed that as the bed height increases from 0.4 m to 0.6 m, the values of breakpoint time for MEK and butanol increase from 9 to 18 sec and 940 to 1800 sec, respectively. Higher bed height corresponds to the large amount of packing material. This means more surface is available for adsorption and biodegradation of VOCs and hence the VOCs concentration at outlet of the column decreases for the larger bed heights.
7
H = 0.4 m(@) H = 0.5 m(@) H = 0.6 m(@) H = 0.4 m($) H = 0.5 m($) H = 0.6 m($)
Outlet Concentration (C), g/m
3
0.10
0.08
0.06
0.04
0.02
0.00 0
1000
2000
3000
4000
5000
Time (sec)
Fig. 3: Effect of bed height on breakthrough curves for MEK (@) and Butanol ($)
4.4 Effect of gas velocity The results for different gas velocities are plotted in Fig. 4. w = 0.04 m/s (@) w = 0.03 m/s (@) w = 0.02 m/s (@) w = 0.04 m/s ($) w = 0.03 m/s ($) w = 0.02 m/s ($)
Outlet Concentration (C)
0.10
0.08
0.06
0.04
0.02
0.00 0
1000
2000
3000
4000
5000
Time (s)
Fig. 4: Effect of gas velocity on breakthrough curves for MEK (@) and Butanol ($)
8
During these simulations, other parameters such as inlet VOCs concentration and bed height are kept constant. It is observed that as the gas velocity increases from 0.02 m to 0.04 m/s, the breakpoint times for MEK and butanol decrease from 43 to 10 sec and 2200 to 900 sec, respectively. This is because lesser residence time is available for the VOCs for undergoing adsorption or biodegradation. So equilibrium gets delayed at higher gas velocities. 5. Conclusions A model was developed for the biofilters operated in periodic mode and solved numerically by using Explicit Finite Difference Technique. The following conclusions were drawn from the obtained results: 1. The present model gives the better result as compared with the model reported in literature [7]. 2. It was observed that with increase in inlet VOC concentration, break point time is attained earlier. 3. The breakpoint time is achieved earlier with increase in bed height as more surface is available for the adsorption and biodegradation. 4. The breakpoint time decreases with increase in gas velocity. References [1]
[2]
[3] [4] [5]
B V Babu and Smita Raghuvanshi, "Biofiltration for VOC Removal: A Stateof-the-art Review", Proceedings of International Symposium & 57th Annual Session of IIChE in association with AIChE (CHEMCON-2004), Mumbai, December 27-30, 2004. Smita Raghuvanshi and B V Babu, "Modeling and Simulation of Trickle Bed Air Biofilter for Removal of VOCs", Proceedings of International Symposium & 58th Annual Session of IIChE in association with International Partners (CHEMCON-2005), New Delhi, December 14-17, 2005. Joseph S. Devinny and J. Ramesh, “A phenomenological review of biofilter models”, Chemical Engineering Journal, 113 (2005) 187-196. Ottengraf, S.P.P., vander Oever, A.H.C, “Kinetics of organic compound removal from waste gases with a biological filter”, Biotechnology and Bioengineering 25, (1983) 3089–3102. S.M. Zarook and B.C. Baltzis, “Biofiltration of toluene vapor under steadystate and transient conditions: theory and experimental results”, Chemical Engineering Science 49 (1994b) 4347.
9
[6]
S. M. Zarook, A. A. Shaikh and Z. Ansar, “Development, experimental validation and dynamic analysis of a general transient biofilter model”, Chemical Engineering Science 52 (1997) 759-773. [7] K. Chmiel, A. Konieczny, M. Palica and A.B Jarzebski, “Periodic Operation of biofilters concise model and experimental validation”, Chemical Engineering Science, 60 (2005) 2845-2850. [8] B V Babu and Ashish.S.Chaurasia, “Dominant Design Variables in Pyrolysis of Biomass Particles of Different Geometries in Thermally Thick Regime”, Chemical Engineering Science, 59 (2004) 611-622. [9] B V Babu and Ashish.S.Chaurasia, “Heat Transfer and Kinetics in the Pyrolysis of Shrinking Biomass Particle”, Chemical Engineering Science, 59 (2004d) 1999-2012. [10] B V Babu and Suresh Gupta, “Modeling and Simulation for Dynamics of Packed Bed Adsorption”, Proceedings of International Symposium & 57th Annual Session of IIChE in association with AIChE (CHEMCON-2004), Mumbai, December 27-30, (2004). [11] Smita Raghuvanshi and B.V.Babu, "Modeling and Simulation of Trickle Bed Air Biofilter for Removal of VOCs", Proceedings of International Symposium & 58th Annual Session of IIChE in association with International Partners (CHEMCON-2005), New Delhi, December 14-17, 2005. [12] Suresh Gupta and B.V.Babu, "Kinetic Modeling of Fixed Bed Adsorption Column", Proceedings of International Symposium & 58th Annual Session of IIChE in association with International Partners (CHEMCON-2005), New Delhi, December 14-17, 2005.
10
!
"
!
% &
#
'
#
) !&
"$
#
"
'
*. " # *1 '
#
% $ "
! &
!
#-
$
#
(
%
)
! #
"#
/ 5
4
" #
/
"
#
(
( "
9
: #(
*
#
!
"#
" .. ' "# *++0 ; ( 9
:
)
"
'
$
9 #
" ! #
-#
#
??9 9 9 $
$
:
"$
?@
?
$
A
$
..+
(
$
"
'
" " /
$
#
! 9
'
$ "
&
&
( =$
0
4
!$
"
7
$ .3+
#* 67
8
&
$
, 4
$
*++,$
*2 !
"
( ! &
)
"
!
*++,# !- % ! $
$
"
' 999$ :
" '
-
" $
B
4 #'
$
:
/ :
$
7 !
C " $
" &3
8 (
.+ ! !
6
' ' 7
9 9
6 !
8
"
! & %
8
$ $
B
# % /
/
"
*0
$ .D
/
%
$ 9
$
9
:
!
9 #
" -
9
** !
' 7 $
0
E( . &0 # * + + , $
B
9 (
% 9
8
' $
11
$ $ $
9
&* + + , F "
#
*+,
- %
.
)
! & G 9
$
12
$
0
#
" $