IEEE TRANSACTIONS ON AUDIO, SPEECH, AND LANGUAGE PROCESSING, VOL. 19, NO. 4, MAY 2011
961
Single-Channel Source Separation Using EMD-Subband Variable Regularized Sparse Features Bin Gao, W. L. Woo, and S. S. Dlay
Abstract—A novel approach to solve the single-channel source separation (SCSS) problem is presented. Most existing supervised SCSS methods resort exclusively to the independence waveform criteria as exemplified by training the prior information before the separation process. This poses a significant limiting factor to the applicability of these methods to real problem. Our proposed method does not require training knowledge for separating the mixture and it is based on decomposing the mixture into a series of oscillatory components termed as the intrinsic mode functions (IMFs). We show, in this paper, that the IMFs have several desirable properties unique to SCSS problem and how these properties can be advantaged to relax the constraints posed by the problem. In addition, we have derived a novel sparse non-negative matrix factorization to estimate the spectral bases and temporal codes of the sources. The proposed algorithm is a more complete and efficient approach to matrix factorization where a generalized criterion for variable sparseness is imposed onto the solution. Experimental testing has been conducted to show that the proposed method gives superior performance over other existing approaches. Index Terms—Audio processing, blind source separation (BSS), empirical mode decomposition (EMD), non-negative matrix factorization (NMF), single-channel source separation (SCSS), sparse features.
I. INTRODUCTION LIND source separation (BSS) using independent component analysis (ICA) has been ubiquitously used in many applications with great success. Linear blind decomposition has been well learned so far and a plethora of methods have been proposed. Most methods are based on higher order statistics which require non-Gaussian source signals [1]. Extension of BSS for solving nonlinear mixtures has also been introduced [2]–[4]. In addition, these methods yield good performances only if the number of observed signals is equal or more than the number of independent sources. However, in general and for many practical applications (e.g., speech and image processing) only one-channel recording is available. In such cases, conventional source separation techniques are not appropriate. This leads to the single-channel source separation (SCSS) where the
problem can be treated as one observed signal mixed with several unknown sources. In this paper, we focus on two sources as described in the following: (1) denotes time index. The goal is to estiwhere and when only the observed mate the two sources is available. This is an underdetermined equation signal problem [2]. In recent times, new advances have been achieved in SCSS and this can be categorized either as supervised or unsupervised SCSS methods. The terms “supervised” and “unsupervised” refer to the separation system with and without using the training information of the sources, respectively. For supervised SCSS methods, this category predominantly includes the model-based SCSS methods [5]–[8] which are similar to the model-based speech enhancement techniques. Commonly, the model-based SCSS method exploits the hidden Markov models (HMMs) of the audio signals and at the heart of these techniques is the approximation of the posby Gaussian distribution [8]. Here terior represent the time–frequency (TF) domain of , , and , respectively. Using the Bayes theorem, the posterior distribution can be expressed as
B
Manuscript received April 29, 2010; revised July 14, 2010; accepted August 02, 2010. Date of publication September 13, 2010; date of current version March 30, 2011. The associate editor coordinating the review of this manuscript and approving it for publication was Prof. Vesa Välimäki. The authors are with the School of Electrical, Electronic and Computer Engineering, Newcastle University, Newcastle upon Tyne NE1 7RU, U.K. (e-mail:
[email protected];
[email protected];
[email protected]). Color versions of one or more of the figures in this paper are available online at http://ieeexplore.ieee.org. Digital Object Identifier 10.1109/TASL.2010.2072500
(2) and denotes the where hidden states of sources. The sources are trained and modeled by the mixture of Gaussians. Good separation requires detailed source models that might use thousands of full spectral states. However, these model-based techniques consume long time not only for training the prior parameters but also presenting many difficult challenges during the inference stages. There are other model-based SCSS methods that do not use HMM, for example [11] and [32]. A related technique to supervised SCSS is the underdetermined-ICA SCSS method [9]–[11]. In this method, the sources are modeled as sparse combination of a set of time-domain basis functions which are initially derived using the ICA methods. With these ICA basis functions, the sources are estimated by maximizing the log-likelihood function of the observed mixed signal. This method renders optimal separation only if the ICA basis functions corresponding to each source have minimal time-domain overlap. Mixture of two speech sources is such a case where the derived basis functions have significant overlap with each other.
1558-7916/$26.00 © 2010 IEEE
962
IEEE TRANSACTIONS ON AUDIO, SPEECH, AND LANGUAGE PROCESSING, VOL. 19, NO. 4, MAY 2011
For unsupervised SCSS methods, this category predominantly includes the CASA-based SCSS techniques [12]–[16] whose goal is to replicate the process of human auditory system by using signal processing approaches (e.g., notes in music recordings) and grouping them into auditory streams using psycho-acoustical cues. The main idea is based on exploiting an appropriate transform such as the short-time Fourier transform (STFT) where the observed mixture is segmented into TF cells which are then used to characterize note objects by harmonicity, common onset, correlated modulation and duration of sinusoidal partials, and finally to build note streams based on pitch proximity [16]–[18]. Nevertheless, computational auditory scene analysis (CASA)-based SCSS techniques cannot efficiently segregate instruments playing in the different pitch range into different streams. They also cannot replicate the entire process performed in the auditory system since the process beyond the auditory nerve is not well studied. In addition, it is difficult to group the sources if one of them is assumed to be fully voiced. A different direction to unsupervised SCSS has been proposed recently that bypasses the above limitations. The non-negative matrix factorization (NMF) methods [19], [20] have been developed for separating drums from polyphonic music [21]. In addition, it has also been used for automatic transcription of polyphonic music [22]. Families of parameterized NMF cost functions such as the Beta divergence [23], and Csiszar’s divergence [24] have been presented for the separation of audio sources [25]. Regardless of the cost function used, in order to achieve audio source separation, some methods require grouping of the basis functions according to the sources or instruments. Different grouping methods have been proposed in [26], but in practice, if the sources overlap in TF domain, it is difficult to obtain the correct clustering. This issue is discussed in [27]. Other problem where conventional NMF methods fail is when two notes are played simultaneously in which case they will be modeled as one component [28]. In addition, most of the above techniques work only for music separation and have crucial limitations that explicitly use some prior knowledge about the sources [29], [30]. As a consequence, those methods are able to deal only with a very specific set of sources and situations. Finally, the empirical mode decomposition (EMD) has recently gained reputation as a method for analyzing nonlinear and nonstationary time series data. By combining with other data analysis tools, the EMD has been used to separate the audio sources from a single mixture [31]. Molla and Hirose [31] proposed a subspace decomposition-based method using the EMD and Hilbert spectrum (HS). The performance of the EMD-based SCSS techniques rely too heavily on the derived independent basis vectors which are only stationary over time. Therefore, good separation results can be obtained only if basis vectors are statistical independent within the processing window. For some sources, e.g., male and female speeches, the features can be very similar and, hence, it becomes difficult to obtain the independent basis vectors. In this paper, a new framework for SCSS based on the EMD and a novel variable regularized two-dimensional sparse non-negative matrix factorization (v-SNMF2D) is proposed. The proposed solution separates audio sources from a single channel without relying on training information about the
original sources. Audio signals are mostly nonstationary and the EMD decomposes the mixed signal into a collection of oscillatory basis components termed as intrinsic mode functions (IMFs) which contain the basic properties of the original source (e.g., amplitude and frequency). In the proposed scheme, instead of processing the mixed signal directly, the IMFs are utilized as the new set of observations. The impetus behind this is that the degree of mixing of the sources in the IMF domain is now less ambiguous and thus, the dominating source in the mixture is more easily detected. Moreover, the spectral and temporal patterns (i.e., the spectral bases and temporal codes, respectively) associated with each IMF are now simpler and sparser than that of the mixed signal. As such, these patterns can be extracted using a suitably designed sparse algorithm. To this end, we propose a new algorithm based on the two-dimensional sparse non-negative matrix factorization (SNMF2D). However, contrary to conventional SNMF2D, our proposed technique assigns a regularization parameter to each temporal code, which is individually optimized and adaptively tuned to yield the optimal sparse factorization. We term this new algorithm as variable regularized two-dimensional sparse non-negative matrix factorization (v-SNMF2D). The proposed variable regularization benefits conventional SNMF2D in terms of improved accuracy in resolving spectral bases and temporal codes which were previously not possible by using SNMF2D alone. This benefit has been extended to SCSS by merging the proposed v-SNMF2D with EMD. This paper is organized as follows. Section II introduces the background of EMD and the SNMF2D algorithm. In Section III, the new v-SNMF2D model is derived and the proposed source separation framework is fully developed. Experimental results coupled with a series of performance comparison with other SCSS techniques are presented in Section IV. Finally, Section V concludes the paper. II. BACKGROUND A. Empirical Mode Decomposition EMD is a signal processing tool for decomposing any nonstationary signal into oscillating components by empirically identifying the physical time scales intrinsic to the data. These oscillating components are termed as the IMFs. For in-depth information on EMD, interested readers are referred to [33]. In principle, the IMFs satisfy two fundamental conditions: Firstly, in the whole dataset, the number of extrema (minima and maxima) and the number of zero crossing must be same or differ at most by one. Second, the mean value of envelop defined by the local minima is always zero. The first condition is obvious; it is similar to the traditional narrowband requirements for a stationary Gaussian process. The second condition is a relatively new idea for nonstationary data; it modifies the classical global requirement to a local one. The steps to decompose arbitrary data series into IMF components can be found in [34]. At the end of decomposition, the mixed signal can be represented simply as (3)
GAO et al.: SCSS USING EMD-SUBBAND VARIABLE REGULARIZED SPARSE FEATURES
963
when an instrument plays different notes. In audio source separation, the model represents each instrument compactly by a single time–frequency profile convolved in both time and frequency by a time–pitch weight matrix. This model dramatically decreases the number of components needed to model various instruments and effectively solves the SCSS problem. The two basic cost functions with sparse penalty term on are given in the following: Least square (5) Kullback-Leibler (6)
for
where
and
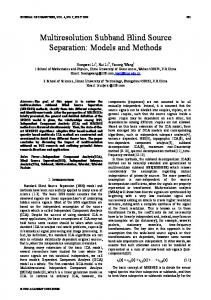
Fig. 1. EMD of male–female speech mixture showing the first six (out of ten) IMFs.
and itive derivative such as
where
. Here denotes downward shift which moves each element in the matrix down by rows, and
is the th IMF, is the total number of IMFs, and is the final residue. Fig. 1 shows the EMD of a signal mixture [panel (a)] generated from a male and a female speech. The IMFs [panels (b)–(g)] are similar to the bandlimited functions for representing the time series data. Therefore, the EMD is suitable for analyzing nonstationary data and can be considered as a dyadic filterbank with each narrowband contains most energy of one dominating source. Also, the frequency of IMFs decreases as the order increases, e.g., the sixth IMF contains lower frequency components of the mixture than that of the fifth IMFs. B. Sparse Non-Negative Matrix Factorization Non-negative matrix factorization (NMF) [20] is a method for factorizing a matrix into a product of two non-negative matrices. The sources can be modeled by factorizing the power spectrogram using the NMF and each instrument is modeled by an instantaneous frequency signature which can vary over time. Thus, the model can represent components with temporal structure. In the source separation task, the TF representation of mixture can be decomposed as (4)
is a power spectrogram data matrix of the where mixture, and , , and represent total frequency bins and time slots in the TF domain, respectively. no benefit is achieved at all. Thus, If is chosen to be so that the original dataset the idea is to determine can be compressed and reduced to its integral components such as is a matrix containing a set of spectral basis vectors, is an encoding matrix that describes the amplitude of and each basis vector at each time point. The recently developed the two-dimensional sparse NMF factorization (SNMF2D) model [28] extends the NMF model to be a sparse two-dimensional convolution of and . The factorization is based on a model that represents temporal structure and pitch change which occur
can be any function with posgiven by
denotes right shift which moves each element in the maand matrices can be trix to the right by columns. The derived using the above cost functions (5) and (6). The parameter in both equations is important as it controls the sparsity of the factorization. If it is uncontrolled, the solution rendered by (5) or (6) will lead to either “under-sparse” or “over-sparse” factorization which still contains the mixed components in each estimated source. In this paper, we derive an efficient algorithm to estimate the regularization parameters that yield the optimal sparse factorization. III. PROPOSED SEPARATION METHOD In this section, we will establish the foundation of how EMD and matrix factorization from Section II can be unified within the context of SCSS. Three benefits will be obtained from this merger. In SCSS, the audio mixtures of two sources in the time , where domain can be modeled as The EMD decomposes the audio mixture signal into a collection of IMFs as follows: (7) These IMFs which are derived from the data can serve as the basis of expansion, which can be linear or nonlinear as dictated by the data. In addition, it is complete and almost orthogonal. Thus, the extracted IMFs are real-valued signals [33] that contain the basic properties of the original source. From the filtering point of view, the EMD process can be considered as a dynamic filterbank where the bandwidths are ranged automatically and dependent on the input signal. This is unlike the conventional filterbank which has fixed bandwidths that are independent of the input signal. Given the nature of this dynamic filterbank, the first benefit EMD brings to SCSS is as follows: for each
964
IEEE TRANSACTIONS ON AUDIO, SPEECH, AND LANGUAGE PROCESSING, VOL. 19, NO. 4, MAY 2011
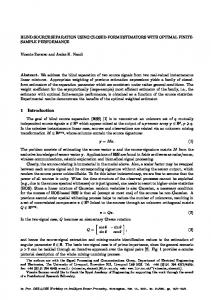
Fig. 2. (a) and (b) denote the spectrogram of male and female speeches, respectively. (c) denotes the spectrogram of mixed speech (male + female). (d)–(f) denote the spectrogram of the first three IMFs decomposed by EMD.
TABLE I DOMINATE PROPORTION OF EACH SOURCE TO EACH IMF
IMF of the mixed signal, the degree of mixing from the original sources is considerably reduced in that particular sub-band of to measure frequencies. To validate this finding, we define the dominating factor of the th original source on the th IMF as follows:
(8)
In this analysis, a mixture of male and female speeches is used. The domination factor of each source to each , the more IMF is tabulated in Table I. The higher value of contribution from the th source is to the th IMF. From Table I, or which it is observed that the value is high on either indicates that the mixing at the IMF levels is dominated either by source 1 or source 2, respectively. In this example, it is clear
that source 1 dominates in the first and fifth–seventh IMFs while source 2 dominates in the second–fourth IMFs. The second benefit EMD brings to SCSS is that since each IMF corresponds to a filtered signal bounded within a particular range of sub-band frequencies, the complexity of the spectral and temporal patterns associated with each IMF will be simpler and sparser than that of the mixed signal. The degree of sparsity depends on the sources and the order of the IMF. Not only that, we also found that the sparsity varies across all the IMF order. This is shown in Fig. 2. This effectively means that in the TF domain of each IMF there is a relatively clear distinction of the spectral and temporal patterns between the dominating source and the less dominating one. As a result, lesser number of components is used in the NMF and yet able to maintain a robust source separation performance. This will be elaborated in Section IV-D. In addition, the sparseness of the IMF suits the proposed v-SNMF2D method since it enables the user to correctly select the model order for and in (15)]. Finally, the the convolutive factors [ third benefit is since all IMFs are almost orthogonal, the statistical contents in each IMF are relatively decoupled from each other. Therefore, each IMF can be treated independently; when any error is resulted from the processing, this will be confined to that particular IMF only. At the source reconstruction stage, this error will be averaged over all the IMFs; thus the contribution of this error to the reconstructed source will be minimized. In Fig. 2, it is shown that the spectral and temporal patterns’ complexity associated with each IMF (d)–(f) is simpler and sparser than the mixed speech (c). During the decomposition, the maximum IMF order is determined by assessing
GAO et al.: SCSS USING EMD-SUBBAND VARIABLE REGULARIZED SPARSE FEATURES
whether the th IMF is of acceptable quality as judged by its relative to the mixture’s power power . In this paper, a threshold has been set at 5% of the mixture’s power. For example, if the th IMF power is less than a pre-specified threshold of mixture signal, this particular IMF will be rejected. By using this threshold approach, we are able to consistently select the most significant IMFs. For simplicity, we assume is the maximum order and therefore, the mixture signal can be modeled as (9) In vector form, (9) can be written as (10) where
,
with
and is a vector consist of components of unit scalar. Similarly, the original sources can be decomposed using the EMD as
965
where for each component as row and column vector represents the time slots and frequency bins, respectively. Hence, (13) becomes
(14) where is the residual noise. Equation (14) is a synthesis is generated as a equation since it describes how , , and . Note that all elements mixing of and are non-negative whereas the elein could be both positive and negative. However, the ments in overall sum in (14) is always nonnegative and therefore, we may construct an analysis equation in a form of matrix factorization. There exists a family of non-negative matrix factorization algorithms. In this paper, we derive a new factorization algorithm termed as the variable regularized two-dimensional sparse non-negative matrix factorization (v-SNMF2D) which is given as follows:
(11)
Analysis
and which contains and number of IMFs, respectively. We define and as the and , respectively. The aim is to sub-sources of , assign each of estimate these sub-sources given only them to the correct source class and finally reconstruct the estimated sources in the time domain.
subject to
and where
(15) A. Matrix Representation of Time–Frequency IMFs To estimate the sub-sources, from (10) is projected into the TF domain, in which the mixed signal becomes for
(12)
, , and denote TF comwhere ponents which are obtained by applying the STFT, e.g., for , and . In practice, the frequency axis of the spectrogram for audio signals is logarithmically scaled and this convention has been adopted in the paper. The power spectrogram is defined as the squared magnitude of (12)
(13) measures the projection of onto [8]. For large sample size, we may assume and are orthogonal and, hence, . However, for finite sample size, may not as the hold and we treat residual noise. Note that in (13) each component is a function of and variables. As such, we seek a matrix representation where
It is worth pointing out that each individual element in is constrained to a Laplacian distribution with independent decay parameter . In (15), is the th column of . is the th row of
,
denotes downward shift which moves
denotes each element in the matrix down by rows, and right shift which moves each element in the matrix to the right by columns. The terms , , and are the maximum number of columns in , shifts, shifts and time represents frame, respectively. In terms of interpretation, the spectral basis of the th IMF of th source in the spectrorepresents the temporal sparse code for gram domain and each spectral basis element. In our proposed algorithm, the two and in the matrices we seek to separate are synthesis equation. This estimation corresponds to the case of in the analysis equation. The proposed v-SNMF2D method gives significantly better performance than traditional NMF methods. These are summarized as follows. First, the NMF [35] can be considered as a . As such, the special case with convolutive factors NMF is a weak model since it does not take into account the relative position of each spectrum thereby discarding the temporal information. Second, the NMF does not model notes but rather unique events only. Thus, if two notes are always played
966
IEEE TRANSACTIONS ON AUDIO, SPEECH, AND LANGUAGE PROCESSING, VOL. 19, NO. 4, MAY 2011
simultaneously they will be modeled as one component. Also, some components might not correspond to notes but rather to the model, e.g., background noise. Third, the structure of a factor can be input into the signature of the same factor in in and vice versa. Hence, this leads to ambiguity that can be through imposing only resolved by forcing the structure on . This leads to the sparse NMF (SNMF) sparseness on and its extension to SNMF2D. However, the main drawback of SNMF (and SNMF2D as well) originates from its lack of a generalized criterion for sparsity. Fourth, the v-SNMF2D model allows overcomplete representation by allowing many shifts which are not inherent in the NMF model. In this situation, imposing sparseness is necessary to give unique and realistic representations of the non-stationary audio signals. Finally, the is imposed element-wise in the v-SNMF2D sparseness on is optimally sparse in model so that each individual code in the -norm. In the conventional SNMF or SNMF2D method, the sparseness is not fully controlled but is imposed uniformly on all the codes. The ensuing consequence is that the temporal codes are no longer optimal and this results in “under-sparse” or “over-sparse” factorization.
negative log likelihood serves as the least square (LS) cost function which is defined as
(18) forms the -norm regularization to The sparsity term onto . resolve the ambiguity by forcing all structure in Therefore, the sparseness of the solution in (18) is highly dependent on the regularization parameter . 1) Estimation of the Spectral Basis and Temporal Code: In the matrix factorization, each spectral basis is constrained to be of unit length. Hence, we represent this by
, where
is factor-wise normalized to . The derivatives of (18) corresponding to and of v-SNMF2D are given by
B. Formulation of the Proposed Variable Regularization SNMF2D (v-SNMF2D) To facilitate such spectral bases with variable sparse coding, , , and we first define , and then choose a prior distribution over the factors in the analysis equation. The posterior can be found by computing the maximum a posteriori (MAP) estimate
(19)
(20) (16) where the denominator is constant and therefore, the log-posterior can be expressed as
is assumed equal to 1. Thus, by applying the standard where gradient decent approach, we have
(21) (17) We assume the noise to be independently and identically distributed with Gaussian distribution having variance . Thus, the likelihood of the factors and can be written1 as where denotes the Frobenius norm. The second term consists of the prior distribution of and where they are jointly independent. Each element of is constrained to be Laplacian distributed with independent decay parameters, namely, so . The prior over is flat that with each column constrained to have unit length. Hence, the 1To
avoid cluttering the notation, we shall remove the upper limits from the summation terms. The upper limits can be inferred from (15).
where and are positive learning rates which can be obtained by following the approach of Lee and Seung [20], and namely, . Thus, in matrix notation, the multiplicative learning rules become (22)
(23)
GAO et al.: SCSS USING EMD-SUBBAND VARIABLE REGULARIZED SPARSE FEATURES
In (22), “ ” is the element wise product, and at each iteration, the column vectors will be factor-wise normalized to unit length. of 2) Estimation of the Variable Regularization Parameter: Since
are obtained directly from the original sparse code
matrix
, it suffices to compute just for the regularization
967
One can easily check that the distribution that maximizes the right-hand side of (27) is given by which is the posterior distribution of . In this paper, we represent the posterior distribution in the form of Gibbs distribution where
parameters associated with . Therefore, we can set the cost as function in (18) with
(28) The functional form of the Gibbs distribution in (28) is exand this is crucial as it will enable pressed in terms of [40]. The maxus to simplify the variational optimization of is given by imum-likelihood estimation of (29) as the dependent variable while The Gibbs distribution treats assuming all other parameters to be constant. As such, analytically solving (29) leads to
(24) where representing the column vectorization, ‘ ’ is the Kronecker product, is the identity matrix. Define the following terms: .. .
.. .
.. .
.. .
.. .
(30)
where is the th element of . Despite the simple form of (30), the integral is difficult to compute analytically and there. We note that the fore, we seek an approximation to naturally partition its elements into distinct subsets solution and consisting of components such that , and components such that . can be decomposed as Hence, (31)
.. .
(25)
.. . Thus, the (24) can be rewritten in terms of
for
is on the boundary of the distribution, we need Since to consider the effects of non-negativity constraints. This distribution is represented by using Taylor expansion about the MAP , which is the mode of the distribution estimate
as (26)
are vectors of dimension , where . To determine , we use an expectation–maximization (EM) algorithm and treat as the hidden variable where the log-likelihood function can be optimized with respect to . Using the Jensen’s inequality, it can be shown that for any distribution , the log-likelihood function satisfies the following: Note that
and
(32) where , is the sub-matrix of that corresponds to . We use variational approximation to by using the exponential distribution (33)
(27)
968
IEEE TRANSACTIONS ON AUDIO, SPEECH, AND LANGUAGE PROCESSING, VOL. 19, NO. 4, MAY 2011
The variational parameters for are obtained by minimizing the Kullback–Leibler divergence between and (34)
their corresponding probability mass function. They are then grouped into clusters according to the entropy contained by individual vectors. In this paper, the symmetric KLd is used to measure the relative entropy between two probability mass and over a random variable : function
which leads to (35) and . The optimization of (35) can be accomplished by using the non-negative quadratic programming method [36] or Gaussian–Newton multiplicative updates , since none of the non-negative [37]. As for components as unconconstraints are active, we approximate . Thus, using the factorized strained Gaussian with mean approximation in (30), we obtain the following: where
if if for
and computed from (22).
(36)
is the th element of sparse code
C. Estimation of Sub-Sources The
th order sub-sources
are estimated as
and and
. In the default setting, is the th column of that corresponds to the th , where for the case of two sources. row of If more components are considered in the v-SNMF2D, e.g., , this necessitates an efficient to their clustering method to group the column vectors respective sources. The details of the clustering method will be presented in Section IV-D. Once The sub-sources and are estimated, the time-domain sub-sources can be reconstructed as follows: Resynthesize
(37)
where “Resynthesize” denotes the inverse mapping of the logfrequency axis to the original frequency axis and followed by the inverse STFT back to the time domain [35]. The mask is determined element wise by if otherwise. (38) The estimated sub-sources in (37) are subsequently clustered into groups according to the number of sources. The Kullback–Leibler divergence (KLd)-based -means clustering algorithm [31] is used for grouping the subsets of the sub-sources. The sub-sources are firstly represented as vectors which are then normalized to unit length and transformed into
(39) After convergence, all sub-sources will be grouped into their respective clusters which are given as and . The estimated time-domain signal of the th source is then obtained by summing up the sub-sources from each cluster as and (40) The core procedure of the proposed method is summarized in Fig. 3. Given the single-channel mixture , the goal is to estibased on the following steps. 1) mate the sources using (3); EMD decomposes the audio mixture signal into a collection of IMFs. 2) using (22), (23), and (36); for each IMF, construct TF representation and then apply the v-SNMF2D method to update spectral bases and temporal code . 3) using can (37)–(39); after calculating the mask, the sub-sources be reconstructed by using inverse STFT. Hence, the KLd-based -means clustering technique is employed to group sub-sources using (40); the estimated into two clusters. 4) time-domain of th source is finally obtained by summing up the sub-sources from each cluster. Table II presents the main steps of the proposed v-SNMF2D. and corresponding to the matrix representation of (36). IV. RESULTS AND ANALYSIS The proposed monaural source separation method is tested by separating audio sources. Several experimental simulations under different conditions have been designed to investigate the efficacy of the proposed method. All simulations and analyses are performed using a PC with Intel Core 2 CPU 6600 @ 2.4 GHz and 2 GB RAM. MATLAB is used as the programming platform. To generate mixtures, 40 sentences of the target speakers (20 male and 20 female sentences from 8 male and 8 female subjects) are selected from the TIMIT speech database and 20 music signals including 10 Jazz and 10 piano signals are selected from the RWC [38] database. Three types of mixture have been generated: 1) Jazz mixed with piano, 2) speech mixed with music, and 3) speech mixed with speech. The sources are randomly chosen from the database and the mixed signal is generated by adding the chosen sources. In all cases, the sources are mixed with equal average power over the duration of the signals. All mixed signals are sampled at 16 kHz sampling rate and the audio mixture is divided into blocks of length 0.65 s. Smaller-size blocks perform better when the signal spectra are frequently changing. The TF representation is
GAO et al.: SCSS USING EMD-SUBBAND VARIABLE REGULARIZED SPARSE FEATURES
969
Fig. 3. Core procedure of the proposed algorithm.
The ISNR is used as the quantitative performance measure for separation, and the average ISNR will be tabulated in the evaluation graphs. The ISNR represents the degree of suppression of the interfering signals to improve the quality of the target one. The higher value of ISNR indicates better separation performance.
TABLE II PROPOSED V-SNMF2D ALGORITHM
A. Effects on Audio Mixtures Separation With/Without EMD Preprocessing
computed by normalizing the time-domain signal to unit power and computing the STFT using 1024–point Hanning window FFT with 50% overlap. The frequency axis of the obtained spectrogram is then logarithmically scaled and grouped into 175 frequency bins in the range of 50 Hz to 8 kHz with 24 bins per octave. This corresponds to twice the resolution of the equal tempered musical scale. For the v-SNMF2D parameters, the convolutive components in time and frequency are selected and , respectively. The to be corresponding sparse factor was determined by (36). The distortion measure between the original and estimated source is computed by using the improvement of signal-to-noise ratio (ISNR) [31] which is defined as
(41)
In this section, we first investigate the performance of our proposed method without using the EMD preprocessing for separating audio mixtures. This is motivated by the fact that in the IMF subband domain, the spectral and temporal patterns of each IMF are simpler and sparser than that of the mixed signal. Therefore, the spectral and temporal patterns of the dominating source and the less dominating one can be separated by using the matrix factorization methods (i.e., SNMF2D or v-SNMF2D). In addition, any error resulted in the IMF subband during the source separation can be alleviated at the source reconstruction stage. Thus, it is hypothesized that with the EMD preprocessing, the audio source separation will be significantly enhanced. Figs. 4 and 5 show the performance of our proposed method without and with the EMD preprocessing, respectively, under various audio mixtures. Fig. 4 shows that without the EMD preprocessing, the ISNR is degraded substantially since the mixing ambiguity has been highly affected by the level of and (TF representation of spectral overlap between and , respectively). This is evidenced in Fig. 5 which illustrates the mixture of original male and female speeches (top panels), the single channel mixed signal (middle panel), and the separated speeches (bottom panels) using the v-SNMF2D without the EMD preprocessing. The ISNR for the separated speeches, on average, is calculated to be 2.7 dB per source. The ambiguity between the two speeches is highlighted in the red box marked area. Fig. 8(d) and (e) further illustrate this observation on the TF plane by means of another mixture of male speech and Jazz music. By visual inspection, a considerable level of spectral overlap has not been correctly separated. On the other hand, Fig. 5 shows a large improvement gain in ISNR by incorporating the EMD preprocessing. An average improvement of 2.5 dB per source has been obtained across all the different type of mixtures by using the v-SNMF2D with EMD preprocessing as compared to using the v-SNMF2D alone. Similarly, an average improvement of 2 dB per source is obtained for the
970
IEEE TRANSACTIONS ON AUDIO, SPEECH, AND LANGUAGE PROCESSING, VOL. 19, NO. 4, MAY 2011
Fig. 4. Overall separation results of different mixtures without EMD preprocessing.
Fig. 7. (a) Estimated sub-sources for male speech. (b) Reconstructed male speech and error. (c) Estimated sub-sources for female speech. (d) Reconstructed female speech and error. Fig. 5. Overall separation results of different types of mixtures with EMD preprocessing. TABLE III ASSIGNMENT OF REGULARIZATION PARAMETER
B. Impact of Sparsity Selection Fig. 6. Separation results without applying EMD preprocess.
SNMF2D with EMD preprocessing as compared to using the SNMF2D alone. In the following, we show the results of the v-SNMF2D with EMD preprocessing. Figs. 6 and 7 show the time-domain separation results. In both figures, subplot (a) shows the estimated sub-sources by exploiting the hybrid EMD and v-SNMF2D while subplot (b) shows the reconstructed speech signals and the error between the original and the reconstructed signals based on the four estimated sub-sources. The mean square error (MSE) between the original and the reconstructed speech is 0.34 and 0.32 for male speech and female speech, respectively. We also found that as the number of estimated sub-sources increases (e.g., 6), the error becomes progressively and 0.28 for male and female speeches, smaller (MSE respectively).
In this section, the impact of sparsity selection is investigated. as well as each of the scalar regularization paChoosing , will have significant impact on the rameter in matrix factorization and the final separation results. Our proposed algorithm resolves this difficulty by using the EMD to reduce the mixing ambiguity in each sub-band. In addition, since the sparsity of each IMF on the TF plane varies across different that impacts each IMF order, the sparseness constraint of IMF ought to be optimally controlled. Table III shows the value of the sparse regularization parameter that corresponds to each represent IMFs of different mixtures. In Table III, Jazz, piano music, male, and female speech. For mixture of piano and speech, the regularization parameters can be set similarly to the ones used for jazz and speech mixture. Table III shows that as the IMF order increases, lower values can be assigned to for each type of mixture. This is evidenced from the fact that the EMD can automatically range the bandwidths so that in each sub-band only one source with the
GAO et al.: SCSS USING EMD-SUBBAND VARIABLE REGULARIZED SPARSE FEATURES
971
Fig. 9. Separation results of EMD-SNMF2D by using different uniform regularization.
Fig. 8. (a) and (b) denote the original spectrogram of male speech and Jazz music, respectively. (c) denotes the spectrogram of the mixture. (d)–(h), (i) denote the reconstructed spectrogram of male speech and Jazz music by directly using the SNMF2D method (without EMD), EMD SNMF2D method, and EMD v-SNMF2D method, respectively.
most energy is retained. This allows the selection of the sparse. It is also found that different types of audio ness in each mixtures require different selection of the sparseness regularization. Using the mixture of music and speech as an example, it is well documented that music pitches jumped discretely while can be set to zero from the sixth speech pitches do not so that IMF onwards since these correspond to the lower frequency bands and are dominated with most energy from the speech components. In the lower frequency bands, very little mixing exists between the music and speech signal so that imposing sparseness will lead to over-sparse code and eventually render less efficiency in estimating the speech signal components. On the contrary, it is difficult to set equal to zero for mixture of male and female speeches since the fundamental pitches of both signals are too similar for the SNMF2D to separate. It should be noted that the above regularization parameters are set empirically and by no means, are the optimal values. Our proposed method resolves this issue by adaptively updating these sparse regularization parameters while the spectral bases and the temporal codes are still being learned. To study the effects of sparsity regularization on the separation results, Fig. 8 shows the spectrograms computed using the EMD SNMF2D and EMD v-SNMF2D. In Fig. 8, it is noted that errors still present in the estimated male speech spectrogram by using the SNMF2D and the EMD SNMF2D methods. The components in the red box marked region in (d) and (f) definitely belong to the Jazz music but have been attributed to the male speech instead. As a result, the estimated male speech contains interference from the Jazz music whereas the estimated Jazz music loses some of its information. Because of the “under- or over-sparse” resolution, the estimates are only coarse by using the EMD with SNMF2D. Consequently, this leads to ambiguity in the TF region which reduces the separation efficiency. On the other hand, the performance has been significantly improved when
Fig. 10. Separation results of EMD-based SNMF2D using regularization schemes.
the decomposition of spectral bases and temporal codes are performed using the variable sparse regularization. We note that the level of mixing ambiguity has been progressively reduced from using the SNMF2D without EMD preprocessing to the proposed v-SNMF2D with EMD preprocessing. Fig. 9 shows the impact of sparsity regularization on the separation results in terms of the ISNR under different uniform regularization. In this implementation, the uniform regularization is for all IMF, i.e., chosen as Fig. 10 summarizes the average separation results of the EMD-NMF2D, EMD-SNMF2D, selective uniform regularization EMD-SNMF2D based on Table III and EMD v-SNMF2D methods. For comparison purpose, we have summarized the average performance improvement of our proposed method based on Fig. 10 as follows: 1) for mixture of music signals, the average improvement is 1.4 dB per source, 2) for mixture of speech and music signal, the average improvement is 1.6 dB per source, and 3) for mixture of speech signals, the average improvement is 1.7 dB per source. The above results clearly indicate that the best performance is achieved by the EMD preprocessing with v-SNMF2D. C. Comparison With Other SCSS Methods 1) Underdetermined-Based ICA SCSS Method: In the underdetermined-ICA SCSS method [11], [32], the key point is to exploit the prior knowledge of the sources such as the basis functions to generate the sparse codes. In this work, these basis functions are obtained in two stages: 1) Training stage: the basis functions are obtained by performing ICA on each concatenated
972
IEEE TRANSACTIONS ON AUDIO, SPEECH, AND LANGUAGE PROCESSING, VOL. 19, NO. 4, MAY 2011
Fig. 12. Overall results between the proposed method, underdetermined-ICA, and Hilbert SCSS methods.
Fig. 11. (a)–(c) denote the original male, female speeches and mixture, respectively. (d) and (e) denote the recovered male and female speeches by using the underdetermined-ICA SCSS method. (f) and (g) denote the recovered male and female speeches by using the Hilbert SCSS method.
sources. In our experiments, we derive a set of 64 basis functions for each type of source.2 For example, to generate the ICA speech basis functions, ten male and ten female speeches from TIMIT speech database are used. Similarly, to generate the ICA music basis functions, five Jazz and five piano signals from RWC database are used. These training data exclude the target sources which have been exclusively used to generate the mixture signals. 2) Adaptation stage: the obtained ICA basis functions from the training stage are further adapted based on the current estimated sources during the separation process. At this stage, both the estimated sources and the ICA basis functions are jointly optimized by maximizing the log-likelihood of the current mixture signal until it converges to the steady-state solution. 2) Hilbert Subspace Decomposition SCSS (Hilbert SCSS) Method: The method of [31] performs source separation without training information by decomposing the Hilbert spectrum of the mixed signal into independent source subspaces. Once a set of independent basis vectors is obtained by means of PCA and ICA, the KLd-based -means clustering algorithm is utilized for grouping purpose and the Hilbert spectrum of individual source is constructed by each group subset. The time-domain estimated sources are calculated from the Hilbert spectrum of each of the extracted signals. 3) Comparison Results: Fig. 11 shows the separated male and female speeches based on the above two SCSS methods. Fig. 12 shows the comparison results between the proposed method and the above two SCSS methods in terms of the ISNR. In the case of the underdetermined-ICA SCSS method, we note that the recovered sources have not been clearly separated and the mixing ambiguity region is still large when compared with the original speeches in Fig. 11 (top panels). Our proposed method has yielded considerable improvement over the underdetermined-ICA SCSS method and this is summarized as follows: 1) for mixture of music signals, our proposed method results in an average improvement of 2.3 dB per source, 2) for 2Here the types of source signals are the male speech, female speech, Jazz, and piano music.
mixture of speech and music signal, an average improvement of 2.9 dB per source, and 3) for mixture of speech signals, an average improvement of 4.1 dB per source. The performance of the underdetermined-ICA SCSS method relies on the ICA-derived time domain basis functions. Fig. 12 indicates that high level performance is achieved only when the basis functions of each source are sufficiently distinct. The result becomes considerably less robust in separating mixture where the original sources are of the same type, e.g., mixture of speeches [31]. Speech basis functions learned from the ICA exhibit waveforms that resemble Gabor wavelets; however, the set of basis functions from the male speech has high degree of correlation with that of the female speech. Therefore, these two sets of basis functions overlap significantly with each other. Hence, this method is less efficient in resolving the mixing ambiguity in portions of the speech mixture where the basis functions for the male and female are very similar. In Fig. 12, “U-ICA SCSS” and “H-SCSS” denote the Underdetermined-ICA SCSS and Hilbert SCSS methods, respectively. The decomposition obtained by the Hilbert SCSS method shows that this technique leads to better separation results than the underdetermined-ICA SCSS method. However, we note that the separated speeches still contain high level of mixing ambiguity and, therefore, it degrades the separation performance. This is evidenced in Fig. 12 which shows the comparison of our method with the Hilbert SCSS method: 1) for mixture of music signals, the average improvement is 2.4 dB per source, 2) for mixture of speech and music signal, the average improvement is 2.5 dB per source, and 3) for mixture of speech signals, the average improvement is 3.2 dB per source. The performance of the Hilbert SCSS method relies too heavily on the derived frequency independent basis vectors which are stationary over time. Therefore, good separation results can be obtained only if the basis vectors are statistical independent within the processing window. The distinctiveness of the corresponding amplitude weighting vectors is also highly dependent on the independence of the basis vectors. Thus, if the frequency features are too similar, it becomes difficult to obtain the independent basis vectors by using the ICA. This explains the reason Fig. 12 shows a relatively poorer performance when separating mixture that contains speech sources. Comparing with the Hilbert SCSS method, our proposed v-SNMF2D yields an optimally sparse part-based decomposition that is unique under certain conditions e.g., sparse and nonnegative component, making it unnecessary to impose constraints in the form of statistical independence between the sources. Furthermore, the spectral bases
GAO et al.: SCSS USING EMD-SUBBAND VARIABLE REGULARIZED SPARSE FEATURES
973
and sparse code in our proposed method are derived separately at each individual IMF. Thus, these spectral bases and temporal codes are nonstationary over time leading to more robust separation results compared with the stationary basis vectors obtained from the Hilbert SCSS method. D. Comparison With NMF-Based SCSS Methods In this evaluation, the following NMF-based unsupervised SCSS methods are used for comparison. • NMF with Temporal Continuity and Sparseness Criteria [26] (NMF-TCS) is based on factorizing the magnitude spectrogram of the mixed signal into a sum of components, which include the temporal continuity and sparseness criteria into the separation framework. • SNMF2D (as described in Section II). • Automatic Relevance Determination NMF (NMF-ARD) [39] exploits a hierarchical Bayesian framework SNMF that amounts to imposing an exponential prior for pruning and thereby enables estimation of the NMF model order. The NMF-ARD assumes prior on , namely, . The prior model in the v-SNMF2D can be converted to the ARD and summing all prior model by setting the column elements, i.e., and . Hence, the NMF-ARD method is somewhat a special case of our proposed v-SNMF2D. Currently, there is no reliable NMF method for automatic estimation of the number of components and normally, this has to be set manually. As discussed in Section III, each IMF is separated into a number of components that corresponds exactly to the number of sources. However, in this implementation, more components than the number of sources are used for evaluating the efficiency of our proposed method. In order to obtain the baseline comparison of each method, all NMF algorithms are tested comby factorizing the mixture signal into ponents. In the case of NMF-ARD, the threshold has been modified such that it accepts all the initialized components. Since more than two components are used and the tested methods are blind, there is no information to tell which component belongs to which source. Thus, we utilize the clustering method proposed in [26], where the original sources are used as reference to create component clusters for each source. However, a large may not necessarily pronumber of components, i.e., duce better results since more sub-sources need to be classified. If the recovered sub-sources are incorrectly clustered, then these sub-sources will become interference to the supposedly correct estimated source. We have carried out additional analysis to compare the KLd-based -means clustering method [31] with the supervised clustering method in [26]. Our finding shows that if the sub-sources are too sparse, both methods will introduce errors during the clustering process. For example, beyond the seventh stage decomposition by the EMD, the TF sub-sources are too sparse to assign them to the correct sources. If wrongly clustered, this particular sub-source will become interference to the intended source. To mitigate this situation, we have set a power threshold as described in Section III to judge whether the IMF is of acceptable quality. Our findings have shown that
Fig. 13. Average ISNR using different number of components.
the results based on KLd -means clustering method are identical to the supervised clustering method in [26] except in special circumstances where the sub-sources are overly too sparse in the TF domain. Fig. 13 shows the ISNR performance between the proposed method and the NMF-TCS, SNM2D and NMF-ARD methods under different mixture types, and the in2,4,6,8,10. creasing number of components from The ISNR improvement of our method compared with NMF-TCS, SNMF2D and NMF-ARD can be summarized as follows: 1) for mixture of music signals, the average improvement is 3.3 dB per source, 2) for mixture of speech and music signal, the average improvement is 2.6 dB per source, and 3) for mixture of speech signals, the average improvement is 2.3 dB per source. Analyzing the separation results, NMF-ARD performs with poorer results whereas the separation performance by NMF-TCS is comparable with the SNMF2D. The common feature among these three methods is that they do not incorporate the preprocessing step that benefits the nonnegative matrix factorization. This renders the performance less efficient especially in terms of separating mixture that contains speech sources. The result indicates that without the EMD preprocessing, it becomes difficult to obtain the unique spectral especially when the spectral overlapping between the basis sources in TF domain is large since each column in may contain the combination spectral information of both sources. In this case, by directly using NMF methods, the separation of sources is no longer efficient. E. Proposed Method as De-Noising Algorithm The primary aim of this paper is to develop effective signal processing method to separate mixed signal into the original sources. These sources represent the signals that contain information that the end user wishes to extract. However, the proposed method can be used as a de-noising tool on recordings whereby one source is the informative signal while the other source is the unwanted signal such as noise. In this setting, the testing speech or music signal is normalized to unit power (i.e., is the normalized speech or music in (1)) and corrupted by unwanted signal such as white noise, multi-talker babble, is one of these unwanted signals) street or car noise (i.e., taken from the AURORA database [41]. The input SNR ranges
974
IEEE TRANSACTIONS ON AUDIO, SPEECH, AND LANGUAGE PROCESSING, VOL. 19, NO. 4, MAY 2011
Fig. 15. Example of de-noising results (female speech corrupted by white noise with 25-dB input SNR) using the proposed method, EMD-MMSE, and Spectral Subtraction (SS).
Fig. 14. De-noising results using the proposed method, EMD-MMSE, and Spectral Subtraction (SS) methods.
from 0 to 30 dB and the de-noised result is measured in terms of the output SNR [42]. We have compared the de-noising results using our proposed method with EMD-MMSE method [43] and spectral subtraction method [44]. Fig. 14 shows the comparison of all the results. Fig. 14 indicates that the proposed method can be applied to a wide range of SNR values. The speech and music are the target signals to be denoised. In the case of low input SNR (from 0 to 20 dB), good improvements in terms of output SNR have been obtained. On the other hand, for the case of high input SNR (from 20 to 30 dB) the output SNR has been maintained at a relatively high level which indicates that the signal’s information is still retained in the denoised signal. This shows the noise adaptability of the proposed method. From the figure, the average performance improvement of our method compared with the EMD-MMSE and SS methods are as follows: 1) For speech source, across all input SNR levels, the average percentage of output SNR improvement is 30% for babble noise, 39.2% for car noise, 39.7% for street noise and 9.6% for white noise. 2) For music source, the average percentage of output SNR improvement is 27.8% for babble noise, 36.9% for car noise, 37.4% for street noise and 8.1% for white noise. Fig. 15 shows the spectrograms of the original female speech, speech corrupted by white noise at high SNR, and the recovered female speech using the above three methods. The figure clearly indicates that there is virtually no speech degradation by using the proposed method, whereas the EMD-MMSE and SS methods degrade some of the source information. Some of the errors have been marked in the red box region. In summary, the proposed method has resulted in significantly higher output SNR values than the SS and EMD-MMSE methods across the various types of noise. The only exception is the case of white noise interference (input SNR at 0, 5, and 10 dB) where the SS method yields slightly higher output SNR values. This is because the white noise power
spectrum is uniform which can be accurately estimated and updated by the SS method during periods when the target signal is absent. However, for other types of noise, it is difficult to obtain precisely the noise power spectrum since the frequencies change randomly from frame to frame. This leads to poorer efficiency in the de-noising process using the EMD-MMSE and SS methods. Our proposed method focuses on the idea of source separation to track the target signal in the TF domain and avoids directly estimating the noise power spectrum; as such it becomes more efficient to deal with noise whose frequencies change randomly from frame to frame. V. CONCLUSION This paper has presented a novel framework of amalgamating EMD with v-SNMF2D for single channel source separation. In this paper, it is shown that the IMFs have several desirable properties unique to single channel source separation problem: 1) the degree of mixing in each IMF is less ambiguous than the mixed signal, 2) the IMFs has simpler and sparser spectral and temporal patterns which allows the proposed v-SNMF2D algorithm to efficiently track them, and 3) the IMFs serve as the orthogonal temporal bases for signal separation; hence, errors resulted from any IMF will be averaged over all the IMFs leading to smaller errors at the signal reconstruction stage. In the proposed v-SNMF2D algorithm, the sparsity parameters are individually optimized and adaptively tuned using the variational Bayesian approach to yield the optimal sparse codes. The proposed framework enjoys at least two significant advantages: First, it avoids the strong constraints of separating blind source without training knowledge. Second, the v-SNMF2D algorithm gives a robust sparse decomposition and under non-negativity condition, the decomposition is unique making it unnecessary to impose constraints in the form of statistical independence of the sources. REFERENCES [1] A. Hyvarinen, J. Karhunen, and E. Oja, Independent Component Analysis and Blind Source Separation. New York: Wiley, 2001, pp. 20–60.
GAO et al.: SCSS USING EMD-SUBBAND VARIABLE REGULARIZED SPARSE FEATURES
[2] W. L. Woo and S. S. Dlay, “Neural network approach to blind signal separation of mono-nonlinearly mixed sources,” IEEE Trans. Circuits Syst. I, vol. 52, no. 6, pp. 1236–1247, Jun. 2005. [3] J. Zhang, W. L. Woo, and S. S. Dlay, “Blind source separation of post-nonlinear convolutive mixture,” IEEE Trans. Audio, Speech, Lang. Process., vol. 15, no. 8, pp. 2311–2330, Nov. 2007. [4] P. Gao, W. L. Woo, and S. S. Dlay, “Nonlinear signal separation for multi-nonlinearity constrained mixing model,” IEEE Trans. Neural Netw., vol. 17, no. 3, pp. 796–802, May 2006. [5] M. H. Radfa and R. M. Dansereau, “Single-channel speech separation using soft mask filtering,” IEEE Trans. Audio, Speech, Lang. Process., vol. 15, no. 6, pp. 2299–2310, Aug. 2007. [6] D. Ellis, “Model-based scene analysis,” in Computational Auditory Scene Analysis: Principles, Algorithms, and Applications, D. Wang and G. Brown, Eds. New York: Wiley/IEEE Press, 2006. [7] M. J. Reyes-Gomez, D. Ellis, and N. Jojic, “Multiband audio modeling for single channel acoustic source separation,” in Proc. Int. Conf. Acoust., Speech, Signal Process. (ICASSP’04), Montreal, QC, Canada, May 2004, vol. 5, pp. 641–644. [8] T. Kristjansson, H. Attias, and J. Hershey, “Single microphone source separation using high resolution signal reconstruction,” in Proc. Int. Conf. Acoust., Speech, Signal Process. (ICASSP’04), Montreal, QC, Canada, May 2004, vol. 2, pp. 817–820. [9] Y. Li, S. Amari, A. Cichocki, D. W. C. Ho, and X. Shengli, “Underdetermined blind source separation based on sparse representation,” IEEE Trans. Audio, Speech, Lang. Process., vol. 54, no. 2, pp. 423–437, May 2006. [10] C. Fevotte and S. J. Godsill, “A Bayesian approach for blind separation of sparse sources,” IEEE Trans. Audio, Speech, Lang. Process., vol. 14, no. 6, pp. 2174–2188, Nov. 2006. [11] G. J. Jang and T. W. Lee, “A maximum likelihood approach to single channel source separation,” J. Mach. Learn. Res., vol. 4, pp. 1365–1392, 2003. [12] P. Li, Y. Guan, B. Xu, and W. Liu, “Monaural speech separation based on computational auditory scene analysis and objective quality assessment of speech,” IEEE Trans. Audio, Speech, Lang. Process., vol. 14, no. 6, pp. 2014–2023, Nov. 2006. [13] G. Hu and D. L. Wang, “Monaural speech segregation based on pitch tracking and amplitude modulation,” IEEE Trans. Neural Networks, vol. 15, no. 5, pp. 1135–1150, Sep. 2004. [14] M. S. Pedersen, D. L. Wang, J. Larsen, and U. Kjems, “Two-microphone separation of speech mixtures,” IEEE Trans. Neural Netw., vol. 19, no. 3, pp. 475–492, Mar. 2008. [15] O. Yilmaz and S. Rickard, “Blind separation of speech mixtures via time–frequency masking,” IEEE Trans. Signal Process., vol. 52, no. 7, pp. 1830–1847, Jul. 2004. [16] D. Ellis, “Prediction-driven computational auditory scene analysis,” Ph.D. dissertation, Mass. Inst. Technol., Cambridge, MA, 1996. [17] P. Bofill and M. Zibulevsky, “Underdetermined blind source separation using sparse representations,” Signal Processing, vol. 81, pp. 2353–2362, 2001. [18] N. Roman, D. L. Wang, and G. J. Brown, “Speech segregation based on sound localization,” J. Acoust. Soc. Amer., vol. 114, no. 4, pp. 2236–2252, 2003. [19] P. Paatero and U. Tapper, “Positive matrix factorization: A non-negative factor model with optimal utilization of error estimates of data values,” Environmetrics, vol. 5, no. 2, pp. 111–126, 1994. [20] D. Lee and H. Seung, “Learning the parts of objects by non-negative matrix factorization,” Nature, vol. 401, no. 6755, pp. 788–791, 1999. [21] M. Helén and T. Virtanen, “Separation of drums from polyphonic music using non-negative matrix factorization and support vector machine,” in Proc. 13th Eur. Signal Process. Conf. (EUSIPCO’05), Antalaya, Turkey, 2005. [22] P. Smaragdis and J. C. Brown, “Non-negative matrix factorization for polyphonic music transcription,” in Proc. IEEE Workshop Applicat. Signal Process. Audio Acoust. (WASPAA), 2003, pp. 177–180. [23] R. Kompass, “A generalized divergence measure for non-negative matrix factorization,” Neural Comput., vol. 19, no. 3, pp. 780–791, 2007. [24] A. Cichocki, R. Zdunek, and S. I. Amari, “Csiszár’s divergences for non-negative matrix factorization: Family of new algorithms,” in Proc. Int. Conf. Ind. Compon. Anal. Blind Signal Separat. (ICABSS’06), Charleston, SC, Mar. 2006, vol. 3889, pp. 32–39. [25] P. D. O. Grady, “Sparse separation of under-determined speech mixtures,” Ph.D. dissertation, National Univ. of Ireland, Maynooth, Kildare, Ireland, 2007.
975
[26] T. Virtanen, “Monaural sound source separation by non-negative matrix factorization with temporal continuity and sparseness criteria,” IEEE Trans. Audio, Speech, Lang. Process., vol. 15, no. 3, pp. 1066–1074, Mar. 2007. [27] D. FitzGerald, “Automatic drum transcription and source separation,” Ph.D. dissertation, Dublin Inst. of Technol., Dublin, Ireland, 2004. [28] M. Morup and M. N. Schmidt, Sparse Non-Negative Matrix Factor 2-D Deconvolution. Copenhagen: Technical Univ. of Denmark, 2006. [29] M. N. Schmidt and R. K. Olsson, “Single-channel speech separation using sparse non-negative matrix factorization,” in Proc Int. Conf. Spoken Lang. Process. (INTERSPEECH), Pittsburgh, PA, 2006, pp. 2614–2617. [30] E. Vincent, “Musical source separation using time–frequency source priors,” IEEE Trans. Audio, Speech, Lang. Process., vol. 14, pp. 91–98, 2006. [31] M. K. I. Molla and K. Hirose, “Single-mixture audio source separation by subspace decomposition of Hilbert spectrum,” IEEE Trans. Audio, Speech, Lang. Process., vol. 15, no. 3, pp. 893–900, Mar. 2007. [32] B. Gao, W. L. Woo, and S. S. Dlay, “Single channel blind source separation using the best characteristic basis,” in Proc. 3rd Int. Conf. Inf. Commun. Technol. (ICTTA’08), 2008, pp. 1–5. [33] N. E. Huang, Z. Shen, S. R. Long, M. L. Wu, H. H. Shih, Q. Zheng, N. C. Yen, C. C. Tung, and H. H. Liu, “The empirical mode decomposition and Hilbert spectrum for nonlinear and non-stationary time series analysis,” Proc. R. Soc. London A, vol. 454, pp. 903–995, 2002. [34] B. Z. Wu and N. E. Huang, “A study of the characteristics of white noise using the empirical mode decomposition method,” Proc. R. Soc. London A, vol. 460, pp. 1597–1611, 2004. [35] M. N. Schmidt and M. Morup, “Non-negative matrix factor 2-D deconvolution for blind single channel source separation,” in Proc Int. Conf. Ind. Compon. Anal. Blind Signal Separation (ICABSS’06), Charleston, SC, Mar. 2006, vol. 3889, pp. 700–707. [36] D. P. Bertsekas, Nonlinear Programming, 2nd ed. Belmont, MA: Athena Scientific, 1999. [37] F. Sha, L. K. Saul, and D. D. Lee, “Multiplicative updates for non-negative quadratic programming in support vector machines,” Proc. Advances Neural Inf. Process. Syst., vol. 15, pp. 1041–1048, 2002. [38] M. Goto, H. Hashiguchi, T. Nishimura, and R. Oka, “RWC music database: Music genre database and musical instrument sound database,” in Proc. Int. Symp. Music Inf. Retrieval (ISMIR), Baltimore, MD, Oct. 2003, pp. 229–230. [39] M. Mørup and K. L. Hansen, “Tuning pruning in sparse non-negative matrix factorization,” in Proc. 17th Eur. Signal Process. Conf. (EUSIPCO’09), Glasgow, U.K., 2009. [40] Y. Lin, “ l -norm sparse Bayesian learning: Theory and applications,” Ph.D. dissertation, Univ. of Pennsylvania, Philadelphia, 2008. [41] H. Hirsch and D. Pearce, “The AURORA experimental framework for the performance evaluation of speech recognition systems under noisy conditions,” in Proc. Autom. Speech Recognition: Challenges New Millennium (ISCA ITRW ASR2000), Paris, France, 2000, pp. 29–32. [42] E. Deger, M. K. I. Molla, K. Hirose, and N. Minematsu, “Speech enhancement using soft-thresholding with DCT-EMD based hybrid algorithm,” in Proc. 15th Eur. Signal Process. Conf., 2007. [43] K. Khaldi, A. Boudraa, A. Bouchikhi, and M. T. Alouane, “Speech enhancement via EMD,” EURASIP J. Adv. Signal Process., vol. 2008, 2008, Article ID 873204. [44] S. F. Boll, “Suppression of acoustic noise in speech using spectral subtraction,” IEEE Trans. Audio, Speech, Lang. Process., vol. 27, no. 2, pp. 113–120, 1979.
Bin Gao received the B.S. degree in communications and signal processing from Southwest Jiao Tong University, Chengdu, China, in 2005 and the M.Sc. degree (with distinction) in communications and signal processing from Newcastle University, Newcastle upon Tyne, U.K., in 2007. He is currently pursuing the Ph.D. degree at Newcastle University and his research topic is single-channel blind source separation under the supervision of Dr. Woo and Prof. Dlay. His research interests include audio and image processing, machine learning, structured probabilistic modeling on audio applications such as audio source separation, feature extraction, and denoising.
976
IEEE TRANSACTIONS ON AUDIO, SPEECH, AND LANGUAGE PROCESSING, VOL. 19, NO. 4, MAY 2011
W. L. Woo was born in Malaysia. He received the B.Eng. degree (First Class Honors) in electrical and electronics engineering and the Ph.D. degree from the Newcastle University, Newcastle upon Tyne, U.K. He is currently a Senior Lecturer with the School of Electrical, Electronics, and Computer Engineering at Newcastle University. His major research is in mathematical theory and algorithms for nonlinear signal and image processing. This includes areas of blind source separation, machine learning, multidimensional signal processing, signal/image deconvolution, and restoration. He has an extensive portfolio of relevant research supported by a variety of funding agencies. Prior to joining the School, he worked on source separation techniques supported by QinetiQ on signal processing-based applications. He has published over 250 papers on these topics on various journals and international conference proceedings. Currently, he serves on the editorial board of many international signal processing journals. He actively participate in international conferences and workshops, and serves on their organizing and technical committees. In addition, he acts as a consultant to a number of industrial companies that involve the use of statistical signal and image processing techniques. Dr Woo is a member of the Institution Engineering Technology. He was awarded the IEE Prize and the British Scholarship in 1998 to continue his research work.
S. S. Dlay received the B.Sc. (Hons.) degree in electrical and electronic engineering and the Ph.D. degree in VLSI design from Newcastle University, Newcastle upon Tyne, U.K., in 1979 and 1983, respectively. In 1984, he was appointed as a Post-Doctoral Research Associate at Newcastle University and helped to establish an Integrated Circuit Design Centre, funded by the EPSRC. In November 1984, he was appointed as a Lecturer in the Department of Electronic Systems Engineering at the University of Essex. In 1986 he rejoined Newcastle University as a Lecturer in the School of Electrical, Electronic and Computer Engineering; then in 2001, he was promoted to Senior Lecturer. In recognition of his major achievements, he has been appointed to a Personal Chair in Signal Processing Analysis. He is currently Head of the Signal Processing theme. He has published over 250 research papers and his research interests lie in the mathematical advancement and application of modern signal processing theory to biometrics and security, biomedical signal processing, and implementation of signal processing architectures. He serves on many editorial boards and has played an active role in numerous international conferences in terms of serving on technical and advisory committees as well as organizing special sessions. Prof. Dlay is a College Member of the EPSRC. During the B.Sc. and Ph.D. degrees, he held a Scholarship from the Engineering and Physical Science Research Council (EPSRC) and the Charles Hertzmann Award.