Sep 1, 2010 - It is a difficult, ill-posed problem, with no consensus as to ... Here we develop a new image prior based on the Pearson type VII ... The loss of resolution is often inevitable due to limitations ... A very simple form of 1-st order MRF, previously em- ... can think of the difference between a pixel intensity and the.
2010 IEEE International Workshop on Machine Learning for Signal Processing (MLSP 2010) August 29 – September 1, 2010, Kittilä, Finland
SINGLE-FRAME IMAGE SUPER-RESOLUTION USING A PEARSON TYPE VII MRF Ata Kab´an
and Sakinah Ali Pitchay
The University of Birmingham, School of Computer Science, Edgbaston, B15 2TT ABSTRACT Image super-resolution restoration aims to recover a high resolution scene from its low resolution measurements. It is a difficult, ill-posed problem, with no consensus as to how best to formulate image models that can both impose smoothness and preserve the edges in the image. Here we develop a new image prior based on the Pearson type VII density integrated with a Markov Random Field model. This has desirable robustness properties and achieves state-ofthe-art performance in terms of the mean square error, in a range of noise conditions. We develop a fully automated hyperparameter estimation procedure for this approach, which makes it advantageous in comparison with alternatives. 1. INTRODUCTION Image restoration and super-resolution aims to recover a high resolution scene from its low resolution measurements. The loss of resolution is often inevitable due to limitations of the camera source. In addition, the capturing process introduces additive noise. Depending on the number of low resolution frames of the scene available, we may talk about single-frame or multi-frame version of the problem. In both cases, most often the observed frames are scarce or noisy, which makes restoration an ill-posed problem, and the singleframe version is necessarily under-determined too. Therefore, additional information is required to obtain an adequate solution. In a probabilistic model based framework, this additional information may be specified in the form of a prior distribution on the salient statistics that images are known to have. The two main characteristics are somewhat conflicting ones: local smoothness and the existence of edges. This makes the specification of a good image prior challenging. Many prior models have been proposed in the literature, with no consensus, however. Gaussian Markov Random Fields represent a popular choice for its computational tractability. The Huber-MRF is robust, hence preferable, and it is considered to be a state-of-the-art approach [4, 6]. However, it requires two parameters to be tuned, and its performance depends on a good choice for these. In this paper, we develop and investigate a perhaps less well-known, but quite convenient robust density, the Pear-
c 978-1-4244-7876-7/10/$26.00 2010 IEEE
son type VII, formulated as Markov Random Field (MRF) for image recovery and super-resolution. The Pearson type VII has been used previously in situations where robust, heavy tail behaviour is required, such as in stock market modelling [8] and X-ray measurements [9], and for robust density estimation [2] as a more convenient and numerically stable alternative to the t-mixtures. In this work we exploit the robustness of this density to balance predominant smoothness of images with some allowance for edges or discontinuities. 2. THE PEARSON TYPE VII DENSITY The N-dimensional zero-mean Pearson type VII density is defined as the following [1]: p(z|C, m) =
Γ(m) N 2
π Γ(m −
N 2)
�−m 1 � |C|− 2 1 + z T C −1 z
where m is the degree of freedom that controls the degree of robustness that must satisfy 2m > N , where N is the dimensionality of z. It subsumes the Gaussian (when m approaches infinity) and the Student-t. For convenience, we will denote ν := 2m−1, so that the parameter ν is subject to positivity constraint only, and write the univariate Pearson type VII density as: ν/2 2 (u + λ)− Γ( 1+ν 2 )λ √ p(u|λ, ν) = Γ(ν/2) π
1+ν 2
(1)
where the parameter λ controls the width of the density and ν the degrees of freedom. 3. IMAGE MODELS: MARKOV RANDOM FIELDS The main characteristic of any natural image is a local smoothness. That is, the intensities of neighbouring pixels tend to be very similar. Any reasonable image model needs to be able to capture this property. Markov Random Fields (MRF) are well suited and widely used models that formalise this. A very simple form of 1-st order MRF, previously employed with success for image recovery in e.g. [3, 4], is
29
to condition each pixel intensity on its four cardinal neighbours in the following way. For any one pixel zi define: p(zi |z −i ) = p(zi |z4neighb(i) ) X 1 = p(zi − 4
(2) zj )
3.0.1. Gaussian MRF The Gaussian MRF is frequently employed for convenience [3]. It has the following form: � � N 1 Y 1 2 p(z) = exp − (D i z) ZG (λ) i=1 2λ
(3)
j∈4neighb(i)
where the notation z −i means all the pixels excluding the i-th, and the set of four cardinal neighbours of zi was denoted as 4neighb(i). These are univariate probability distributions. We may mention that alternatives include the so-called total variation model, employed e.g. in e.g. [6], which is based on image gradients. The experimental comparison in [5] suggested these have comparable performance, the former being slightly superior though. Then, for a whole image z of N pixels, the MRF represents the joint probability over all the pixels on the image — a multivariate probability distribution. N N 1 Y 1 Y 1 p(z) = p(zi |z −i ) = p(zi − Z i=1 Z i=1 4
X
zj ) (4)
Then we may write the i-th feature in a vector form, with the aid of the i-th row of this matrix (denoted D i ) as the following: zi −
1 4
X
j∈4neighb(i)
zj =
N X
where λ is the variance parameter. However, its lack of robustness is a known drawback since it tends to blur the edges of the image. 3.0.2. Huber MRF The Huber density is defined with the aid of the Huber function: � u2 , if |u| < δ H(u|δ) = (7) 2δ|u| − δ 2 , otherwise. where δ is a threshold parameter that needs to be adjusted. The Huber-MRF prior is then defined as:
j∈4neighb(i)
R QN P where Z = dz i=1 P r(zi − 41 j∈4neighb(i) zj ) is the normaliser (or partition function) of the MRF. This is independent of z but depends on the hyperparameters of the constituent probability density building blocks. The simplicity of (4) is also intuitively appealing. One can think of the difference between a pixel intensity and the P average intensity of its neighbours, i.e. zi − 14 j∈4neighb(i) zj , as a feature. However, the partition function Z is intractable except very few specific cases, and approximations may be employed. For notational convenience, it is handy to create the symmetric N ×N matrix D to encode the above neighbourhood structure, with entries: if i = j; 1 −1/4 if i and j are neighbours; dij = 0 otherwise.
dij zj = Di z
(5)
j=1
We now turn to instantiate the functional form of the probability densities that describe the shape of the likely values of these features. The Gaussian-MRF and the Huber-MRF represent existing choices, and we then move on to employ the Pearson type VII density in a similar role.
(6)
p(z) =
� � N Y 1 1 exp − H(Di z|δ) ZH (λ, δ) i=1 2λ
(8)
where λ is similar to a variance parameter. The Huber-MRF has state-of-the-art performance, provided that its parameters are well chosen [6]. 4. THE PEARSON TYPE VII MRF We now propose to employ the Pearson type VII density with an MRF to provide a novel robust image model. One option would be to use its multivariate form by encoding the neighbourhood structure in C −1 = D T D. However, we would then not be able to exploit its heavy tail property on the level of pixel neighbourhoods – where we need it for edge preservation. Therefore we build our MRF prior from univariate PearsonVII densities, as the following: p(z) =
N Y −( ν+1 � 1 2 ) λ + (D i z)2 ZP (λ, ν) i=1
(9)
R −( ν+1 QN � 2 ) is the where ZP (λ, ν) = dz i=1 λ + (D i z)2 partition function, and this multivariate integral does not have an analytic form. As with all MRF priors, the partition function may be neglected as long as we are interested in a maximum a posteriori estimate of z with some known and fixed hyperparameters. However, the partition function does depend on the hyperparameters, hence for an automated estimation of these from the model, the partition function must be approximated and taken into account. We can see that, in the case
30
of Pearson type VII MRF, the partition function is smooth w.r.t. both λ and ν, whereas that of the Huber MRF is nonsmooth in δ. Hence, with a suitable analytic approximation of ZP (λ, ν) this may be used for hyperparameter estimation.
We shall employ a pseudo-likelihood approximation to the partition function ZP (λ, ν). Besides its simplicity, the pseudolikelihood is known to enjoy consistency [10]. It consists of taking each D i z as if it was independent of Dj z, for all j 6= i, to break down the intractable multivariate integral into tractable univariate integrals. Thus, we have the following: √ �N Γ(ν/2) π ν/2 Γ( 1+ν 2 )λ i=1 (10) i.e. the inverse of the product of the normalising terms of the univariate Pearson type VII density building blocks. Replacing this into the definition (9), we have the following approximate image model: N Z Y
dzi p(zi |z −i ) =
�
1+ν N ν/2 Y Γ( 1+ν ((D i z)2 + λ)− 2 2 )λ √ p(z|λ, ν) ≈ Γ(ν/2) π i=1
(11)
We are now ready to employ this in the overall model of the super-resolution, and use this to infer z simultaneously with estimating our hyperparameters λ and ν. 5. THE OVERALL MODEL FOR IMAGE SUPER-RESOLUTION
p(y, z|W , σ 2 , λ, ν) = p(y|z, W , σ 2 )p(z|λ, ν)
(13)
6. MAP-BASED ESTIMATION IN THE MODEL WITH PEARSON TYPE VII MRF We will use the joint probability (13) as the objective to be maximised. Maximising this w.r.t. z is also equivalent to finding the most probable image z, i.e. the maximum a posteriori (MAP) estimate, since (13) is proportional to the posterior p(z|y). Equivalently, the negative log of this expression will be defined as our minimisation objective: Obj(z, σ 2 , λ, ν) = − log[p(y|z, σ 2 )] − log[p(z|λ, ν)] (14) Plugging in the functional forms of the two density functions, we then minimise this w.r.t. z and the hyperparameters in turn. 6.1. Estimating the most probable z The terms of the objective (14) that depend on z are the following: N
� 1 ν+1 X log λ + (D i z)2 (y−W z)2 + 2 2σ 2 i=1 (15) The optimisation of (15) w.r.t. z may be done employing any nonlinear optimiser, the objective is differentiable. We employed a conjugate gradient type method1, which requires gradient information. The gradient is the following. Objz (z) =
5.1. Observation model Denoting the vectorised high-resolution image by z, as before, this is now a hidden variable. Instead, some low resolution version of it is observed. The degradation process will be taken as a linear transform, and we should note that, although this is a simplifying assumption, it has worked well in many super-resolution application so far. y = Wz + η
5.2. Joint model The overall working model consists of the observation model and the image prior model, so we have the joint likelihood, assuming 0-mean σ 2 -variance i.i.d. Gaussian additive noise:
4.1. Pseudo-likelihood approximation
ZP (λ, ν) ≈
are less observed pixel intensities than there are unknown ones).
∇z Objz =
(12)
where η ∼ N (0, σ 2 I) is the noise. Equivalently, we can write p(y|z) = N (W z, σ 2 I). where y is the observed version of the image, with M < N pixels, and σ 2 is the observation noise variance. In single-frame super-resolution, the transform W typically contains blur and down-sampling. In the multi-frame case we also have shift that varies between the observed frames and in that case y is a concatenation of all the vectorised low resolution frames observed from the scene of interest. The single-frame problem is more challenging in that the system is under-determined (i.e. there
N X Di z 1 T D Ti W (W z−y)+(ν+1) 2 σ (D i z)2 + λ i=1 (16)
6.2. Estimation of σ 2 Similarly writing out the terms of (14) that depend on σ 2 , taking derivative and solving, we get a closed form estimate for σ 2 : ! M 1 X 2 2 ˆ) (17) (yi − W i z σ ˆ = M i=1
1 We made use of the efficient implementation available from http://www.kyb.tuebingen.mpg.de/bs/people/carl/code/minimize/
31
6.3. Estimation of λ and ν
7. EXPERIMENTAL RESULTS AND DISCUSSION
The terms that depend on λ and ν: � � 1+ν − N log Γ(ν/2) Objλ,ν = N log Γ 2 N Nν − log(π) + log λ 2 2 N 1+ν X − log((D i z)2 + λ) (18) 2 i=1 Both of these hyperparameters need to be positive valued. To ensure our estimates are actually positive, we parametrise the log probability objective (18) such as to optimise for the +/- square root of these parameters. √ √ Taking derivatives w.r.t. λ and ν, we get: N
d log p(z) X ν(D i z)2 − λ √ √ = d λ ((D i z)2 + λ) λ i=1 d log p(u) √ d ν
= +
"
N log λ −
Nψ
�
N X
1+ν 2
i=1
�
(19)
� log (D i z)2 + λ
− Nψ
� ν �� √ ν (20) 2
where ψ(·) is the digamma function. of these √ The zeros √ functions give us the estimates of ± λ and ± ν. Although there is no closed-form solution, these can be obtained numerically using any unconstrained nonlinear optimisation method. The square of these estimates give us the estimates of our parameters of interest, λ and ν — hence these are guaranteed to be positive. 6.4. The algorithm ˆ , e.g. from the estimates of a • Initialise the estimates z Gaussian MRF. • Iterate until convergence: – Estimate σ 2 using (17). – Iteratively update λ and ν in turn, using (19) and ˆ. (20), with the current estimate z ˆ using (16) – Iterate to update z Note that, the inner loops need not completely converge. It is sufficient to increase, not necessarily maximise the objective at each intermediate step. However, we observed faster overall convergence by letting the inner iterations make more progress. The reason is probably that the overall objective is complex and has multiple local optima, while the individual updates break it down to much simpler objectives.
We have generated data starting from a ground truth real image2 of size 80 × 70 (i.e. 5600 pixels). Working on synthetic data allows us to compare the recovered image with the ground truth, so that we can measure the performance quantitatively. We work with an under-determined system where W is 4000 × 5600 (so y has 4000 pixels). Underdetermined systems are more reliant on the prior since there is less data available. In addition, the problem is made even harder as we in each set of experiments added Gaussian noise of progressively increasing variance: σ 2 = 1−9 , 0.25, 1, 4. This is high noise, considering that we scaled the pixel intensities to the interval [−0.5, 0.5]. We conducted experiments with both classical superresolution matrices, where W comprises blur and downsampling, as well as with ‘compressive’ matrices where W has random entries sampled i.i.d. from a standard Gaussian. The latter is of interest in view of new research in signal processing [7] directed towards devising hardware that can exploit the good theoretical properties of certain random matrices. From each low-resolution data set, we then try to recover the ground truth image, and we measure performance ˆ by the mean square error between the recovered image z and the ground truth z — that is, M SE = mean((z − ˆz)2 ). The first set of experiments, using randomly sampled (and then fixed) W matrix is meant to find out how good is the proposed Pearson type VII based MRF prior in comparison with other state of the art priors, when the hyperparameter is manually tuned to get the best MSE for all methods being compared. These results are summarised quantitatively in Figure 1. The competing methods are: Gaussian-MRF, a multivariate-Student-t based MRF that we also experimented with, and the Huber-MRF. We see from the figure, that the Pearson type VII based MRF as presented in the earlier section can achieve state-of-the-art performance, comparable to the Huber-MRF, across all noise levels tested, while the other priors tested perform worse. However, for the Huber-MRF, a principled determination of both of its hyperparameters would not be straightforward. The next question is then, how does the automated hyperparameter estimation of our Pearson type VII based MRF prior compare to these hand-picked best results? Figure 2 shows this superimposed with the best manual results for reference (both for the Pearson type VII approach). We see that, except for very high level of additive noise, the agreement is remarkable. In fact, the MSE at the highest of the noise levels is still comparable with that of the best manual tuning of Huber MRF. Hence, we can conclude that, in these experiments the Pearson type VII based MRF is preferable as a fully automatic method. 2 http://www.robots.ox.ac.uk/∼vgg/research/SR/synthdata.html
32
MSE=0.0036
MSE vary with σ for W[4000,5600]
−3
x 10
Gaussian Multivar−t PearsonVII Huber
5.5
MSE
5
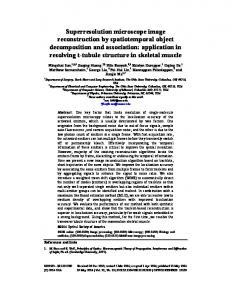
Fig. 3. From left to right: Ground truth; Best recovered; Recovered with automated hyperparameter estimation. The noise was σ = 0.5.
4.5
the box-plots of the MSE performance and the associated values of the Objective that our algorithm minimises. The box-plots represent the distribution over 10 independent trials of instantiations of the noise and transformation matrix. We see a remarkable agreement between the MSE and the
4
3.5 0.2
0.4
0.6
0.8
1 σ
1.2
1.4
1.6
1.8
4
−3
x 10
x 10
Fig. 1. Comparative MSE performance for the underdetermined system in progressively increasing noise conditions, using the best values of hyperparameter values that could be found manually.
4.5 Objective:−log(y,z)
−6.48
4 MSE
3.5 3 2.5 2
−3
x 10
1 hand−tuned λ and ν automated estimation
5.4
5
MSE
4.8 4.6 4.4 4.2 4 3.8 3.6
0.2
0.4
0.6
0.8
−6.56
2 3 Level of noise
4
1
2 3 Level of noise
4
Fig. 4. Agreement between MSE and Objective as performance measures, over 10 repeated runs on the ’cameraman’ image recovery problem. As before, z is 5600dimensional, y is 4000-dimensional. The four noise levels are: 1: σ = 4 × 10⁻⁵ , 2: σ = 0.5, 3: σ = 1, 4: σ = 2.
5.2
0
−6.54
−6.58
1.5
5.6
−6.5 −6.52
1
σ
1.2
1.4
1.6
1.8
2
Fig. 2. Comparing the MSE performance of the fully automated Pearson type VII based MRF approach with the best MSE found by manual tuning of the hyperparameters. The error bars are over 7 independent trials where additive noise and the transform W was randomly drawn.
Figure 3 shows an example of image recovery from the set of experiments at the noise level σ = 0.5: the ground truth image used in these experiments, along with the best recovered image with manual tuning and one that is recovered fully automatically. The next set of experiments presents results using the ’cameraman’ image. Figure 4 demonstrates comparatively
Objective values. Note that the calculation of the MSE requires access to the ground truth image, while the Objective does not. Hence, the agreement between these two quantities represent further evidence for the appropriateness of our proposed model and automated estimation procedure. In other words, the best (or close to best) results in terms of agreement with the ground truth can be found by accessing (optimising) the objective function independently of the ground truth. Figure 5 illustrates an example of recovery for the ’cameraman image’, from the set of experiments with σ = 0.5 and W with i.i.d. random Gaussian entries. The observed image y looks completely random, and is therefore not shown. The initial guess was produced with Gaussian-MRF with σ 2 /λ set to 0.1, and was used just as a starting point for our recovery algorithm. Finally, we also illustrate an example of classical superresolution where the transformation matrix consists of random shifts, Gaussian blur with point spread function set to 0.4 and down-sampling. Here we generated multiple frames (18 low resolution images with a zoom factor of 3). So the overall system is over-determined in this case. Fig-
33
Ground truth
Ground truth
Initial guess
Avg Bicubic Interp
10
10
20
20
30
30
40
40
50
50
60
60
70
70 10
x 10
40
50
60
10
Objective: − log p(y,z)
−4 −5
20
30
40
50
60
800
1000
9
12
−3 Obj: −log(y,z)
30
Recovered, MSE=2.2340e−06
4
Recovered; MSE=0.0022
20
x 10
10 8 6 4 2 0
−6
−2
500
1000 1500 2000 2500 3000 Iterations
Fig. 5. Example recovery of ’cameraman’ (5600 pixels) from random projection to 4000 pixels and additive noise with σ = 0.5.
400 600 Iterations
Conference on Neural Networks (IJCNN), 2010, to appear. http://www.cs.bham.ac.uk/∼axk/PearsonTypeVIIMixture.pdf [3] R. C. Hardie, K. J. Barnard. Joint MAP Registration and High-Resolution Image Estimation Using a Sequence of Undersampled Images, IEEE Trans. Image Processing, Vol. 6, No. 12, Dec. 1997, pp. 621–633. [4] H. He and L.P. Kondi. MAP Based Resolution Enhancement of Video Sequences Using a Huber-Markov Random Field Image Prior Model, IEEE Conference of Image Processing, 2003, pp. 933-936. [5] H. He and L.P. Kondi, Choice of Threshold of the HuberMarkov Prior in MAP Based Video Resolution Enhancement, IEEE Electrical and Computer Engineering Canadian Conference, 2004.
8. CONCLUSIONS In this paper we formulated a new image prior based on Pearson type VII densities integrated with an MRF. Our main motivation has been the heavy tail property of the Pearson density, which indeed seems to be a good way of preserving edges while imposing smoothness. Our experimental results have confirmed state-of-the-art performance in difficult under-determined systems, under various noise level conditions, and with the additional advantage of a fully automated method for hyperparameter estimation.
[6] L. C. Pickup, D. P. Capel, S. J. Roberts, A. Zissermann, Bayesian Methods for Image Super-Resolution, The Computer Journal, 2007. [7] M. A. Davenport, P. T. Boufounos, M. B. Wakin, and R. G. Baraniuk Signal Processing with Compressive Measurements, To appear in IEEE Journal of Selected Topics in Signal Processing, 2009. [8] Y. Nagahara. Non-gaussian distribution for stock returns and related stochastic differential equation, Asia-Pacific Financial Markets, vol. 3, no. 2, pp. 121–149, 1996.
9. REFERENCES
[2] J. Sun, A. Kab´an, and J. Garibaldi, Robust Mixture Modeling using the Pearson Type VII Distribution. Proc. Int. Joint
200
Fig. 6. Example recovery from multiple (18) low resolution (zoom factor of 3) frames, which together represent an overdetermined system.
ure 6 shows the ground truth, a straw-man recovery by averaged bi-cubic interpolation from the individual low resolution frames (this was used as an initial guess for our method), and the obtained recovered image, along with the evolution of the objective over the iterations. We may conclude, from all these experiments, that our Pearson type VII based robust MRF prior is capable of recovering good quality high resolution image in a range of noise and data transformation settings.
[1] K. Pearson, Mathematical contributions to the theory of evolution, xix: Second supplement to a memoir on skew variation. Philosophical Transactions of the Royal Society of London, Series A, Containing Papers of a Mathematical or Physical Character, vol. 216, no. 429-457, 1916.
0
[9] P. Prev´ey. The use of Pearson VII distribution functions in X-ray diffraction residual stress measurement, Advances in X-Ray Analysis, vol. 29, pp. 103–111, 1986. [10] S. Geman and C. Gragne. Markov random field image models and their applications to computer vision. Proc. Intl Congress of Mathematicians, pp 1496–1517, Berkeley, California, 1986.
34