acetate, 1% isovaleric acid, 1% geraniol and odorless air, and two among them were used in one experiment. One of the two odors was randomly given more ...
Source localization with MEG evoked by the olfactory oddball paradigm Y. Ono1, M. Okumura1, K. Takada1, M. Kurosawa1, A. Ishiyama1, M. Tonoike2, M. Yamaguchi2, and N. Kasai3 1
Dept. of Electrical, Electronics and Computer Engineering, Waseda Univ., Tokyo, Japan; 2 Electrotechnical Lab., Osaka, Japan; 3Electrotechnical Lab., Tsukuba, Japan
1
Introduction
Cortical areas activated by olfactory stimulation have not been made clear yet, though a few studies were reported [1-3]. We are trying to localize the sources of olfactory MEG. The olfactory response becomes quickly weak because of subject's habituation. Then the data for source localization have little number of averaging and include much noise. The estimation error of localization is closely correlated to the signal to noise ratio (S/N). In order to estimate the sources accurately, we developed a noise reduction method using wavelet transform to do "time-frequency analysis"[4,5]. Adopting approximating functions with compact support, the wavelet analysis has advantages over traditional Fourier transform method, where the signal contains discontinuities and sharp spikes, such as evoked responses in MEG data. We applied this method to the olfactory MEG data. Four response signals were extracted at different latencies. The source equivalent current dipoles (ECDs) of each signal were estimated by the simulated annealing method (SA). The estimated locations and directions of the ECDs show that the source of olfactory MEG differs depending on their latencies and also the kind of odor stimuli.
2
Methods
2.1
Olfactory MEG
Olfactory MEGs were measured with a whole cortex type Neuromag-122™ SQUID system in Osaka Life Electronics Research Center. Six healthy righthanded subjects (6 male, between 21-22 years old, with informed consents) participated in this experiment. An odor pulse is given in the nostril through a Teflon tube synchronously with subject's inhalation, but once in three or four consecutive inhalations. Duration of the stimuli is 300ms, a rising time below 20ms and delay from the onset of the valve at 100±2ms. Prepared odors were 1% isoamyl
acetate, 1% isovaleric acid, 1% geraniol and odorless air, and two among them were used in one experiment. One of the two odors was randomly given more frequently than the other in the ratio of 3:1. Subjects were asked to count the number of occurrence of the rarer (target) odor. During measurements, the subjects hear white noise (SPL 70dB) through earphones, so the sounds from the valve do not interfere with the responses. For preventing eye movements, the subjects gazed at a point in front of them. MEG was recorded at a sampling rate of 400Hz, through a band-pass filter of 0.03-100Hz. Responses to the target (rare) and nontarget (frequent) odors were separately averaged with respect to the onsets of stimulation. The number of averaging was about 40 times at target odor. 2.2
Noise reduction using wavelet transform
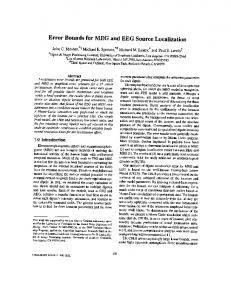
Typical averaged olfactory MEG at all channels is shown in Fig. 1a for an example. The noise reduction using wavelet transform was applied to each averaged data. In this method, the data was decomposed into the level 5 with “Daubechies 8” mother wavelet. The threshold was applied to the high-frequency components of the data to extract signal components. We used the standard deviation of the data elements as a threshold parameter. The data also contained low-frequency noise that is less than 1Hz caused by external noise sources. Then a digital high-pass filter of 1Hz was further applied. Four peaks about 260ms, 360ms, 490ms and 630ms after stimulus onset were extracted as shown in Fig 1b. We named them “response 1”, “response 2”, “response 3” and “response 4”. 2.3
Source localization
The source ECDs were estimated with two subjects KA and MH (out of six subjects). The SA method was used for the source localization with two dipoles model in a spherical volume conductor. The two cubic spaces with 8cm sides, which cover most of right and left hemisphere, were used for a search
space. It was assumed that there was one dipole in each cubic space. The ECDs at the time about 20ms among the peak latency were estimated with each response. Only the ECD that satisfied the condition of 1) dipolarity (over 85%), 2) stability (a distance from the estimated point just before is less than 3mm), and 3) continuance (steady over 10-20ms) was recognized as localized dipole. a)
Olfactory MEG (original) 100
M EG [fT/cm ]
50 0 -50 -100 -150 -200 -100
b)
0
100
200
300
400 500 tim e [m s]
600
700
800
900 1000
Olfactory MEG (after noise reduction)
M EG [fT/cm ]
100 50 0 -50 -100 -150 -200 -100
0
100
200
300 400 500 tim e [m s]
600
700
800
900 1000
3
Results
3.1
Localized olfactory response
The amplitude of responses by left nostril stimuli was about twice as large as that by right nostril stimuli in the case of subject KA. Response latencies and localized position are shown in Table1. In the table, the results of eight responses by left nostril stimulation (isovarelic acid: 3 set, isoamyl acetate: 3 set, and geraniol: 1 set), and five responses by right nostril stimulation (isovarelic acid: 2 set, isoamyl acetate: 2 set, and geraniol: 1 set) were shown. The latencies of response varied in subjects or sessions. However, reproducible dipoles were obtained between 220 and 290 ms after stimulus onset for response 1. These dipoles were named ECD1. The reproducible dipoles ECD2, ECD3 and ECD4 were obtained 320-410 ms after stimulus onset for response 2, 470-520 ms for response 3 and 590-670 ms for response 4, respectively. In these experiments, clear differences in latency were not observed between the stimuli odors, the side of nostrils (left / right), or target / non-target stimuli. Anatomical locations of estimated ECD was confirmed using the subject’s MRI images. The results suggest that superior temporal sulcus, insular, and precentral sulcus are olfactory activated cortical areas.
Figure 1: a) MEG for the right nostril stimulation (Subject: KA). b) MEG after noise reduction (using wavelet transform and 1Hz digital high-pass filter). Table 1: a) response latencies and localizations of left nostril stimulation. b) response latencies and localizations of right nostril stimulation. Abbreviation: STS (superior temporal sulcus), STG (superior temporal gyrus), SFG (superior frontal gyrus), PO (parietal operculum), PCS (precentral sulcus), SFG (superior frontal gyrus). isovarelic isoamyl acid acetate latency[ms] 247±12 249±23 ECD STS, PO, STS, PO, 1 position insular insular a) left nostril
ECD 2 ECD 3 ECD 4
latency[ms]
365±10
position
insular
latency[ms]
505±10
position
planum temporale
latency[ms] 632.5±5 position
postcentral sulcus
356±36 STS, insular
632.5±5 insular
geraniol 249±21 STG
latency[ms]
isovarelic acid 262±18
isoamyl acetate 285±5
position
PCS
PCS
anterior subcentral sulcus
350±40 inferiorPCS 470±10
380±10 SFG, insular 490±10
b) right nostril ECD 1
327.5±8 latency[ms] 390±10 ECD PO, 2 position PCS, insular insular latency[ms] ECD 3 position ECD 4
geraniol 270±10
PCS
latency[ms]
665±10
593±8
630±10
position
cingulate sulcus
superiorPCS
middle frontal gyrus
a)
10
2 z[cm]
5
1
2 4
1
isoamyl acetate
L
R
L
R
L
R
4
0
-5
-10 -10
-5
0
5
10
x[cm]
ECD1
10
y[cm]
5
0
2
L
2
ECD2 R
L
ECD3
ECD4
R
L
R
1
1
4
4
-5
-10 -10
-5
0
5
10
x[cm]
b)
10
2 z[cm]
5
1
2
3
1
isovarelic acid
LL
3
R R
LL
R R
LL
R R
0
-5
-10 -10
-5
0
5
10
x[cm]
ECD1
10
LL
y[cm]
5
2 0
2
3
1
ECD2 R R
L L
ECD3 R R
L L
ECD4 R R
1
3
-5
-10 -10
-5
0
5
10
x[cm]
c)
10
2
2
1
1
L
5
z[cm]
geraniol R
L
R
0
-5
-10 -10
-5
0
5
10
x[cm]
ECD1
10
L
y[cm]
5
2
1
1
0
2 -5
-10 -10
-5
0
x[cm]
5
ECD1 ECD2 ECD3 ECD4
10
ECD2 R
L
R
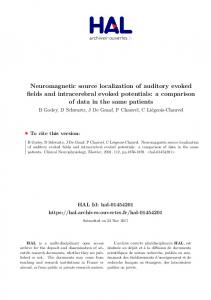
Figure2: Localization of neuronal activity after the stimulation of: (a) isoamyl acetate (subject: KA), (b) isovarelic acid (subject: MH), (c) geraniol (subject: KA). All estimated ECDs in one experiment session were shown in the plots of the left side.
4
Discussion
5
4.1
Transition of dipole
We tried to localize sources of olfactory MEG. Prepared odors were isovarelic acid, isoamyl acetate, and geraniol. These responses were measured by the oddball paradigm. In order to improve the S/N of the data, we developed a noise reduction method using wavelet transform. With this method, four responses about 260ms, 360ms, 490ms and 630ms after stimulus onset were extracted. The SA method was used for the source estimation. Pairs of ECDs were localized around superior temporal sulcus, insular, and precentral sulcus. The olfactory activation in insular cortex and superior temporal sulcus is coincided with the results presented by Kettenmann, and Ayabe. Through all of the results, the dipoles at the latency of 260ms were localized in the outer position than the position at the latency of 360ms. Moreover, the direction of estimated dipoles differ depending on the kind of odors. These results suggest the olfactory information processing in the human cortex.
To follow the ECDs transition in the cortex, all estimated ECDs in one experiment session were plotted. Some results are shown in Fig. 2. The positions of ECD2 were estimated more inwardly than those of ECD1. As for ECD3 and ECD4, their transition is not clear because of few examples. However, the results suggest that three or four different parts of the cortex respond sequentially by olfactory stimulation. This transition of dipoles is considered to have some connection with the olfactory information processing in the human cortex. 4.2
Dependence on the kind of odors
The direction of estimated dipoles shows the orientation of stimulated nerve fiber in the cortex. When the stimuli odor is isovarelic acid or isoamyl acetate, the ECD1 directs to backward and ECD2 directs to forward. On the other hand, when the stimuli odor is geraniol, ECD1 directs to forward and ECD2 directs to backward. It is opposite to the result of isovarelic acid and isoamyl acetate. This suggests that the cell concerning with olfactory information is likely to selectively be excited with the kind of odor stimuli. 4.3
Comparison with existent report
Several reports suggested the olfactory source locations. In the experiments reported by Kettenmann et al. using vanillin [1], olfactory evoked activations were found in the parainsular cortex, the anterior-central parts of insular cortex, and the superior temporal sulcus at the latency of 324ms, 434ms, and 568ms, respectively. In this report, the dipoles of first latency were localized in the outer position than the dipoles of second latency, which is coincided with our results. And the source locations almost agree with our results. The olfactory activation in insular cortex and superior temporal sulcus were also reported in the experiments with Kobal Olfactomater by Ayabe et al [3]. Therefore, we suggest that the olfactory activated cortical area is around insular cortex, or superior temporal sulcus.
Summary
References 1. B. Kettenmann, C. Hummel, H. Stefan, and G. Kobal, “Multiple Olfactory Activity in the Human Neocortex Identified by Magnetic Source Imaging”, Chem. Senses 22, 493-502, 1997. 2. B. Kettenmann, V. Jousmäki, K. Portin, R. Salmelin, G. Kobal and R. Hari, “Odorants activate the human superior temporal sulcus”, Neurosci. Lett., 203, 143-145, 1996. 3. S. Ayabe, T. Kobayakawa, H. Endo, H. Kaneda, S. Saito and N. Goto, “Human cortical areas related to olfaction studied by evoked potentials and magnetic fields”, J. Jpn. Biomag Bioelect. Soc. (in Japanese), 11, 9-14, 1998. 4. M. Kurosawa, M. Okumura et al, “Signal Processing using Wavelet Transform for noise reduction”, Abstracts of Biomag2000, 2000. 5. S. Sakakibara, “Wavelet beginners guide” (in Japanese), 16-23, 1997.