The Aerospace Corporation, Los Angeles, California 90009-2957. A method for ..... for Space Objects Using Public Data,â American Astronautical Society, AAS.
JOURNAL OF GUIDANCE, CONTROL, AND DYNAMICS Vol. 26, No. 2, March–April 2003
Space Vehicle Maneuver Method to Lower Collision Risk to an Acceptable Level Russell P. Patera¤ and Glenn E. Peterson† The Aerospace Corporation, Los Angeles, California 90009-2957 A method for determining the maneuver required by a space vehicle to reduce its collision probability with another tracked object below a prede ned threshold was developed. The methodology employs ef cient computational schemes for computing collision probability, propagating space vehicles, and three-dimensional root nding. The collision probability calculation was improved by reducing a two-dimensional integral to a one-dimensional integral, thereby realizing a signi cant reduction in computationaleffort. In addition, a method to circumvent high delity propagation of the space objects from the time of the maneuver to the time of closest approach was found. The method essentially replaces high- delity propagation with simple two-body Keplerian propagation. A gradient technique is used to nd the maneuver direction. The maneuver magnitude is found using a one-dimensional root nding scheme that takes advantage of the linear relationship between the maneuver velocity and resulting displacement. The method was applied to an actual case involving two geostationary satellites whose collision probability was unacceptably high. For various times before closest approach, the maneuver required to reduce the collision probability below a required threshold was found and provided to satellite operators. A maneuver time was selected and the associated maneuver was executed by satellite operators. Postmaneuver tracking of the satellites indicated that the maneuver worked as planned and reduced the collision probability to the desired level.
T
Introduction
space consists of the time of application, velocity magnitude, and direction (right ascension and declination) of the applied maneuver. Computational ef ciencies in propagation, collision probability calculation, and optimization are required to allow suf cient time for maneuver planning. Such ef ciencies were achieved and were used to plan a collision avoidance maneuver for an operational system.
HE need for collision avoidance maneuvers is increasing as the number of operational satellites and associated debris increases. The problem is made worse by the narrow altitude bands associated with communication satellite constellations in both low Earth orbit (LEO) and geostationary Earth orbit (GEO). Satellites occupying the same altitude range suffer increased risk of collision. The collision hazard posed by debris and other operational satellites has increased to the point where collision avoidance maneuvers should be considered as a means to mitigate the collision risk. The increasing collision hazard is forcing crewed vehicles to perform unwanted collision avoidance maneuvers.Such maneuvers are disruptive to mission operations and to some zero gravity science experiments. The space shuttle performs such a maneuver if the predicted miss distance is less than 2 km radially, 5 km in-track, and 2 km out-of-plane.1 The International Space Station has already performed two collision avoidance maneuvers based on collision probability methodology.2 Collision avoidance maneuvers for uncrewed space vehicles reduce vehicle life span due to propellant consumption, and the extra thruster rings increase the potential for propulsion system failure. The decision to perform a collision avoidance maneuver is based on a cost–risk analysis that requires a quanti able measure of risk. Unlike a keepout criterion,collisionprobabilityprovides the needed quanti cation of risk. Collision probability can be weighed against the propellant consumed and shortened operational life span of the space vehicle. The value of the space asset can be used to establish a collision risk threshold. Because the amount of propellantis directly related to a satellite’s operational lifetime and revenue, maneuvers should be performed in the most ef cient and effective manner possible. This requires searching a four-dimensional space for the optimal solution. This
Collision Avoidance Processing The rst step in determining collision probability is to screen out objects that have no possibility of collision based on orbital elements. This helps to reduce the computational effort because there are over 9500 tracked objects and only a few of these could be involved in a collision with a space vehicle under consideration. Determining close approachesor conjunctions between the satellite of interest and other space objects requires high- delity propagation of the respective state vectors and covariances while the separation distance between the objects is monitored. If the separation distance falls below a predetermined value based on the size of the error covariances, then a collision probability calculation is warranted. Once a collision probability is found to be above the maneuver threshold, the optimal collision avoidance maneuver must be determined by mission planners. To facilitate this process, a set of possible maneuver times before conjunction are found. For each time, the optimum maneuver velocity direction and magnitude is found that reduces the collision probability to the maneuver threshold. This search entails propagating the state vectors from epoch to the maneuver time, applying the maneuver and propagating the state vectors to the new conjunction time. Figure 1a shows the procedure;Fig. 1b will be described in a later section. The initial high- delity propagation with a search for conjunctions is represented by the trajectory segment between A and B. Point A represents the trajectory at epoch. Point B represents the conjunctionwith another object (not shown). Point C represents the time of maneuver. The trajectory segment from C to D is generated by high- delity propagation of the vehicle from the maneuver to the new conjunction time represented by point D. A new collision probability is computed at the new conjunction time. This process is repeated as the search for the optimum maneuver direction and magnitude proceeds. Figure 2 illustrates the processing ow. The nal result is a plot of maneuver velocity vs time before conjunction that can be used by satellite operators in planning a collision avoidance maneuver.
Received 19 November 2001; revision received 10 July 2002; accepted c 2002 by Russell P. Patera and for publication 7 October 2002. Copyright ° Glenn E. Peterson. Published by the American Institute of Aeronautics and Astronautics, Inc., with permission. Copies of this paper may be made for personal or internal use, on condition that the copier pay the $10.00 per-copy fee to the Copyright Clearance Center, Inc., 222 Rosewood Drive, Danvers, MA 01923; include the code 0731-5090/03 $10.00 in correspondence with the CCC. ¤ Senior Engineering Specialist, P.O. Box 92957. † Engineering Specialist, P.O. Box 92957. Member AIAA. 233
234
PATERA AND PETERSON
Improving Computational Ef ciency Because high- delity state vector propagation of both space objects is involved, great savings in computational effort can be attained using an improved methodology that does not rely on timeconsuming high-precision integration. The new methodology is based on the recognition that the maneuvers will be small and will produce small trajectory changes. A maneuver typically displaces the position of the satellite only tens of kilometers at conjunctionto achieve the necessary reduction in probability. Accurate state vector information represented by small error covariance implies that only a small maneuver is needed. Larger error covariances may require somewhat larger maneuvers. This effect is limited because as the error covariance increases the associated probability density changes. Close to the center of the covariance, the probabilitydensity lessens for larger covariance,but farther from the center,the probabilitydensitymay be larger.In the event of either a small or large covariance,changes in the trajectorydue to a maneuver are small enough to render all higher-order contributions from orbital perturbationsnegligible with respect to collision probability. These include all gravitational perturbations including sun, moon, solar radiation pressure, etc. However, the effect of drag cannot be ignored for objects in LEOs below about 500 km. The new methodology proceeds, as usual, by nding a conjunction and determining the associated collision probability. The nonmaneuvering object’s state vector and error covariance matrix are retained for repeated use. The maneuvering object is propagated backward using Keplerian two-body propagation to the time of maneuver application. This is shown in trajectory segment B to C in Fig. 1b. The maneuver velocity increment is applied at point C, and the state vector is propagated forward to the time of the original conjunction at point D using Keplerian two-body propagation.This increases speed because Keplerian propagation has a closed-form analytical solution except for solving Kepler’s equation. Figure 3 shows the relative error between the Keplerian backward–forward
propagation and backward–forward integration using full perturbation modeling. The errors shown are for a 10-cm/s burn in the transverse direction and are plotted against the number of orbits before conjunctionwhen the burn is applied. The 10-cm/s burn is large for a conjunction maneuver and so the errors are conservativein nature; typically the burn magnitudes are on the order of centimeter per second. For higher altitude orbits (LEO above 500 km, GEO), the Keplerian assumption resulted in very little relative error. Below 500 km, drag effects start limiting the effectivenessof this approach. The collision probabilityis computed based on this new state vector of the maneuvering vehicle and the old state vector of the nonmaneuvering object. The original covariance matrices are retained for repeated use. One could compute a new conjunction based on the state vector after the maneuver and use it to compute the collision probability. However, this step is not necessary because the collision probability calculation requires the state vectors near the conjunction, not precisely at the conjunction. This is true because, in computing collision probability, the relative geometry and probability density are projected to the encounter plane. This renders displacementsparallel to the relative velocity vector, or equivalently errors in conjunction time, negligible with respect to the collision probability calculation. In summary, the new method replaces high- delity propagation of two objects with a simple Keplerian propagation of one object. Thus, a great reduction in computational effort is achieved with the new method reducing computer run times from hours to seconds.
Collision Probability Methodology The input required to perform a collision probability calculation includes the respective state vectors, error covariance matrices, and physical sizes of the objects involved. Because the relative velocity of orbital objects at closest approach is very large compared to the relative accelerations, the relative velocity can be considered constant during the encounter period.
a) Brute force method
b) Applied method Fig. 1 Two methods to determine the effect of a maneuver at point C on the trajectory at point D.
Fig. 2
Fig. 3 Relative error in proposed Keplerian backward– forward propagation.
Collision avoidance processing procedure.
235
PATERA AND PETERSON
The positional error of each object at closest approach is represented by a three-dimensional Gaussian probability density. The relative error in position of the objects can be obtained by simply combining the uncorrelated error covariance matrices associated with each object. Because the objectspass each other at constantvelocity,the threedimensional probability density is reduced to a two-dimensional distribution. That is, the probability density as a function of position along the velocity direction can be integrated yielding a twodimensional Gaussian distribution in the encounter plane, which is normal to the relative velocity vector. The collision probability is obtained by integrating the twodimensional probability density in the encounter plane over a circular region3¡6 representing the combined hard-body sphere of the objects.A tremendousimprovementin computationalef ciency can be achieved by using a coordinate rotation and scale change to reduce the calculation to a one-dimensional path integral involving a simple exponential.7 An additional bene t of the path integral formulation is that asymmetric hard-body shapes can be treated, such as tethers.8 The reduction of the two-dimensional area integral to a one-dimensional contour integral enables a 20-fold improvement in computational speed.9 This increased computational speed helps make maneuver optimization practical.
Maneuver Optimization Methodology The maneuver velocity and direction are found using a two-step process. First, the directionof the maneuver is determinedby nding the gradient of the collision probability with respect to maneuver direction. The displacement of the maneuvering vehicle at conjunction is a linear function of maneuver magnitude for small maneuvers. This means that the gradient of collision probability is nearly independent of maneuver velocity magnitude. Thus, the optimal maneuver direction can be found independently of the maneuver magnitude. Once the maneuverdirectionis determined,its magnitudeis found using a one-dimensional root nding scheme, such as the secant method or the Newton–Raphson method. In this manner, threedimension maneuver optimization is achieved with great numerical ef ciency.
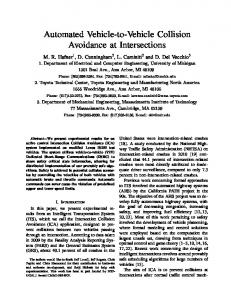
Analysis A general method to calculate collision probability has been developed. The method involves de ning an encounter plane perpendicular to the relative velocity vector, combining the error covariance matricesof the respectiveobjects, and projectingthe associated probability density to the encounter plane. The hard-body volume is also projected to the encounter plane, where it becomes a hardbody collision area. The probability density in the encounter plane is made symmetric by a coordinate rotation and scale change. The symmetrized probability density can be integrated in the radial direction, thus, reducing the probability calculation to evaluating the path integral given by 1 P D¡ 2¼
may not be perpendicular to the probability density contour lines due to nonlinear effects in orbital propagation and the encounter plane scale change. One obtains the maneuver velocity applied at a particular time before conjunction by rst nding the maneuver direction and then nding the maneuver magnitude. The maneuver direction VO is evaluated via its relation to the gradient vector G as follows: VO D ¡G=jGj
(2)
where GD
@P @P @P iO C jO C kO @ Vx @ Vy @ Vz
and where the x, y, and z velocity components are de ned in the local coordinate frame, with z being opposite to the radial vector, y being opposite to the angular momentum vector, and x completing the right-handedsystem. The size of the velocity increments used in evaluating the gradient can be adjusted for the nature of the problem being solved. A velocity increment of approximately 1 cm/s was foundacceptablefor severalcases involvinggeostationarysatellites. The magnitude of the maneuver velocity is found using the secant or Newton–Raphson root nding scheme with velocity increments directedalong the alreadyde ned maneuver velocitydirectiongiven by Eq. (2). The solution is obtained when the function F.v/ is zero to within a prescribed tolerance ": F .v/ D PM ¡ PT · "
(3)
where PM is the collision probability associated with the maneuver velocity magnitude v and PT is the collision probability maneuver threshold. The maneuver velocity magnitude is saved with its associated application time. The same procedure is used for other maneuver application times. Satellite operationalconstraintscan limit the maneuver direction. In such cases,the gradientis modi ed appropriately,and the maneuver velocity magnitude is found in the same way. Figure 4 illustrates a case where the maneuver velocity is limited to posigrade or retrograde velocity increments. The magnitude of maneuver velocity is plotted as a function of time before the original conjunction. For comparison, the magnitude of the maneuver velocity for a fully three-dimensionalmaneuver is also plotted. Signi cant differences exist when the maneuver is applied close to the time of conjunction. Figure 5 illustratesthe dramaticchangein three-dimensionalmaneuver direction in the pitch plane as the time of maneuver approaches the time of conjunction. A satellite operator can select the maneuver time and associated velocity from the plot of maneuver velocity magnitude vs time before conjunction. In some cases, the maneuver can be incorporated into routine station-keeping maneuvers.
I exp.¡®r 2 / dµ
(1a)
(if the origin is not enclosed in the hard-body area) or 1 P D1¡ 2¼
I exp.¡®r 2 / dµ
(1b)
(if the origin is enclosed in the hard-body area). Figure 3 illustrates the path integral around the hard-body collision area that is represented in Eqs. (1a) and (1b). The one-sigma and three-sigma contour lines are included to show the symmetry of the relative collision probabilitydensity, which is centered on the debris object. The contour along which the integral is evaluated lies on the perimeter of the hard-bodycollisionarea. The arrows indicate that the perimeter is traversed in the counterclockwise direction. The gradient arrows shown in Fig. 3 show the general directionin the encounter plane that the hard-body collision area must move to reduce collisionprobability.The gradient direction is away from the center of the collision probability density located at the origin, but
Fig. 4 Probability density in the encounter plane with contour of collision probability integral.
236
PATERA AND PETERSON
Fig. 7
Overall collision vision processing.
Fig. 5 Maneuver velocity magnitude vs time before conjunction for maneuvers: ——, one dimensional and ¤, three dimensional.
Fig. 8
Fig. 6 Maneuver magnitude and pitch plane direction for a threedimensional maneuver applied near conjunction: ——, DV and ¤, negative pitch.
Numerical Results Collision analysis (COLA) at The Aerospace Corporation is conductedthroughthe CollisionVision softwaredevelopedby the Space Operations Support Of ce and the Center for Orbital and Reentry Debris Studies.10¡12 Collision Vision is a suite of programs that generates ephemeris and covariance data, nds close approach conjunctions, determines probability of collision, and performs visualization of results (Fig. 6). The entire regime of COLA is covered from covariance generation (program COVGEN) 10 to risk assessment (program CASPAR)11;12 to maneuver optimization. The program used to determine the optimal burns is called DVOPT. DVOPT uses the output from CASPAR and produces an optimal [minimum deltaV (DV)] burn solution as a function of time that reduces the cumulative probability for that vehicle to a desired threshold(“safe”) value following the algorithmdescribed.The burn solution can be found in either a one-dimensional,two-dimensional, or full three-dimensionalsense in the radial, transverse, and normal coordinate system. Operational maneuver planning can be tricky because the overall situationcan be made worse by the maneuver. For instance,consider a vehicle that is facing several conjunctions,but only one of which is dangerous and warrants a maneuver (termed a class red condition). Then, once a maneuver solution is found that reduces that conjunction to a safe level, care must be taken to make sure the nal burn solution does not make any of the other conjunctions worse. To account for this potentiality,DVOPT has been constructedto optimize the burn over all of the conjunctions identi ed for the run interval (typically, the run interval in Collision Vision is chosen as 14 days for GEO objects and 7 days for LEO objects). As an added check, the nal trajectory including the burn solution is rerun in CASPAR against the entire catalog of background objects to make sure that new conjunctions are not created due to the proposed burn. This procedure is illustrated in Fig. 7. As a sample case, consider an actual operational situation recently faced by The Aerospace Corporation COLA team for one of our customers at GEO. The customer experienced a series of close approaches between one of its spacecraft (hereafter called the primary) and another vehicle at GEO operated by a different entity (called the secondary). Because both spacecraft were in GEO orbits, they came close to each other approximately twice per orbit,
Sample operationalcase: ——, probability and ¤, miss distance.
although not every close approach resulted in a conjunction.A conjunction is de ned here as when the two 3-sigma error covariance ellipsoids of the satellites touch each other. If the error ellipsoids do not touch, then there is a negligible risk of collision even if the satellites are physically close to each other. Figure 8 shows the probability for each of the identi ed conjunctions between the two vehicles. For this case, there were no conjunctions between the primary and any other object except the secondary object. The run length was 14 days, and there were no conjunctions before 3 days. Because the individual collision probabilities are typically very small, the cumulative probability of collision is taken as the sum of individual probabilities. In this case, a cumulative probability of 7:74e¡5 was obtained. The individual conjunction probabilities exhibit a general decrease in risk as time increases from epoch. As time progresses, the two covariances will grow, and the probability density becomes less thereby resulting in naturally lower probabilities. Figure 8 also shows the nominal miss distancehistoryfor the same two vehicles. Note here that the miss distance does not exhibit the smooth behavior that the probability curve did. At times, the miss distance oscillates while the probability showed a steady decrease. Considerthe rst few conjunctionsfrom Fig. 8. The rst conjunction at 3.04 days had the highest probability with a miss distance of approximately 17 km. The next few conjunctions had noticeably lower probabilities, although the miss distance actually decreased to less than 7 km. The miss distance is based on the separation of the nominal trajectories,whereas the probabilitycomputationsare based on separation distanceand relative error covarianceprojectedto the encounter plane. Therefore, differencesin speci c encounter geometry that do not alter miss distance can signi cantly change the collision probability. Consequently, there is not a direct one-to-one correlation between the probabilityof collision and the nominal miss distance for the two objects. This is important when conductingcollisionrisk assessments: A small miss distance does not necessarily translate into a high probability of collision; conversely, high probability can be achievedeven though the nominal miss distance is not small. Simply examining the miss distance between two objects does not generate a clear understanding as to the true measure of collision risk. Figure 9 shows the minimum burn solutionas a functionof time as found by DVOPT (solid line with triangles). The maneuver threshold was set to 1e¡6 (recall the original cumulative probability was 7:74e¡5), and burns were allowed only in the along-track direction (plus or minus) due to station-keeping constraints on the primary vehicle. Figure 9 shows the magnitude of the required burn and the optimum in-plane burn angle corresponding to the optimal magnitude burn. A 0-deg burn angle corresponds to a positive in-track
237
PATERA AND PETERSON
Fig. 9 Optimal solution burn magnitude and pitch plane direction for sample operationalcase: N, optimalmagnitude; , optimaldirection; ——, prograde; and ¢ ¢ ¢ ¢, retrograde.
burn, and a 180-deg burn angle corresponds to a negative in-track burn. As expected, a general once-per-day signal is seen in the magnitude solution coupled with a general increase as the time of the rst conjunction is approached at 3.04 days from epoch. However, minimums beginning half of an orbit before the rst conjunction (at 0.54, 1.54, and 2.54 days from run epoch) appear. The solution does not extend past the rst conjunction because the maneuver must be made before the rst conjunction to lower the cumulative collision probability below threshold. Once that encounter has been passed at 3.04 days, the chosen threshold has already been exceeded (Fig. 8). Therefore, no further burns are possible that would reduce the cumulative probability to the threshold value, even if the burn eliminates all of the remaining conjunctions. The best times to burn are of course at the minimums. For this situation,those minimums are requiredto be in the along-trackdirection. However, in general the solution switches from prograde burns (0 deg in the along-track direction) to retrograde burns (180 deg against the along-track direction) at various times (Fig. 9). At the minimum points in burn magnitude,the solution advocatesan alongtrack burn. However, at the maximum points of the orbital cycle, the solution switches to the minus along-track direction. In addition to the optimal burn magnitude, Fig. 9 shows both the purely prograde and purely retrograde solutions. The dominant daily cycle in both solutions is apparent along with the switching between prograde and retrograde burns. Finally, some operational considerations enter the decisionmaking process regarding the selection of the actual burn to be performed. In general, it is better to conduct probability reduction maneuvers in terms of fuel ef ciency as far in advance of the dangerous conjunctions as possible. However, state vector information is constantly updated, and the secondary, if it is an active vehicle, may undergo its own maneuvers (station keeping for instance) that will invalidatean early burn solution.Therefore, it is advisable to wait as long as possible until the conjunction is imminent before conducting a burn for the primary. For the operational case examined here, the decision was made about 1.5 days past epoch to conduct the burn close to the 2.5-day minimum. This provided enough time to simulate the burn and to conduct nal collision assessment runs to make sure the proposedsolution did not adverselyaffect the vehicle. The collision reduction burn was combined with a normal stationkeeping maneuver already planned for execution at nearly the same time. This reduced the total number of thruster rings and risk of thruster failure. The proposed DVOPT solution was found both in the nal preburn runs and in postburn reanalysis to have provided a successful solution for this situation.
Conclusion A method to select a maneuver that will reduce the risk of a space vehicle colliding with another space object was developed. For a speci ed time before conjunction, a maneuver is found that will reduce the collisionprobabilityto a prede ned maneuver threshold.In this manner, the maneuver magnitude and space vehicle propellant requiredcan be minimized,therebyextendingspace vehiclelife.The method provides great computational ef ciencies in orbital propagation, collisionprobabilityprediction,and maneuver optimization.
Improvement in propagationef ciency was realized by replacing high- delity orbital propagationwith simple Keplerian propagation without reducing collision probability prediction accuracy. Collision probability prediction was made more ef cient by replacing a two-dimensional integral with a one-dimensionalpath integral, thereby increasing computational speed by a factor of 20. Maneuver optimization was streamlined by recognizing that the associated displacement at conjunction is a linear function of maneuver magnitude. This enables the maneuver direction to be determined separately from maneuver magnitude. Thus, the dimensionality of the maneuveroptimizationis reduced from three dimensions to one dimension. The methodology was incorporatedinto a computer program that also allows for mission constraints in burn availability and changes in threshold values. This computer program is part of the Collision Vision system at The Aerospace Corporation and has been used operationally for geosynchronousspacecraft. This maneuver optimization program was recently used to help a space vehicle operator select a maneuver to reduce collision probability with a neighboring satellite in the geostationary ring. The maneuver was required to reduce the cumulative probability associated with several conjunctionssimultaneously.This ensured that the maneuver itself did not severely increase the collision probability at secondary conjunctions while reducing the collision probability at the primary conjunction. The analysis was performed with suf cient time to allow the operator time to implement the preferred maneuver. The collision probability was recomputed after the maneuver was performed using postmaneuver state vectors and indicated that the maneuver worked as planned at reducing collision probability.
Acknowledgments The authors thank K. Chan of The Aerospace Corporation for discussions on the validity of two-body Keplerian propagation in assessing the effect of a maneuver on collision probability. The authors also thank several others from The Aerospace Corporation. V. Chobotov, R. Gist, and K. Chan reviewed the paper for technical content. B. Steppe conducted publication review.
References 1 “Protecting
the Space Shuttle from Meteoroids and Orbital Debris,” Committee on Space Shuttle Meteroid/Debris Risk Management, National Academy Press, Washington, DC, 1997, p. 38. 2 Foster, J., “The Analytic Basis for Debris Avoidance Operations for the International Space Station and the Space Shuttle,” Orbital Debris Quarterly News, Vol. 6, No. 2, 2001, p. 11. 3 Chan, K., “Collision Probability Analysis for Earth Orbiting Satellites,” Advances in the Astronautical Sciences, Vol. 96, Univelt, San Diego, CA, 1997, pp. 1033–1048. 4 Berend, N., “Estimation of the Probability of Collison Between Two Catalogued Orbiting Objects,” Advances in Space Research, Vol. 23, No. 1, 1999, pp. 243–247. 5 LeClair, R. A., “Probability of Collision in the Geostationary Orbit,” Proceedings of the 2000 Space Control Conference, Lincoln Lab., Massachusetts Inst. of Technology, Lexington, MA, 2000, p. 85. 6 Alfriend, K. T., Akella, M. R., Lee, D., Frisbee, J., and Foster, J. L., “Probability of Collision Error Analysis,” Space Debris, Vol. 1, No. 1, 1999, pp. 21–35. 7 Patera, R. P., “A General Method for Calculating Satellite Collision Probability,” Advances in the Astronautical Sciences, Vol. 107, Univelt, San Diego, CA, 2000, pp. 1275–1290. 8 Patera, R. P., “A Method for Calculating Collision Probability Between a Satellite and a Space Tether,” Journal of Guidance, Control, and Dynamics, Vol. 25, No. 5, pp. 940–945. 9 Patera, R. P., “A General Method for Calculating Satellite Collision Probability,” Journal of Guidance, Control, and Dynamics, Vol. 24, No. 4, 2001, pp. 716–722. 10 Peterson, G. E., Gist, R. G., and Oltrogge, D. L., “Covariance Generation for Space Objects Using Public Data,” American Astronautical Society, AAS Paper 01-113, Feb. 2001. 11 Gist, R. G., and Oltrogge, D. L., “Collision Vision: Covariance Modeling and Intersection Detection for Spacecraft Situational Awareness,” American Astronautical Society, Rept. AAS-351, Aug. 1999. 12 Oltrogge, D. L., and Gist, R. G., “The Collision Vision Prototype Assessment System,” Proceedings of the 1998 Space Control Conference, Lincoln Lab., Massachusetts Inst. of Technology, Lexington, MA, 1998, p. 23.