Estuaries and Coasts DOI 10.1007/s12237-014-9814-5
Spatial and Temporal Changes in Estuarine Food Web Structure: Differential Contributions of Marsh Grass Detritus Leandro Bergamino & Nicole B. Richoux
Received: 6 November 2013 / Revised: 25 March 2014 / Accepted: 31 March 2014 # Coastal and Estuarine Research Federation 2014
Abstract We measured stable isotope signatures and fatty acid profiles in dominant consumers and basal food sources to assess spatial and temporal changes in the trophic structure within an estuarine ecosystem. The consumers analyzed included zooplankton, benthic invertebrates and fishes from the upper, middle and lower reaches of the estuary collected over four seasons. The contributions of different food sources to the consumers were assessed using the isotopic mixing model stable isotope analysis in R (SIAR). Our stable isotope and fatty acid data indicated that the food webs differed significantly among reaches and seasons within the estuary. Benthic invertebrates exhibited lower carbon isotopic (δ13C) values in the upper reaches of the estuary during all seasons, with lowest values occurring during autumn. In contrast, nitrogen isotopic (δ15N) values of consumers were higher in the upper reaches of the estuary and were highest during summer and spring. SIAR models and fatty acid compositional data both indicated greater utilization of marsh grass by consumers inhabiting the lower reaches of the estuary, particularly during autumn and winter. Our data indicated that differential inputs of detritus contributed to spatial changes in the benthic estuarine food web structure and that the trends changed throughout the year.
Keywords Trophic interactions . Benthic fauna . Stable isotopes . Fatty acids . Estuary . Spatiotemporal variation Communicated by Marianne Holmer Electronic supplementary material The online version of this article (doi:10.1007/s12237-014-9814-5) contains supplementary material, which is available to authorized users. L. Bergamino (*) : N. B. Richoux Department of Zoology and Entomology, Rhodes University, P.O. Box 94, Grahamstown 6140, South Africa e-mail:
[email protected]
Introduction Estuaries are characterized by gradients of physical and chemical parameters (e.g. salinity, nutrients, and primary productivity), and hence the structure of biological communities can shift along these systems. Variability in an estuary also arises from the large potential diversity of organic matter inputs (McLusky and Elliott 2004), and seasonal variations in environmental factors such as salinity, temperature and the hydrology of the estuary may influence species distribution and abundance and the structure of food webs (Akin et al. 2003; Hoeinghaus et al. 2011; Antonio et al. 2012). Since the factors that influence estuarine ecosystem function can change through space and time, we were interested in exploring the extent of spatial and temporal variations in food web pathways within a temperate system. The diversity and biomass of estuarine benthic fauna are highly structured by the food availability and quality in the overlying water column (Herman et al. 1999). Benthic organisms depend partially on sedimentation processes in the water column to transfer organic matter from the pelagic to the benthic zones. As such, benthic fauna can utilize a variety of food sources including marine phytoplankton, bacteria, benthic microalgae and littoral plants (Currin et al. 1995; Deegan and Garritt 1997; Kang et al. 2003). The identification of carbon sources in estuaries is typically difficult since these are habitats characterized by potentially extensive movements of suspended materials over long distances or time periods (Connolly et al. 2005). Depending on the hydrodynamics, locally suspended food sources can also be highly influential in consumer diets at relatively small spatial (m to km) or temporal (weeks to months) scales (Deegan and Garritt 1997; Guest et al. 2004; Richoux and Froneman 2007). Previous research has shown that the diets of benthic consumers can be affected by spatial differences in the primary organic matter sources of detritus (Keats et al. 2004), the
Estuaries and Coasts
relative abundance of seagrass or macroalgae (McClelland and Valiela 1998; Olsen et al. 2011), and the quality and availability of animal prey (Fox et al. 2009). However, we still have much to learn about which potential food sources are the most important for a variety of estuarine fauna and how these contributions to consumer diets change along an estuarine gradient and through time. Since benthic organisms have limited motility, they represent excellent models with which we can study the importance of energy pathways in different locations within an estuary. The small body sizes and high variability in available food sources of many aquatic consumers make it difficult for researchers to determine feeding relationships using traditional stomach content analysis. Even when this traditional technique is possible, the resulting data represent only snapshots of very recent feeding by consumers. Alternatively, stable isotope (SI) and fatty acid (FA) analyses are used to assess food web structure because they both provide temporally integrated information on consumer diets (Dalsgaard et al. 2003; Fry 2006; Boecklen et al. 2011). SIs of carbon (δ13C) in consumers tend to increase by ~1‰ compared to those of their food, therefore indicating the original sources of energy if the potential sources differ isotopically (Peterson and Fry 1987). The nitrogen isotopic (δ15N) values increase by ~3‰ in consumers relative to their food, and this relationship provides an estimate of consumer trophic position (Post 2002; McCutchan et al. 2003). FAs can sometimes be used as trophic biomarkers when food sources such as bacteria, phytoplankton and seagrass contain different specific FAs that are, in turn, reflected in the lipid profiles of their consumers (Dalsgaard et al. 2003). When potential food sources are less distinct from one another, variations in FA composition (i.e. FA profiles) among consumers can be assessed using ordination techniques. We have utilized both SI and FA tracers to create new data towards answering questions about the spatial and temporal variations in estuarine food web structure. In this study, we assessed the food webs in three regions of an estuary over four seasons to examine how organic matter sources of benthic consumers change. Based on previous studies that showed the influences of local habitat characteristics (i.e. vegetation type and hydrology) on primary producers and consumers (Deegan and Garritt 1997; Bouillon et al. 2004; Richoux and Froneman 2007; Hoeinghaus et al. 2011; Dubois et al. 2014), we tested the hypothesis that consumers from different areas within the estuary have distinct SI and FA signatures owing to differential food availability along the spatial gradient. We also tested the hypothesis that the consumer diets shift through time owing to seasonal shifts in local primary production and detrital inputs that correspond to changes in freshwater discharge.
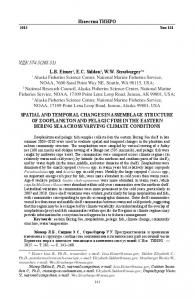
Methods Study Site The study was carried out in the Kowie Estuary (33° 36′ 11″ S, 26° 54′ 10″ E) located on the southeast coast of South Africa (Fig. 1). This is a permanently open, warm temperate and semidiurnal microtidal estuary with a spatial extent of 21 km (Whitfield et al. 1994; Schumann et al. 2001). The estuary channel is 2–3 m deep, depending on the tide, although deep scour holes of up to 8 m have been recorded in the lower reaches (Whitfield et al. 1994). The estuary is tidal for 20.8 km, and the spring tidal range in the upper reaches is about 1.1 m, in the middle reaches about 1.5 m and in the lower reaches about 1.7 m (Whitfield et al. 1994). Temperature increases from the lower to the upper reaches, and seasonal water temperatures in the whole system range from 20 to 28 °C in summer and 12 to 16 °C in winter (James and Harrison 2010). The width of the estuary is approximately 10 m at the head, broadening to more than 50 m in the lower reaches. Shallow salt marsh areas and large mud flats occur in the lower reaches, with intertidal mud banks exceeding 100 m in width. The Kowie catchment area is between 576 and 769 km2, and the mean annual freshwater runoff is approximately 23 to 46×106 m3 (Heinecken and Grindley 1982). Salinity increases from the head to the mouth (1–~35), and this gradient is accentuated during periods of high river flow (Whitfield et al. 1994). During the period of our study from
U South Africa
M 33°33‘S
L 33°35‘S
Spartina maritima
Indian Ocean 2 km
26°51‘E
27°E
Fig. 1 Location of the Kowie Estuary, South Africa, showing the sampling sites for both consumers and food sources: upper reaches (U); middle reaches (M); lower reaches (L)
Estuaries and Coasts
September 2012 to June 2013, the highest freshwater discharge through the Kowie River was recorded in October 2012 when the Kowie Estuary experienced flooding conditions resulting in a monthly average discharge of 94.1 m3/s, followed by November 2012 with an average of 2.2 m3/s, and low freshwater discharge occurred during the rest of the study (range of 0.2–0.6 m3/s; Department of Water Affairs and Forestry database, South Africa http://www.dwaf.gov.za/ hydrology). The emergent vegetation in the upper reaches is dominated by Phragmites australis and Schoenoplectus brachyceras, and Stuckenia pectinatus is the most widespread submerged macrophyte under oligohaline conditions (Whitfield et al. 1994). Mud flats and intertidal salt marshes occur in some areas of the middle and lower reaches. The middle portion of the estuary is inhabited by the salt marsh plants Chenolea diffusa and Sarcocornia perennis (upper intertidal zone). In the lower reaches, the upper intertidal zone is colonized by the marsh grass Spartina maritima (Whitfield et al. 1994). No macroalgae inhabited the estuary throughout our study. Sample Collections Organic matter sources and benthic consumers were sampled over four consecutive seasons (spring, summer, autumn, and winter) between September 2012 and June 2013 (Table 1). Samples were collected from three different areas encompassing a spatial gradient of environmental conditions (Bok 1983): (1) upper reaches, near the head of the estuary and dominated by river influences (approximately 17 km from the mouth; tidal range of 1.1 m); (2) middle reaches (approximately 11 km from the mouth; tidal range of 1.5); and (3) lower reaches, near the river mouth where extensive marine influence occurs (tidal range of 1.7; Whitfield et al. 1994) (Fig. 1). During this study and considering the three estuarine reaches, average water temperature in summer and winter was 25 and 15 °C, respectively. Annual mean salinity was ~3 in the upper reaches, ~17 in the middle reaches and ~30 in the lower reaches of the Kowie Estuary. All samples (fauna and basal sources) were collected in replicates of three from each estuarine region during each season. Portions of the dominant plants and the top 1–2 cm of surface sediments were collected during the day at low tide with a hand core (10-cm diameter), and the material was stored in ziplock bags inside an insulated cooler. Vegetation sampled from the upper reaches included P. australis and S. brachyceras, from the middle reaches included salt marsh plants C. diffusa and S. perennis, and from the lower reaches included the marsh grass S. maritima and associated detritus. Senescent leaves were also collected by hand from each estuarine area. Benthic invertebrates (Table 1) were collected using a dip net (mouth area 0.3×0.3 m, mesh size=1.0 mm) pushed perpendicular to the shore over a distance of 1–2 m
following Froneman and Henninger (2009) and in replicates of three in each estuarine region. In the field, invertebrates were washed of debris and kept alive in clean estuarine water for several hours to allow for their guts to clear. For the smallest invertebrates, three to five similar-sized individuals of the same species were pooled to obtain adequate biomasses. Zooplankton samples were obtained during the night by towing a 200-μm mesh plankton net for 2 min. All samples were stored at −80 °C until they were processed in the laboratory. Tracer data for additional aquatic end members from the upper, middle and lower reaches of the Kowie Estuary [i.e. particulate organic matter (POM), epiphytic algae and microphytobenthos (MPB)] were sourced in a separate study completed during the same study period (Dalu, unpublished data; Bergamino et al. 2014). At each estuarine reach, POM was obtained by filtering surface water through precombusted (500 °C; 5 h) GF/F filters, followed by the manual removal of all visible zooplankton. For MPB, at each sampling reach, three independent samples were taken of the top 1-cm sediment surface, deposited in a flat tray (about 20× 35 cm) and taken to the laboratory for further processing following Antonio et al. (2012). Epibionts from the dominant macrophytes S. brachyceras and S. maritima were collected separately by brushing submerged stones in distilled water. Laboratory Procedures All individuals were identified to species using Day (1969) or Whitfield (1998). For the zooplankton samples, individuals of the two dominant copepod species (Pseudodiaptomus hessei and Acartia longipatella) were isolated under a dissecting microscope and transferred to filtered estuarine water to allow for gut clearance overnight. Approximately 50 individuals per copepod species were pooled to represent each sample. Crab zoea and mysids were similarly isolated from the mixed zooplankton collections. All samples were processed within a day or two of each collection. Animal and plant samples intended for SI and FA analyses were rinsed with distilled water to remove salts, freeze-dried in foil envelopes, and ground to a fine homogeneous powder using a mortar and pestle. For invertebrates and fishes, we did not perform a lipid extraction given the low C/N ratios that varied between 3 and 5 indicative of low lipid content (see Appendix 1 on Supplementary Material; Post et al. 2007). Stable Isotope Analysis Sediments were soaked in 1 M HCl for several hours (or until bubbling stopped) to remove carbonates, rinsed in distilled water, and dried at 60 °C for 48 h. Animal tissues were not acidified to avoid unwanted alterations in isotopic measurements (Serrano et al. 2008). Homogenized tissues, sediments
Copepod ( W, Au 30 %) in consumers from the Kowie Estuary, particularly 20:5ω3 and 22:6ω3. In addition, the brachyuran crabs S. catenata and S. serrata, the mudprawn U. africana, and the hermit crab
D. brevirostris were characterized with high levels of 18:2ω6 and 18:3ω3 in the lower reaches. Furthermore, among consumers from the upper, middle and lower reaches, monounsaturated FAs (MUFAs) were the least dominant overall compared with PUFAs and saturated FAs (SFAs), with the most abundant MUFAs 18:1ω9, 18:1ω7 and 16:1ω7 (Table 4). The nMDS ordination (all dates pooled) showed that FA profiles in the dominant benthic consumers (Hymenosoma sp., G. callidus, S. bleekeri, S. catenata, and S. serrata) were separable on the basis of the region of the estuary (stress value 20:5ω5>16:0
22:6ω 3
16:0>20:5ω3>18:0
Fig. 6 Two-dimensional non-metric multidimensional scaling (nMDS) ordination for fatty acid profiles for benthic consumers among four different season based on the normalized Euclidean distance similarity matrix (spring (circle), summer (triangle), winter (cross), and autumn
16:0>22:6ω3>20:5ω3
(square)). Axes are dimensionless. Major fatty acids contributing the separation among seasons (derived from SIMPER and PCA) are shown in decreasing order and also superimposed in the plot
Estuaries and Coasts
by extensive beds of marsh grasses that may contribute largely to the production and accumulation of detritus in the region. These dense patches of salt marsh plants and other vegetation in the shallow waters that characterize the lower reaches may promote the deposition of detritus by reducing hydrodynamic forces and leading to calm physical conditions (Bouma et al. 2005). These general physical differences in upper and lower estuarine reaches support our suggestion that food webs based on detritus are dominant in the downstream shallow sections having extensive plant communities, contrasting with deeper upstream regions where phytoplankton supports the estuarine food web (see also Odum and Heald 1972). In addition to these hydrodynamic differences along an estuarine gradient, absolute salinity and salinity variations both affect the spatial distribution of organisms having differential salinity tolerances (Attrill 2002; Whitfield et al. 2012). The salinity gradient along the length of an estuary may similarly affect the prey availability within the estuary (Gning et al. 2010). With these concepts in mind, we suggest that a combination of environmental conditions (i.e. shallow waters, local vegetation type and salinity regime) and biological features (i.e. feeding behaviour) can all contribute to the spatial changes in community and food web dynamics within the Kowie Estuary. Greater assimilation of detritus from the marsh grass S. maritima by consumers in the lower reaches is well supported by the SI and FA signatures. Assuming a δ13C trophic fractionation in consumers of ~1‰ compared to that of their food, in the middle and upper reaches of the estuary, SIAR model output indicated that the epibenthic crab Hymenosoma sp. utilized large proportions of POM combined with small invertebrates (Table 3). In the lower reaches, we identified plant detritus as an additional source component in the diet of Hymenosoma sp., as SIAR results showed that S. maritima represents up to 11 % of the crab’s diet. Gut content data of Hymenosoma sp., which identified detritus and benthic invertebrates as key food items (Whitfield 1989), supported our own SI results. The nitrogen values for Hymenosoma sp. confirmed that this species occupies a primary consumer TP (Fig. 4). A clear trophic association with detritus from the marsh grass S. maritima was also indicated for the salt marsh crab S. catenata, small mud crab S. serrata, the mudprawn U. africana, and the hermit crab D. brevirostris that inhabited the lower estuary during autumn and winter. In addition, the high δ13C values in the mugilids L. dumerilii, L. richardsonii and M. cephalus suggested that their dietary carbon was derived partially from detritus of S. maritima. This contribution of detritus from S. maritima in mugilid fishes in the lower estuary was expected since stomach content analysis of these species suggested that they feed predominantly on POM, unicellular algae and benthic plant material (Whitfield 1988). Furthermore, given the high mobility of mugilid fishes together with their ability to utilize different sources including detritus from Spartina, these species may play a role as habitat
couplers, as has been observed in other aquatic ecosystems (Schindler and Scheuerell 2002). In this context, the dominance of detritivores in the lower reaches suggests a donor control dynamic in which the rate of detrital input is a major factor influencing the trophic interactions within the macrobenthic community (Pimm 2002). It should be noted that our SIAR model might have overestimated the importance of marsh grass because of missing potential food sources such as filamentous algae colonizing Ruppia cirrhosa and Zostera capensis that are periodically abundant in littoral areas of the Kowie Estuary (Whitfield et al. 1994). Such epiphytes have been noted in the guts of some estuarine benthic invertebrates such as amphipods, brachyuran crabs and isopods (Whitfield 1989). In agreement with the SI results, the FA profiles of the dominant benthic consumers were distinct among estuarine regions. Differences in the ω3 and ω6 PUFAs (particularly 20:5ω3 and 22:6ω3) in the benthic fauna among different reaches of the estuary confirmed that the quality of their food sources differed spatially (Fig. 5). These FAs are dominant in benthic consumers from other temperate estuaries in the southern hemisphere (Alfaro et al. 2006; Richoux and Froneman 2008). Primary producers are the sources of 20:5ω3 and 22:6ω3, which are essential FAs since invertebrates and fishes depend on their supply through feeding, and they are key components necessary for consumer growth, reproduction and survival (Arts et al. 2001). Furthermore, the FAs 20:5ω3 and 16:1ω7 have been observed as major components in the MPB and POM (phytoplankton and detritus) in the Kowie Estuary (Bergamino et al. 2014), and they can therefore be used as indicators of these components. These FAs have been identified as a diatom-associated components in marine environments (Dunstan et al. 1993; Parrish et al. 2000), so the relative high levels of 20:5ω3 and 16:1ω7 in the profiles of the benthic consumers may indicate a dominance of diatoms (benthic or pelagic) at the base of the Kowie Estuary food web during all seasons. The PUFAs 18:2ω6 and 18:3ω3 are dominant in estuarine vascular plants like S. maritima (Richoux and Froneman 2008; Bergamino et al. 2014), and they can be incorporated into consumer tissues (Richoux and Froneman 2008). These FAs were present in significant amounts only in the brachyuran crabs (mostly in the S. catenata and the small mud crab S. serrata), mudprawns U. africana and hermit crabs from the lower reaches where marsh grasses occur. Like the SI results, these FA results provide evidence of the assimilation of plant detritus by local consumers. However, the FA profiles in Hymenosoma sp., the mugilid species L. dumerilii and M. cephalus differed from the other primary consumers in the lower estuary and did not reflect assimilation of marsh grasses, whereas Richoux and Froneman (2008) reported small amounts of the PUFAs 18:2ω6 and 18:3ω3 in Hymenosoma sp. inhabiting the nearby Kariega Estuary. The lack of congruence between our FA
Estuaries and Coasts
and SI signatures in these species from the Kowie Estuary may suggest that increased sample sizes are needed for the lipid analysis to accommodate large interindividual variability in consumer diets. The spatial variations in the relative importance of organic matter sources supporting estuarine consumers were consistent with other studies in estuarine environments using SI as trophic tracers (e.g. Deegan and Garritt 1997; Richoux and Froneman 2007; Hoeinghaus et al. 2011; Claudino et al. 2013; Dubois et al. 2014). These works showed that consumers tend to assimilate carbon from local production rather than allochthonous sources. The contributions of salt marsh grasses to the diets of estuarine animals vary with the region studied and the local environmental conditions (Peterson et al. 1985; Deegan and Garritt 1997; Kwak and Zedler 1997; Riera et al. 1999; Kang et al. 2003; Hoeinghaus and Davis 2007). Furthermore, the relative trophic contribution of salt marsh material to consumers is associated with the size of salt marsh patches (Guest and Connolly 2006). Thus, the question of salt marsh inputs should be a subject of further research to determine how extensive (at large scales) are the contributions of this carbon source to food webs within different estuaries. Given this important role of the marsh habitat in providing trophic resources, the loss of marsh habitats could negatively affect estuarine biodiversity in many regions (Deegan et al. 2012). Our data represent evidence of different seasonal changes in the isotopic signatures of consumers within each estuarine reach (Fig. 2). These seasonal isotopic changes may be induced by annual variations in environmental features, perhaps mainly determined by seasonal pulses of freshwater discharge (Riera and Richard 1997; McLeod et al. 2010; Antonio et al. 2012; Olin et al. 2013). The highest freshwater discharge in October and November 2012 through the Kowie River invariably brought copious amounts of nutrients and resulted in increased production of phytoplankton (e.g. Froneman 2001). Increased inputs of terrestrial detritus likely follow the high rainfall periods. River phytoplankton and terrestrial C3 plants are characterized by low δ13C signatures that range from −23 to −30‰ (Fry and Sherr 1984). Therefore, the low δ13C signatures in estuarine benthic consumers relative to POM in autumn in the three estuarine regions likely resulted from increased assimilation of low δ13C components during periods of high freshwater discharge. On the other hand, during periods of low freshwater discharge, the estuary may be dominated by marine phytoplankton, resulting in high δ13C signatures that were in turn reflected in consumers. Regarding δ15N, the higher values during summer and spring could be explained by high rates of denitrification processes promoted by the elevated temperatures during summer that lead to loss of isotopically light 14N and result in an enrichment of the remaining N pools (Baeta et al. 2009). As such, a combination of changes in abiotic variables such as river discharge and biochemical processes such as denitrification may all
contribute to the seasonal variability in the isotopic values in consumers and food sources in the Kowie Estuary. In summary, our results provided evidence of spatial and temporal variations in an estuarine food web. Relatively high δ13C values and increased FAs from higher plants were reflected in the benthic fauna inhabiting the lower reaches of the estuary. These tracer data indicated a greater utilization of marsh grass detritus as a food source for detritivores in the lower estuary. This pattern contrasted with consumers in the upper and middle reaches, which relied primarily on POM together with small invertebrates as their main food sources. We suggest that the input of detrital material from marsh grasses to the estuarine system represents an important carbon pathway, particularly in intertidal zones and shallow waters, which affects the faunal community structure. Our results also highlighted the importance of considering spatial and temporal approaches in food web studies of dynamic environments such as estuaries. Acknowledgements This research was funded by the Sandisa Imbewu Initiative at Rhodes University, the Water Research Commission of South Africa, and the National Research Foundation of South Africa. We thank Tatenda Dalu for sharing the stable isotope data of some food sources, and Katherina Schoo, Matthew Parkinson, and Mandla Magoro for field assistance. In addition, one anonymous referee provided valuable comments that helped us significantly improve the quality of our manuscript.
References Akin, S., K.O. Winemiller, and F.P. Gelwick. 2003. Seasonal and spatial variation in fish and macrocrustacean assemblage structure in Mad Island Marsh estuary, Texas. Estuarine Coastal and Shelf Science 57: 269–282. Alfaro, A.C., F. Thomas, L. Sergent, and M. Duxbury. 2006. Identification of trophic interactions within an estuarine food web (northern New Zealand) using fatty acid biomarkers and stable isotopes. Estuarine, Coastal and Shelf Science 70: 271–286. Antonio, E.S., A. Kasai, M. Ueno, Y. Ishihi, H. Yokoyama, and Y. Yamashita. 2012. Spatial-temporal feeding dynamics of benthic communities in an estuary-marine gradient. Estuarine, Coastal and Shelf Science 112: 86–97. Arts, M.T., R.G. Ackman, and B.J. Holub. 2001. “Essential fatty acids” in aquatic ecosystems: a crucial link between diet and human health and evolution. Canadian Journal of Fisheries and Aquatic Sciences 58: 122–137. Attrill, M.J. 2002. A testable linear model for diversity trends in estuaries. Journal of Animal Ecology 71: 262–269. Baeta, A., R. Pinto, I. Valiela, P. Richard, N. Niquil, and J.C. Marques. 2009. δ15N and δ13C in the Mondego estuary food web: seasonal variation in producers and consumers. Marine Environmental Research 67: 109–116. Bergamino, L., T. Dalu, and N.B. Richoux. 2014. Spatial and temporal changes in sediment organic matter composition within an estuarine environment: stable isotope and fatty acid analyses. Hydrobiologia. doi:10.1007/s10750-014-1853-1. Boecklen, W.J., T.C. Yarnes, B.A. Cook, and A.C. James. 2011. On the use of stable isotopes in trophic ecology. Annual Review of Ecology, Evolution, and Systematics 42: 411–440.
Estuaries and Coasts Bok, A. 1983. The demography, breeding biology and management of two mullet species (Pisces: Mugilidae) in the Eastern Cape, South Africa. Bouillon, S., N. Koedam, W. Baeyens, B. Satyanarayana, and F. Dehairs. 2004. Selectivity of subtidal benthic invertebrate communities for local microalgal production in an estuarine mangrove ecosystem during the post-monsoon period. Journal of Sea Research 51: 133–144. Bouma, T.J., M.B. De Vries, E. Low, L. Kusters, P.M.J. Herman, I.C. Tanczos, S. Temmerman, A. Hesselink, P. Meire, and S. van Regenmortel. 2005. Flow hydrodynamics on a mudflat and in salt marsh vegetation: identifying general relationships for habitat characterizations. Hydrobiologia 540: 259–274. Claudino, M.C., P.C. Abreu, and A.M. Garcia. 2013. Stable isotopes reveal temporal and between-habitat changes in trophic pathways in a southwestern Atlantic estuary. Marine Ecology Progress Series 489: 29–42. Connolly, R.M., D. Gorman, and M.A. Guest. 2005. Movement of carbon among estuarine habitats and its assimilation by invertebrates. Oecologia 144: 684–691. Currin, C.A., S.Y. Newell, and H.W. Paerl. 1995. The role of standing dead Spartina alterniflora and benthic microalgae in salt marsh food webs: considerations based on multiple stable isotope analysis. Marine Ecology Progress Series 121: 99–116. Cyrus, D.P. 1988. Episodic events and estuaries: effects of cyclonic flushing on the benthic fauna and diet of Solea bleekeri (Teleostei) in Lake St Lucia on the south-eastern coast of Africa. Journal of Fish Biology 33(Supplement A): 1–7. Dalsgaard, J., M. St. John, G. Kattner, D. Müller-Navarra, and W. Hagen. 2003. Fatty acid trophic markers in the pelagic marine environment. Advances in Marine Biology 46: 225–340. Day, J.H. 1969. A guide to marine life on South African shores. Cape Town: A.A. Balkema. Deegan, L.A., and R.H. Garritt. 1997. Evidence for spatial variability in estuarine food webs. Marine Ecology Progress Series 147: 31– 47. Deegan, L.A., D.S. Johnson, R.S. Warren, B.J. Peterson, J.W. Fleeger, S. Fagherazzi, and W.M. Wollheim. 2012. Coastal eutrophication as a driver of salt marsh loss. Nature 490: 388–392. Dubois, S., H. Blanchet, A. Garcia, M. Massé, R. Galois, A. Grémare, K. Charlier, G. Guillou, P. Richard, and N. Savoye. 2014. Trophic resource use by macrozoobenthic primary consumers within a semi-enclosed coastal ecosystem: stable isotope and fatty acid assessment. Journal of Sea Research 88: 87–99. Dunstan, G.A., J.K. Volkman, and S.M. Barrett. 1993. Essential polyunsaturated fatty acids from 14 species of diatom (Bacillariophyceae). Phytochemistry 35: 155–161. Fox, S.E., M. Teichberg, Y.S. Olsen, L. Heffner, and I. Valiela. 2009. Restructuring of benthic communities in eutrophic estuaries: lower abundance of prey leads to trophic shifts from omnivory to grazing. Marine Ecology Progress Series 380: 43–57. Froneman, P.W. 2001. Seasonal changes in zooplankton biomass and grazing in a temperate estuary, South Africa. Estuarine, Coastal and Shelf Science 52: 543–553. Froneman, P.W., and T.O. Henninger. 2009. The influence of prolonged mouth closure on selected components of the hyperbenthos in the littoral zone of the temporarily open/closed Kasouga Estuary, South Africa. Estuarine, Coastal and Shelf Science 83: 326–332. Fry, B. 2006. Stable isotope ecology. New York: Springer. Fry, B., and E.B. Sherr. 1984. δ13C measurements as indicators of carbon flow in marine and freshwater ecosystems. Contributions in Marine Science 27: 13–47. Gning, N., F. Le Loc’h, O.T. Thiaw, C. Aliaume, and G. Vidy. 2010. Estuarine resources use by juvenile Flagfin mojarra (Eucinostomus melanopterus) in an inverse tropical estuary (Sine Saloum, Senegal). Estuarine, Coastal and Shelf Science 86: 683–691.
Guest, M.A., and R.M. Connolly. 2006. Movement of carbon among estuarine habitats: the influence of saltmarsh patch size. Marine Ecology Progress Series 310: 15–24. Guest, M.A., R.M. Connolly, and N.R. Loneragan. 2004. Carbon movement and assimilation by invertebrates in estuarine habitats at a scale of meters. Marine Ecology Progress Series 278: 27–34. Hammer, Ø., D.A.T. Harper, and P.D. Ryan. 2001. PAST: palaeontological statistics software package for education and data analysis. Palaeontologia Electronica 4: p 9. Available at: palaeoelectronica.org/2001_1/past/issue1_01.htm. Heinecken, TJ.E., and J.R. Grindley. 1982. Estuaries of the Cape Part II: synopses of available information on individual systems. Report No. 10: Kowie. CSIR Research Report 409. Herman, P.M.J., J.J. Middelburg, J. Van De Kopple, and C.H.R. Heip. 1999. Ecology of estuarine macrobenthos. Advances in Ecological Research 29: 195–240. Hoeinghaus, D.J., and S.E. Davis III. 2007. Size-based trophic shifts of salt-marsh dwelling blue crabs elucidated by dual stable C and N isotope analyses. Marine Ecology Progress Series 334: 199–204. Hoeinghaus, D.J., J.P. Vieira, C.S. Costa, C.E. Bemvenuti, K.O. Winemiller, and A.M. Garcia. 2011. Estuary hydrogeomorphology affects carbon sources supporting aquatic consumers within and among ecological guilds. Hydrobiologia 673: 79–92. Indarti, E., M.I.A. Majid, R. Hashim, and A. Chong. 2005. Direct FAME synthesis for rapid total lipid analysis from fish oil and cod liver oil. Journal of Food Composition and Analysis 18: 161–170. James, N.C., and T.D. Harrison. 2010. A preliminary survey of the estuaries on the southeast coast of South Africa, Cape Padrone— Great Fish River, with particular reference to the fish fauna. Transactions of the Royal Society of South Africa 90: 411–417. Kang, C.K., J.B. Kim, K.S. Lee, P.Y. Lee, and J.S. Hong. 2003. Trophic importance of benthic microalgae to macrozoobenthos in coastal bay systems in Korea: dual stable C and N isotope analyses. Marine Ecology Progress Series 259: 79–92. Keats, R.A., L.J. Osher, and H.A. Neckles. 2004. The effect of nitrogen loading on a brackish estuarine faunal community: a stable isotope approach. Estuaries 27: 460–471. Kruskal, J.B., and M. Wish. 1978. Multidimensional scaling. Beverly Hills: Sage Publications. Kwak, T.J., and J.B. Zedler. 1997. Food web analysis of southern California coastal wetlands using multiple stable isotopes. Oecologia 110: 262–277. Lucas, J.S. 1980. Australian species: systematics and biology 33: 148– 247. Martinez del Rio, C., N. Wolf, S.A. Carleton, and L.Z. Gannes. 2009. Isotopic ecology ten years after a call for more laboratory experiments. Biological Reviews 84: 91–111. McClelland, J.W., and I. Valiela. 1998. Changes in food web structure under the influence of increased anthropogenic nitrogen inputs to estuaries. Marine Ecology Progress Series 168: 259–271. McCutchan, J.H., W.M. Lewis, C. Kendall, and C.C. McGrath. 2003. Variation in trophic shift for stable isotope ratios of carbon, nitrogen, and sulfur. Oikos 102: 378–390. McLeod, R.J., S.R. Wing, and J.P. Davis. 2010. Habitat conversion and species loss alters the composition of carbon sources to benthic communities. Marine Ecology Progress Series 411: 127–136. McLusky, D.S., and M. Elliott. 2004. The estuarine ecosystem: ecology, threats and management, third ed. Oxford: Oxford University Press. Odum, W.E., and E.J. Heald. 1972. Trophic analyses of an estuarine mangrove community. Bulletin of Marine Science 22: 671–738. Olin, J., N. Hussey, S. Rush, G. Poulakis, C. Simpfendorfer, M. Heupel, and A. Fisk. 2013. Seasonal variability in stable isotopes of estuarine consumers under different freshwater flow regimes. Marine Ecology Progress Series 487: 55–69. Olsen, Y.S., S.E. Fox, M. Teichberg, M. Otter, and I. Valiela. 2011. δ15N and δ13C reveal differences in carbon flow through estuarine benthic
Estuaries and Coasts food webs in response to the relative availability of macroalgae and eelgrass. Marine Ecology Progress Series 421: 83–96. Parnell, A.C., R. Inger, S. Bearhop, and A.L. Jackson. 2010. Source partitioning using stable isotopes: coping with too much variation. PloS One 5: e9672. Parrish, C.C., T.A. Abrajano, S.M. Budge, R.J. Helleur, E.D. Hudson, K. Pulchan, and C. Ramos. 2000. Lipid and phenolic biomarkers in marine ecosystems: analysis and applications. In The handbook of environmental chemistry, vol. 5, 193–223. Berlin: Springer. Peterson, B.J., and B. Fry. 1987. Stable isotopes in ecosystem studies. Annual Review of Ecology and Systematics 18: 293–320. Peterson, B.J., R.W. Howarth, and R.H. Garritt. 1985. Multiple stable isotopes used to trace the flow of organic matter in estuarine food webs. Science 227: 1361–1363. Pimm, S.L. 2002. Food webs. New York: Chapman and Hall. Post, D.M. 2002. Using stable isotopes to estimate trophic position: models, methods, and assumptions. Ecology 83: 703–718. Post, D.M., C.A. Layman, D.A. Arrington, G. Takimoto, J. Quattrochi, and C.J. Montana. 2007. Getting to the fat of the matter: models, methods and assumptions for dealing with lipids in stable isotope analyses. Oecologia 152: 179–189. Power, M., K. Guiguer, and D.R. Barton. 2003. Effects of temperature on isotopic enrichment in Daphnia magna: implications for aquatic food-web studies. Rapid Communications in Mass Spectrometry 17: 1619–1625. Richoux, N.B., and P.W. Froneman. 2007. Assessment of spatial variation in carbon utilization by benthic and pelagic invertebrates in a temperate South African estuary using stable isotope signatures. Estuarine, Coastal and Shelf Science 71: 545–558. Richoux, N.B., and P.W. Froneman. 2008. Trophic ecology of dominant zooplankton and macrofauna in a temperate, oligotrophic South African estuary: a fatty acid approach. Marine Ecology Progress Series 357: 121–137. Riera, P., and P. Richard. 1997. Temporal variation of δ13C in particulate organic matter and oyster Crassostrea gigas in Marennes-Oleron Bay (France): effect of freshwater inflow. Marine Ecology Progress Series 147: 105–115. Riera, P., L.J. Stal, J. Nieuwenhuize, P. Richard, G. Blanchard, and F. Gentil. 1999. Determination of food sources for benthic invertebrates
in a salt marsh (Aiguillon Bay, France) by carbon and nitrogen stable isotopes: importance of locally produced sources. Marine Ecology Progress Series 187: 301–307. Schindler, D.E., and M.D. Scheuerell. 2002. Habitat coupling in lake ecosystems. Oikos 98: 177–189. Schumann, E.H., R.R.W. Gray, and R.W. Shone. 2001. Tidal flow structures and sedimentation in the lower Kowie estuary, Port Alfred, South Africa. Transactions of the Royal Society of South Africa 56: 11–24. Serrano, O., L. Serrano, M.A. Mateo, I. Colombini, L. Chelazzi, E. Gagnarli, and M. Fallaci. 2008. Acid washing effect on elemental and isotopic composition of whole beach arthropods: implications for food web studies using stable isotopes. Acta Oecologica 34: 89– 96. Volkman, J.K., S.M. Barrett, S.I. Blackburn, M.P. Mansour, E.L. Sikes, and F. Gelin. 1998. Microalgal biomarkers: a review of recent research developments. Organic Geochemistry 29: 1163–1179. Vorsatz, J.P. 2009. Ecological role of estuarine brachyuran crabs in mangrove and salt marsh estuaries, Eastern Cape, South Africa. PhD thesis, University of Port Elizabeth, South Africa. Wasserman, R.J. 2012. Feeding ecology of the early life-history stages of two dominant gobiid species in the headwaters of a warm-temperate estuary. Estuarine, Coastal and Shelf Science 109: 11–19. Whitfield, A.K. 1988. The fish community of the Swartvlei Estuary and the influence of food availability on resource utilisation. Estuaries 11: 160–170. Whitfield, A.K. 1989. The benthic invertebrate community of a southern cape estuary: structure and possible food sources. Transactions of the Royal Society of South Africa 47: 159–179. Whitfield, A.K. 1998. Biology and ecology of fishes in South African estuaries. Ichthyological monographs of the J.L.B. Smith Institute of Ichthyology 2: 1–223. Whitfield, A.K., A.W. Paterson, A.H. Bok, and H.M. Kok. 1994. A comparison of the ichthyofaunas in two permanently open eastern Cape estuaries. South African Journal of Zoology 29: 175–185. Whitfield, A.K., M. Elliott, A. Basset, S.J.M. Blaber, and R.J. West. 2012. Paradigms in estuarine ecology—a review of the Remane diagram with a suggested revised model for estuaries. Estuarine, Coastal and Shelf Science 97: 78–90.