Advances in Cognitive Psychology
2007 • volume 3 • no 1-2 • 153-165
Spatio-temporal low-level neural networks account for visual masking Uri Polat, Anna Sterkin, and Oren Yehezkel
Goldschleger Eye Research Institute, Tel-Aviv University, Sheba Medical Center, 52621 Tel-Hashomer, Israel Received 06.09.2006 Accepted 07.02.2007
Keywords temporal processing, visual masking, spatio-temporal interactions, temporal masking, visual evoked potentials, psychophysics
Abstract
separation that did not evoke inhibition from the target’s vicinity and with a temporal sequence
Temporal masking is a paradigm that is wide-
that preceded the target, or when it was present-
ly used to study visual information processing.
ed simultaneously with it, but not when the tar-
When a mask is presented, typically within less
get preceded the mask. We propose that masking
than 100 msec before or after the target, the re-
effects, either suppression or facilitation, reflect
sponse to the target is reduced. The results of our
integration into the spatial and the temporal do-
psychophysical and visual evoked potential (VEP)
mains of the feedforward response to the target
experiments show that the masking effect criti-
and the lateral inputs evoked by the mask (excit-
cally depends on a combination of several factors:
atory and/or inhibitory). Because the excitation
(1) the processing time of the target, (2) the or-
evoked by the mask develops and propagates
der of presentation of the target and the mask,
slowly from the mask’s location to the target’s lo-
and (3) the spatial arrangement of the target and
cation, it lags behind the response to the target.
the mask. Thus, the masking effect depends on
On the other hand, inhibition that is produced in
the spatial-temporal combination of these fac-
the vicinity of the target evolves more rapidly and
tors. Suppression was observed when the mask
follows the onset and offset of the stimulus more
was positioned within a spatial range that was
closely. Thus, lateral excitation that overcomes
found to evoke inhibition, and when the tempo-
the inhibition may facilitate the grouping of local
ral separation between the target and the mask
elements into a global percept by increasing the
was short. In contrast, lateral facilitation was ob-
survivability of the object and its accessibility for
served when the mask was presented at a spatial
perceptual awareness.
Introduction
response is influenced by the mask can be interpreted
Masking is a tool that is widely used to study information processing. When a mask is presented, typically less than 100 ms before or after the target, the target’s visibility is reduced – an effect that is usually inferred as suppression (Breitmeyer, 1984; Breitmeyer & Öğmen, 2000; Enns & Di Lollo, 2000; Francis, 2000). As the inter-stimulus interval (ISI) between the mask and the target increases, the masking effect is reduced; the time-window during which the target
as the time-window of interactions. The masking effect is typically inferred from a comparison of the target’s visibility under two different conditions: the target alone and the target within the context of a mask. However, the neural representation of the same target under these two conditions may be difCorrespondence concerning this article should be addressed to Uri Polat, Goldschleger Eye Research Institute, Tel-Aviv University, Sheba Medical Center, 52621 Tel-Hashomer, Israel. Email:
[email protected]
153 DOI: 10.2478/v10053-008-0021-4
http://www.ac-psych.org
Uri Polat, Anna Sterkin, and Oren Yehezkel
ferent, and therefore, the masking should be probed by
poral stimuli attributes that can be summarized in a
comparing between a local process (feedforward, target
descriptive model with the following main factors: (1)
alone) and spatial integration that is context-dependent
the processing time of the target, (2) the presentation
(feedforward and lateral interactions). The effects of
order of the target and the mask, and (3) the spatial
context modulation, which may enable grouping of local
arrangement of the target and the mask.
elements into a global percept (Gestalt) were demon-
1. Processing time. An estimate of the persist-
strated in many psychophysical (Bonneh & Sagi, 1998;
ence or the integration time of the target response
Herzog & Fahle, 2002; Kovacs, 1996; Polat, 1999; Polat
taken from physiological experiments (Albrecht, 1995;
& Sagi, 1993, 1994) and physiological studies (Bauer
Mizobe et al., 2001; Polat, Mizobe, Pettet, Kasamatsu,
& Heinze, 2002; Chavane, Monier, Bringuier, Baudot,
& Norcia, 1998) provides an upper limit of 200 ms.
Borg-Graham, Lorenceau, & Fregnac, 2000; Kapadia,
This estimate is consistent with psychophysical results
Ito, Gilbert, & Westheimer, 1995; Kapadia, Westheimer,
showing that the integration time for contrast detec-
& Gilbert, 2000; Li & Gilbert, 2002; Mandon & Kreiter,
tion at threshold is 160-200 ms (Watson, Barlow, &
2005; Mizobe, Polat, Pettet, & Kasamatsu, 2001; Polat &
Robson, 1983) and with results from our laboratory
Norcia, 1996; Schmidt, Goebel, Lowel, & Singer, 1997;
(Rosen, Belkin, & Polat, 2005). We assume that a
Sugita, 1999), for a review, see (Series, Lorenceau, &
mask presented beyond this time-window will fail to
Fregnac, 2003). These studies clearly show that the
affect the response to the target.
neural representation of a target is modulated with re-
2. Interactions: excitation vs. inhibition. The
gard to the surround stimuli. It is also apparent from
results of Polat and Sagi (2006) showed that temporal
these studies that the outcome of contextual modula-
masking is affected by the order of presentation of the
tion is complex; it is mostly suppressive but may also
target and the mask as well as the spatial separation
be facilitative in some spatial-temporal combinations.
between them, which can be explained by the tempo-
The nature (either facilitation or suppression) and the
ral and spatial properties of excitation and inhibition.
strength of the context effects are determined by several
Dynamics. Temporal masking can be accounted for
parameters such as proximity, similarity, contrast, and
by assuming different time courses for excitatory and
global configuration.
inhibitory interactions. Whereas excitation develops
Traditionally, masking is treated separately in the
slowly and is sustained, lagging behind the stimulus
spatial and temporal domains (Breitmeyer, 1984). In
both in onset and offset, inhibition is rapid and tran-
the temporal domain, when the mask precedes the
sient, thus following the onset and offset of the stimu-
target, it is termed forward masking (FM), whereas
lus more closely.
mask presentation following the disappearance of the
Spatial architecture. Several models of lateral interac-
target is termed backward masking (BM). Most of the
tions assume that excitatory and inhibitory connections
temporal masking studies have focused on BM, less
form a neuronal network that determines the measured
on FM, whereas simultaneous masking (SM) has been
responses (Adini & Sagi, 2001; Adini, Sagi, & Tsodyks,
typically treated as a separate condition, most likely
1997; Polat, 1999; Polat et al., 1998). It is assumed that
due to the lack of a temporal mismatch between the
each network unit receives three types of visual input:
target and the mask.
(1) direct thalamic-cortical input, (2) lateral input from
In the spatial domain, the literature on masking distin-
other units within the network, and (3) top-down feed-
guishes between pattern masking (mask and target pre-
back. These inputs can be subdivided into excitatory and
sented at the same retinal location) and metacontrast (the
inhibitory types. The lateral excitation is organized along
mask location does not overlap with the target location,
the filters’ optimal orientation, forming a collinear field
also termed lateral masking). This distinction is based on
(Polat & Norcia, 1998; Polat & Tyler, 1999), and is super-
an implicit assumption that sharp boundaries that allow a
imposed on a suppressive area surrounding the filters.
visually apparent gap between the target and the mask
Propagation time. It has been suggested that the
indicate a distinct activation of different receptive fields.
size of the receptive fields in V1 is estimated to be
However, within the context of neuronal modeling, an im-
between 2 to 3λ (Mizobe et al., 2001; Polat, 1999;
portant factor is the overlap between the receptive fields
Polat & Norcia, 1996; Polat & Sagi, 1993; Watson et
of the responding units, which may account for lateral
al., 1983; Zenger & Sagi, 1996). Thus, masking effects
interference regardless of whether the physical stimuli
from target-to-mask separations of 2λ or less may
overlap or not. We will address this important issue next.
be considered as integration (or summation) within
Our working hypothesis is that the masking effect
the same receptive field (pattern masking), whereas
critically depends on a combination of spatial and tem-
separations of 3λ or more activate lateral interactions
154 http://www.ac-psych.org
Spatio-temporal dynamics of visual masking
between different neurons responding to the target
havioral U–shaped masking function, which was thought
and the mask (lateral masking). Masking effects from
to reflect visual masking due to recurrent processing
outside the receptive field propagate to the target’s
(Bridgeman, 1988). A modulation around this latency has
location through lateral connections, which are rela-
been found in single neuron activity in the cat and mon-
tively slow compared with the direct input received
key striate cortex (Bridgeman, 1975, 1980).
by the receptive field. The estimated propagation
Interestingly, a recent MEG study compared meta-
speed of lateral excitation derived from psychophysi-
contrast masking with variable stimulus onset asyn-
cal studies is about 3 degrees per sec (Cass & Spehar,
chrony using effective vs. pseudo mask (van Aalderen-
2005; Tanaka & Sagi, 1998), in agreement with the
smeets, Oostenveld, & Schwarzbach, 2006). In order to
estimates from intracellular and optical imaging meas-
determine whether the perceptual effect on the target’s
urements (Bringuier, Chavane, Glaeser, & Fregnac,
visibility is reflected in the corresponding component of
1999; Malonek, Tootell, & Grinvald, 1994; Series et
the VEPs, around 250 ms, a control condition was in-
al., 2003). Therefore, facilitation is possible only if the
troduced – a pseudo mask. In contrast to an effective
propagation of the excitatory input from the mask to
mask, the pseudo mask did not share similar features
the target is not delayed by a period longer than the
but otherwise was similar to the effective mask (similar
integration time of the feedforward input.
physical qualia, different shape). The pseudo mask did
3. Pattern vs. lateral masking. Most of the mask-
not produce behavioral masking. However, the lack of a
ing studies used targets and masks that can be regarded
distinction in the VEPs’ amplitudes, around 250 ms, be-
as broadband stimuli in the spatial domain, and thus
tween trials presenting effective vs. pseudo masks, led
may be detected by receptive fields of different sizes.
to the conclusion that this late visual component cannot
Therefore, it is likely that larger receptive fields respond
be taken as evidence for effective backward metacon-
both to the target and the mask. Thus, the masking ef-
trast masking. On the other hand, a post-perceptual
fect may be related to interactions within the same re-
component, around 340 ms, located over the temporal-
ceptive field, resulting in pattern masking. For example,
parietal cortex, clearly showed the effect of visibility. The
in these studies it is impossible to differentiate between
latter finding was interpreted as a contribution of work-
pattern and lateral masking, and the observed results
ing memory-related processes to metacontrast. Results
may be confounded by both types of masking. Thus, an
of this study challenge Bridgeman’s conclusion, sug-
important factor in masking is the overlap between the
gesting that the observed U-shaped modulation of VEP
receptive fields of the responding units, which may ac-
amplitude may reflect temporal interactions between the
count for lateral interference, regardless of whether the
target and the mask, unrelated to the target’s visibility.
physical stimuli overlap or not.
However, the spatial characteristics of the mask, such
In this study we also sought to find the neurophysio-
as its shape, the sharpness of its edges, and the pos-
logical correlates for the masking effect with the same
sibility of a consequent overlap with the visual field of
stimuli that we used in the behavioral BM experiment
the target are of critical importance (see factor 3 of our
and to compare our observations with previous findings
descriptive model). That is, the visually apparent lack of
in the literature. A particularly relevant EEG study by
pattern masking does not necessarily guarantee the lack
Jeffreys and Musselwhite (1986) investigated whether
of overlapping between the target and the mask within
metacontrast-related inhibition or suppression is reflected
the same receptive field.
in early components of the waveforms in visual evoked
Using VEP, we measured the interactions between the
potentials (VEPs), namely the C1 and C2 components.
target and the subsequent mask at different temporal
Scalp distributions of C1 and C2 reflect the respective
separations. We used the spatial separation that produc-
sites of origin in the striate and extrastriate visual cortex
es metacontrast masking (i.e., the target and the mask
(Jeffreys, 1971; Jeffreys & Axford, 1972). No effect of
activate separate receptive fields) under conditions that
metacontrast masking was found in C1 or C2 amplitudes;
provide behavioral facilitation of target visibility.
however, a clear U–shaped masking function in a separate psychophysical study was observed. An earlier EEG study (Schiller & Chorover, 1966) did not find evidence for
Methods
metacontrast masking effects in early VEP components as
Psychophysics
well. Bridgeman’s reanalysis of Jeffreys & Musselwhite’s data (Jeffreys & Musselwhite, 1986) revealed a U–shaped
Participants
modulation of the VEP amplitude of a later visual compo-
Ten subjects with normal or corrected-to-normal vi-
nent in the VEP, around 250 ms, corresponding to the be-
sion in both eyes participated in the experiments. Five
155 http://www.ac-psych.org
Uri Polat, Anna Sterkin, and Oren Yehezkel
ages (i.e., a single trial) at their own pace. Negative auditory feedback was provided. Contrast thresholds
T
were measured utilizing a staircase method, which SM
was shown to converge to 79% correct (Levitt, 1971). In this method, the target contrast is increased by 0.1 log units (26%), after an erroneous response, and
BM on T
is decreased by the same amount after three consecutive correct responses. About 40 trials were needed to estimate the threshold in each block. In addition, the
BM on SM
threshold of contrast detection of the target presented alone, in a range of durations from 30 to 500 ms, was
FM on T
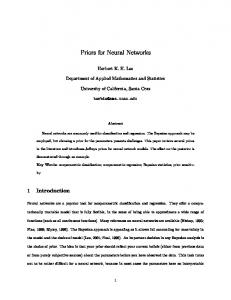
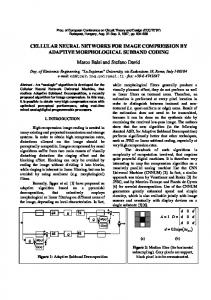
Figure 1. Example of stimuli used in this study. Three configurations of the target and masks were used in the temporal interaction experiments: simultaneous masking (SM), backward masking (BM), and forward masking (FM). The duration of presentation of the low-contrast target and the high-contrast mask was 60 ms in the psychophysical experiments and 50 ms in the VEP experiments. The masking effect was measured by comparing the responses under 5 conditions: (1) the target alone (T), (2) the target and mask presented simultaneously (simultaneous masking, SM), (3) the target followed by a mask (BM-on-T), (4) SM followed by a second mask (BM-on-SM), and (5) the target preceded by a mask (FM on T). The three levels of gray shading represent the three types of masking: forward, simultaneous, and backward.
tested monocularly (Figure 2), whereas the rest of the parameters remained unchanged as in the rest of the experiments. The masking paradigm included trials wherein the mask preceded the target (forward masking, FM), followed the target (backward masking, BM), or was presented simultaneously with the target (simultaneous masking, SM). The mask was composed of two Gabor patches, at a contrast of 40%, placed above and below the target, while the spatial distance between the target and each Gabor patch of the mask was constant in each experiment, either 2 or 3λ. The duration of the target and the mask presentation was 60 ms, while the ISIs between them were 0 ms (for SM), 60 or
subjects participated in the integration time experiment
180 ms (for BM), or -60 ms (for FM). Conditions under
and another 5 in the backward masking experiment.
which a second mask appeared after the SM were included to explore the effects of backward masking on
Stimuli
lateral interactions.
The stimuli were localized gray-level gratings
The mask with the shortest ISI constituted the
(Gabor patches) with a spatial frequency of 6 cycles
first mask (M1), whereas the mask with a longer ISI
per degree (cpd), modulated from a background luminance of 40 cd.m-2 (Fig. 1). Stimuli were presented
constituted the second mask (M2). The masking effect
binocularly on a Philips multiscan 107P color monitor,
under 5 conditions: (1) the target alone (T), (2) the
using a PC system. The effective size of the monitor
target and mask presented simultaneously (simul-
screen was 24 × 32 cm, which, at a viewing distance
taneous masking, SM), (3) the target followed by a
of 150 cm, subtends a visual angle of 9.2 × 12.2 de-
mask (BM-on-T), (4) SM followed by a second mask
grees. The subjects’ responses were recorded from a
(BM-on-SM), and (5) the target preceded by a mask
viewing distance of 150 cm, in a dark cubicle, wherein
(FM on T) (Fig. 1).
was measured by comparing the detection thresholds
the only ambient light came from the display screen. The threshold of contrast detection was measured using a two alternative forced choice (2AFC) paradigm, in which the target had to be detected in one of two successive presentations, separated by an interval of 800 ms with a random jitter of 500 ms to avoid con-
VEP method Participants Five subjects with normal or corrected-to-normal vision in both eyes participated in the experiments.
founding the responses upon anticipation of the onset of the trial. A visible fixation circle in the center of the
Stimuli
screen indicated the location of the target. Four visible
The target, similar to the target stimulus used in the
crosses were presented at the corners of the monitor,
psychophysical experiments, was presented at 1 Hz
at the same time with the target’s appearance, to avoid
for 50 ms at a contrast of 6% (at or very close to the
temporal uncertainty when presenting the target. The
detection threshold), with no change in the average
subjects activated the presentation of each pair of im-
background luminance. Backward masking, either on a
156 http://www.ac-psych.org
Spatio-temporal dynamics of visual masking
18
to the masks used in the psychophysical experiments.
16
The spatial distance between the target and the mask was 3λ. Each mask (either M1 or M2) was presented at the same spatial and temporal frequency, and for the same duration as the target. The mask was presented at ISIs of 0, 50, 150, or 250 ms (SOAs of 50, 100, 200, or 300 ms), following the target or the SM. The experimental conditions consisted of a target presented alone (T), SM, and all combinations of T or SM followed by masks at different ISIs (BM-on-T; BM-on-SM). As in the psychophysical experiments, the mask with the shortest ISI constituted the first mask (M1), whereas the mask with a longer ISI constituted the second mask (M2). Each condition consisted of 10
contrast threshold (%)
target alone or on SM, was tested using stimuli similar
14 12 10 8 6 4 2 0
0
50
100
Figure 2.
150
200
250
300
350
400
450
500
duration (ms)
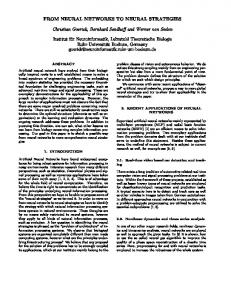
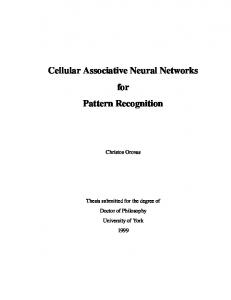
Integration time of a Gabor target at threshold. The contrast threshold (%, Y-axis) of the target detection for increasing durations of the target presentation (from 30 to 500 ms, X-axis) is shown (mean of 5 subjects ± SEM). The results show that the contrast threshold improves by more than a factor of two from the duration of 30 ms to 120 ms, followed by saturation.
trials (10 sec each), during which all the parameters
(N1 T or N1 SM). A prediction of the SM response was
were kept constant. Conditions were presented in ran-
calculated as the sum of the time courses evoked by T
dom order. A small, 2-minute arc fixation point, located
and M, each presented alone at the onset of the trial
at the center of the screen, indicated the T location.
(T+M). The correlation between the waveforms and/or
Participants were instructed to maintain fixation and
the amplitude modulation was regarded as the BM ef-
to avoid eye movements during the trials.
fect. The correlation, unless a particular time-window
VEP recording and signal processing: The EEG
was specified, was calculated for all the time courses;
was sampled at 432 Hz from a cruciform array of five
Peak amplitude comparisons between conditions were
electrodes centered at Oz and spaced by 3 cm. The
performed using the paired t-test.
recording channel with the highest statistical reliability (signal-to-noise ratio) was selected for group averages (the Oz). For every condition, the average VEPs were computed over a 1000-ms period, for 10 identical runs, each composed of 10 stimulus presentations (trials, a total of 100 trials per condition). The mean of two periods of 1000 ms each, at the beginning and at the end of each run, was taken as the baseline for the run. The amplitudes and the waveforms of the elicited responses for the various BM combinations were compared within time-windows defined according to the responses evoked by the T, M, and SM stimuli, at different delays relative to the beginning of the trial. The maximal amplitude of the first positive response peak was calculated in the corresponding time-window defined by the response to T or SM presented alone (P1 T or P1 SM). The maximal amplitude of the first positive response peak to the mask (i.e., the second positive peak response in the time courses under the
Results Integration time We first present data showing the integration time of the target (the threshold of contrast detection for a Gabor patch, 6 cpd) presented alone for a range of durations (Fig. 2). The results show that the contrast threshold improves by more than a factor of two from the duration of 30 ms to 120 ms, followed by saturation. This result is consistent with earlier results (Legge, 1978; Watson et al., 1983), indicating that efficient processing is performed during the first 120 ms of stimulus presentation, an observation that may pose an upper limit for efficient temporal masking.
Effect of target-to-mask spatial separation
BM conditions) was calculated in the time-window de-
Our aim was to test the effect of spatial separation (i.e.
fined according to responses evoked by M presented
the distance) on the masking effect. Two distances were
alone at different delays relative to the beginning of
tested: 2λ, which is assumed to have some overlapping
the trial, corresponding to the different ISIs tested
with the target location, and 3λ, where no overlapping
under BM conditions (P1 M1 or P1 M2). The maximal
with the target location is assumed, as discussed in the
amplitude (in absolute terms, i.e., the maximal deflec-
Introduction and Discussion (Fig. 3). The masking ef-
tion from baseline) of the first negative response peak
fect was measured as the log of the target’s threshold,
after P1 to T or SM was calculated in the time-window
normalized to the threshold of the target presented
defined by the response to T or SM presented alone
alone (i.e., the threshold elevation). Thus, positive
157 http://www.ac-psych.org
Uri Polat, Anna Sterkin, and Oren Yehezkel
threshold elevation (log units)
0.4
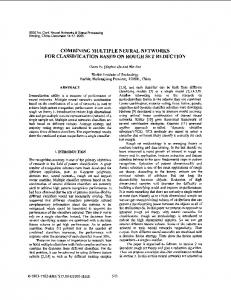
2) The results clearly show that SM, FM, and BM differ 2
0.3
in the way they affect the target response at an
3
ISI of 60 ms. FM produced facilitation at 3λ but
0.2
resulted in suppression at 2λ. SM produced facilitation at both distances. BM produced suppression at
0.1
2λ, but had no effect at 3λ. Thus, the observed in-
0
teraction between the effective integration time of
-0.1
the feedforward response and the delayed lateral response (due to a slow propagation time) seem to
-0.2
determine the perceptual masking effect.
-0.3 -100
-50
Figure 3.
0
50
100
150
200
ISI (ms)
Asymmetric temporal interactions. The masking effect is shown (measured as the elevation of the threshold of the target detection) at different ISIs and target-to-mask separations. The X-axis denotes the temporal order of the mask presentation: negative values indicate forward masking (FM), zero indicates simultaneous masking (SM), and positive values indicate backward masking (BM). The Y-axis denotes the threshold elevation (positive values indicate suppression; negative values indicate facilitation). The blue line (closed squares) presents the results for target-to-mask separations of 2λ and the red line (open squares) for 3λ.
It is possible that the asymmetric masking effect (FM vs. BM) observed above can be accounted for by differences between the temporal dynamics of the mask and the target responses and the interaction between them. It was previously shown that when the mask in SM was presented continuously after the target disappeared (with no ISI), the effect of the facilitation expected in SM disappeared (Polat & Sagi, 2006).
0.2
threshold elevation (log units).
Difference between BM-on-T and BM-on-SM
Here we investigated whether this temporal continuity
0.15
of the mask presentation is necessary for abrogating
0.1
the facilitatory effect of SM. BM-on-T was compared to BM-on-SM with both distances (2 and 3λ). The results,
0.05
SM 0 -0.05 -0.1 -0.15 -0.2
BM-on-T
BM-on-SM
BM-on-T 3
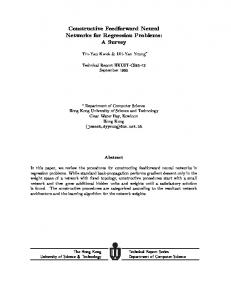
presented in Figure 4, clearly show that the facilitation at 3λ, which occurred during SM (p = .002, t-test), is not apparent when the same stimulus was followed
BM-on-T 2
by the second mask (BM-on-SM) (p = n.s., t-test). At
BM-on-SM 3
a separation of 2λ, in SM there is significant facilita-
BM-on-SM 2 SM 3
tion (p = .03, t-test), whereas in BM-on-SM there is
SM 2
no facilitation (p = n.s., t-test). In BM-on-T, at 3λ no
Figure 4. Comparison of BM-on-T, BM-on-SM and SM at 2 and 3λ. The elevation of the threshold of the target detection under the two BM conditions, as compared to SM, is shown. The Y-axis denotes the threshold elevation (positive values indicate suppression; negative values indicate facilitation). The results for BM-on-T (dots), BM-on-SM (vertical strips), and SM (horizontal strips) at 2 (blue) and 3λ (red) are presented (mean of 5 subjects ± SEM).
values indicate suppression, whereas negative values indicate facilitation. The results clearly show the effect
facilitation or suppression was observed (p = n.s., t-test), whereas at a separation of 2λ, there was suppression (p = .02, t-test). Thus, the appearance of a second mask at an ISI of 60 ms, after SM, interrupted the development of the expected facilitation. Similar results were observed for the 2λ separation.
Effect of contrast in BM-on-SM
of target-to-mask separation (2 and 3λ) and the asym-
It is still possible that the second mask under the
metry between the temporal conditions:
BM-on-SM condition abrogates the facilitation observed
1) The effect of distance on temporal masking can be
in SM by inhibiting the response to the first mask by
regarded as an effect from inside (2λ) and out-
reducing its visibility. In other words, the effect might
side (3λ) the receptive field (see Introduction).
be regarded as pattern masking of the first mask by the
Suppression is evident in BM and FM at 2λ, but
second. If true, the perceived contrast of the first mask
not at 3λ. Facilitation is evident at 2λ only in SM,
should be lower. It was shown earlier that even a low-
whereas at 3λ in FM and SM, but not in BM. For
contrast mask in SM still produces facilitation (Polat,
an ISI of 180 ms, however, no effect of temporal
1999). Therefore, one would expect that reducing the
masking was found for any distance.
perceived contrast of the first mask in BM-on-SM will
158 http://www.ac-psych.org
Spatio-temporal dynamics of visual masking
still result in facilitation. We repeated the BM-on-SM contrast of the first mask (%)
experiment for different contrast levels (7.5-60%) of the first mask (Figure 5, orange bars). The contrast of parison, the SM condition for the same mask contrasts was tested (Figure 5, blue bars). The results of the SM, presented in Figure 5, confirmed the earlier finding that facilitation is not dependent on the contrast of the first mask, and that this is valid between contrast levels of 7.5-60%, though the magnitude of the facilitation is slightly reduced for the lower contrast of the first mask. However, in BM-on-SM, the second mask abrogated the facilitation for all contrast levels (p < .0006, t-test), indicating that the effect of BM reduces the effective lateral interactions between the first mask and the target. Further support for this result comes from the VEP experiment, which is presented below.
VEP data – temporal resolution of the target and mask responses
0
threshold elevation (log units)
the second mask was kept constant, at 60%. For com-
7.5
15
-0.2 BM-on-SM -0.3
SM
Figure 5. Effect of contrast of the first mask under BM-on-SM. The BM-on-SM condition was tested with different contrast levels of the first mask (from 7.5 to 60%, X-axis). The contrast of the second mask was kept constant, at 60% and the target’s contrast detection threshold in this experiment was 5%. The results are presented as threshold elevation (Y-axis, positive values indicate suppression; negative values indicate facilitation). The target-to-mask separation was 3λ. Orange bars – BM-on-SM condition; blue bars – SM condition.
Waveforms and prediction
contrast T presented alone, M presented alone, and
amplitude (P1) of T is lower relative to P1 of M and
T M T+M
2.5 2
amplitude
the predicted SM response (T+M). The first positive
60
-0.1
Figure 6 presents the time courses evoked by a lowSM, averaged for the 5 subjects, in comparison with
30
1.5 1 0.5 0 −0.5
SM. Moreover, P1 latency of T is delayed by 50 ms,
−1
compared with a P1 latency of F and SM (210 ms,
0
100
200
300
400
500
600
700
800
900
1000
160 ms, 164 ms, T, M, and SM, respectively; averaged for 5 subjects) (Figure 6). Furthermore, a negative
The time course evoked by SM is significantly different from the predicted response (Figure 6), indicat-
2
amplitude
SM, but not evoked by T.
T+M SM
2.5
peak (N1) with a latency of 240 ms is evoked by M and
1.5 1 0.5 0 −0.5
ing a non-linear summation of the foveal and flank-
−1 0
ing components of SM. Moreover, although there is
100
200
300
400
500
600
700
800
900
1000
a very high correlation between M and SM (89.81%, p < .00001), there is a significant difference in the evoked under the two conditions (p = .035, t-test). Because the latency of the peak response to the T presented alone approaches the latency of the negative peak observed in M and SM, this difference between M and SM may reflect the contribution of the foveal low-contrast Gabor in SM. Figure 7 depicts the time course evoked under the two BM conditions, BM-on-T and BM-on-SM, at different ISIs, in comparison with the responses evoked by M presented at different delays, corresponding to the different ISIs tested under the BM conditions. Figure 8 summarizes the P1 values under the two BM conditions, both for the target and mask stimuli.
2
amplitude
amplitude of the negative peak, N1, in the responses
T M SM
2.5 1.5 1 0.5 0 −0.5 −1 0
100
200
300
400
500
time (ms)
600
700
800
900
1000
Figure 6. Evoked and predicted waveforms of visual evoked potentials. The average waveforms (time courses of 1000 ms, 5 subjects) of the visual evoked potentials (VEP) under three conditions are presented: the target presented alone (T, red line), the mask presented alone (M, green line), and the simultaneous masking (SM, blue line). The predicted time course for the SM (T+M, blue dashed line) was calculated as the linear sum of T and M. The time courses of T, F, and T+M are superimposed in the upper panel; T and T+M – in the middle panel; T, M, and SM – in the lower panel.
159 http://www.ac-psych.org
Uri Polat, Anna Sterkin, and Oren Yehezkel
BM−on−T
BM−on−SM
0
200
Figure 7.
400
600
time (ms)
800
1000
amplitude
0 50 150 250
amplitude
amplitude
0 50 150 250
M
0
200
400
600
time (ms)
800
1000
0
200
400
600
time (ms)
800
1000
Waveforms of visual evoked potentials under BM-on-T and BM-on-SM. The average waveforms (time courses of 1000 ms, 5 subjects) of the visual evoked potentials (VEP) in a single subject under the two BM conditions, BM-on-T (left panel) and BMon-SM (central panel) are shown. These waveforms are compared with the responses evoked by M presented alone at different delays relative to the beginning of the trial, corresponding to the different ISIs tested under BM conditions (right panel). The different ISIs tested under the BM conditions (0, 50, 150, or 250 ms) and the corresponding delays of M (50, 100, 200, or 300 ms) are coded with different colors.
Under the BM-on-T condition, at an ISI of 0 ms
(p = n.s., correlation of 88.24%, p < .00001, P1 of
(SOA = 50), the latency of the P1 of T (210 ms)
T time-window) and a second positive peak with the
coincides with the latency of the P1 of M (210 ms,
P1 of M when presented alone at the corresponding
i.e., 160 ms plus 50 ms of delay in onset). The
delay (p = n.s.; correlation of 86.45%, p < .00001,
waveform is highly similar to the SM condition
P1 of M time-window). At all ISIs except an ISI of
(p = n.s., t-test; correlation of 91.5% with SM,
50 ms, the amplitude of P1 of T did not differ from
first mask P1 time-window, maximal cross-cor-
the P1 amplitude of the target presented alone,
relation of 99.39%, achieved at a shift of 37 ms).
whereas the amplitude of P1 of M remained similar
Thus, BM with ISI = 0 results in a “fused” response
to P1 of M when presented alone in all ISIs (Fig. 8).
pattern, i.e., as if the T and the M were presented
Under the BM-on-SM condition, at an ISI of 0 ms,
simultaneously. Therefore, it is impossible to de-
the second mask (M2), in fact, is a direct continuation
compose the signal into independent responses to
of the first mask (i.e., a mask duration of 100 ms). The
the T and M stimuli. At an ISI of 50 ms, the re-
evoked response is similar to SM when presented alone
sponses to T and M are not yet separated; however,
(p = n.s., t-test; correlation of 86.7%, p < .00001),
starting from an ISI of 150 ms, the two response
indicating that the additional 50 ms of mask dura-
peaks (P1 T and P1 M) can be clearly separated.
tion do not affect the response. However, already
That is, there is a high similarity between the first
at an ISI of 50 ms, the latencies of the P1 of SM
positive peak with the P1 of T when presented alone
(164 ms) and the mask are clearly separated (the la-
160 http://www.ac-psych.org
Spatio-temporal dynamics of visual masking
tency of P1 of M is 260 ms). P1 of SM is highly correlat-
BM−on−T
ed and has an amplitude similar to the time course of of 99.46%, p < .00001, first mask P1 time-window), but P1 of M is significantly suppressed (p = .0277, t-test; no significant correlation with M when presented alone at the corresponding delay, p < .00001, second mask P1 time-window). However, for an ISI of 150 ms and longer, P1 of M almost “recovers”
P1 of T P1 of M
1.4
amplitude normalized by T
SM when presented alone (p = n.s., t-test; correlation
1.2
1
0.8
0.6
0.4
(p = n.s., t-test; correlation of 70.77% with M
0.2 T
when presented alone at the corresponding delay,
0
50
ISI (ms)
150
250
p < .00001, second mask P1 time-window). At an ISI of 250 ms, there is a high correlation between the
BM−on−SM
first positive peak with the P1 of SM when presented peak with the P1 of M when presented alone with the corresponding delay (76.42%). Regarding the N1 peak (a delay of 240 ms), a significant effect (i.e., a reduction of amplitude in absolute terms) under the BM-on-SM condition was observed only at an ISI of 50 ms (p = .0023, t-test), whereas under the BM-on-T condition there is a trend (although not significant) for a more negative N1 at an ISI of 0 ms.
Discussion In this study our working hypothesis was that masking effects, either suppression or facilitation, reflect integration into the spatial and the temporal domains of the feedforward response to the target and the lateral inputs evoked by the mask (excitatory and/or inhibitory). It was found that when masking of a single target was explored, the expected suppression ef-
amplitude normalized by SM
alone (98.46%) and between the second positive
P1 of SM P1 of M
1.4
1.2
1
0.8
0.6
0.4
0.2 SM
0
50
ISI (ms)
150
250
Figure 8. P1 amplitude under BM-on-T and BM-on-SM. The maximal amplitudes of the first positive response peak (P1) for the two successive stimuli presented under the two BM conditions at ISIs of 0, 50, 150, or 250 ms were calculated. The upper panel summarizes the results under the BM-on-T condition normalized by the P1 of T: P1 of T was calculated in the time-window defined by the response to T (red line); P1 of M was calculated in the time-window defined by the response to M, presented at different delays corresponding to the different ISIs (green line). The lower panel summarizes the results under the BM-on-SM condition normalized by the P1 of SM: P1 of SM was calculated in the time-window defined by the response to SM (red line); P1 of M was calculated in the time-window defined by the response to M, presented at different delays corresponding to the different ISIs (green line).
fect was observed for both FM and BM, but only with a spatial separation of 2λ (i.e., interactions within
and is sustained, lagging behind the stimulus both at
the same receptive field). However, facilitation was
the onset and offset, inhibition is rapid and transient,
observed at 3λ (i.e., interactions between different
following the onset and offset of the stimulus more
receptive fields), with FM and SM, but not with BM.
precisely.
This complex pattern of results can be explained by
When backward masking was applied to a low-
two effects: (1) asymmetry between the processing
contrast target in the context of two higher-contrast
of the target and the mask: the response to the mask
masks (BM-on-SM condition), the results showed that
is delayed behind the response to the target, due to
BM affected the lateral facilitation induced by the first
the extra time required for the lateral propagation
mask on the target and not the detection of the target
of the response from the mask to the target’s loca-
per se. Therefore, we suggest that BM-on-SM abol-
tion. The lag between the responses to the mask and
ishes the facilitation evoked by SM on the target. An
the target increases with increasing distance. Thus,
alternative interpretation, according to which the sec-
the interaction between the two responses is possible
ond mask suppresses the response to the first mask, is
only if the lateral propagation reaches the target’s
ruled out both by the results of the psychophysical ex-
location, within a limited time-window (efficient
periments (Figures 4, 5) and by the VEP results (Figure
processing time). (2) Asymmetry between inhibition
8). Moreover, the VEP results show the opposite: the
and excitation: whereas excitation develops slowly
response to the second mask decreased, whereas the
161 http://www.ac-psych.org
Uri Polat, Anna Sterkin, and Oren Yehezkel
response to the first remained unchanged. Thus, the
at SOAs of 50 ms after the target (ISI of 0 ms), the
VEP, in concert with the behavioral findings, rules out
mask response would propagate to the target location
the possibility of a pattern masking effect of the sec-
with a resulting delay of 260 to 310 ms, which is still
ond mask on the first mask.
within the efficient processing time-window, enabling the two signals to interact and produce a masking effect.
The possible neuronal mechanism underlying masking
In agreement with the above calculation, our results
What is the possible neuronal mechanism underlying
waveform evoked by SM. Note that the delay of the P1
the observed masking effects? Polat and Sagi (2006)
response peak under this condition is exactly 210 ms.
suggested that both facilitation and masking reflect
However, if the mask is presented with a long enough
excitatory and inhibitory interactions within neuronal
temporal separation (ISI of 150), the resulting delay of
networks in response to Gabor stimuli (Adini et al.,
the mask response propagation to the target location is
1997; Hirsch & Gilbert, 1991; Polat et al., 1998). The
estimated at 410 to 460 ms, which is beyond the upper
presentation of a mask initiates both excitatory and
limit of an efficient processing time-window, resulting
inhibitory processes. However, whereas excitation
in no masking effect. And again, in agreement with the
develops slowly and thus lags behind the stimulus,
above calculation, our results show that the response to
inhibition is rapid and follows the onset and offset of
target under the BM-on-T condition at an ISI of 150 ms is
the stimulus more closely. Thus, when the first mask
similar in terms of amplitude and waveform to the target
is turned off, the inhibition decays rapidly, whereas
presented alone, indicating no masking effect.
(Figure 7) show a waveform under the BM-on-T condition with an ISI of 0 ms, which is highly similar to the
the sustained excitation persists, resulting in lateral
In FM, when the mask is presented 50 ms be-
facilitation of the target. This suggestion is supported
fore the target, the feedforward response to the tar-
by the relatively slow time scale that characterizes lat-
get would be delayed by about 100 ms relative to the
eral interactions (Bringuier et al., 1999; Malonek et al.,
mask response. However, the lateral propagation of the
1994; Series et al., 2003) and strong, transient (Borg-
mask response (with a delay of about 50 to 100 ms,
Graham, Monier, & Fregnac, 1998) and fast inhibition
i.e., within the efficient processing time-window of the
(Bair, Cavanaugh, & Movshon, 2003).
target) would modulate the feedforward processing of the
In the present study we highlight the importance of
target, resulting in a masking effect. In SM, the feedfor-
the temporal matching between feedforward input and
ward delay of the target (210 ms) is temporally matched
lateral propagation, by monitoring their delays using
with the resulting delay of the mask response (i.e., the
VEP measurements. The response delay decreases with
sum of the feedforward delay of 160 ms and the lateral
increasing target contrast by up to 100 ms (our unpub-
propagation delay of 50 to 100, which is 210 to 260 ms).
lished data), which is consistent with data revealed from
Thus, the network response is biased towards excitation,
single unit recordings. Here we show that the delay of
resulting in facilitation of the response to the target.
the peak response to the target presented alone was 210 ms (on average), whereas the corresponding delay of the mask response was 160 ms, indicating that the feedforward signal of the mask precedes the signal of the target (low contrast) by 50 ms. Because the speed
The inhibition-excitation account and its relationship to insideoutside the receptive field
of lateral propagation of the mask response is slow, it
A BM effect (suppression) on the target was observed
reaches the target’s location with a delay of an additional
for a target-to-mask separation of 2λ, but not of 3λ.
50 to 100 ms (Polat & Sagi, 2006). Thus, the resulting
The lateral masking effect is composed of inhibition
delay of the lateral masking effect is 210 to 260 ms. As
and excitation. As previously mentioned, the inhibitory
shown in Figure 2, an efficient integration time of the
response is rapid and transient. As discussed above,
target (at the threshold of contrast detection) is about
in BM with ISIs of 50 to 100 ms, the rapidly develop-
100 ms. Therefore, the time-window for any efficient
ing inhibition coincides with the target response, which
interactions with the target processing is from 210 to
would result in a suppressive effect, but the relatively
310 ms after the onset of the target. Thus, any modula-
delayed excitation abrogates the inhibition. However,
tion of the response to the target by the mask may occur
when the mask is positioned at a distance of 2λ (i.e.,
only if the responses to the target and the mask are
overlapping with the receptive field of the target), the
temporally matched within this efficient processing time-
dominant effect would be inhibitory. The strong inhibi-
window. Thus, in BM, when the mask that is presented
tory response is composed of the lateral component as
162 http://www.ac-psych.org
Spatio-temporal dynamics of visual masking
well as the local one (from the vicinity of the receptive
perceived masking effect. Moreover, the negative peak
field of the target). The lateral propagation of the excita-
response, N1, was found to be markedly reduced (in
tion produced by the mask towards the target represen-
absolute terms) under the BM-on-SM condition at an
tation is relatively fast, since the spatial separation of
ISI of 50 ms, as opposed to (van Aalderen-Smeets et
2λ is relatively short. Therefore, the excitation is tem-
al., 2006), who did not observe any effect of BM at this
porally matched with the stronger transient inhibition
delay. It is possible that the “pseudo” mask, although
from within the receptive field of the target. Thus, the
having different features from the effective mask, may
lateral excitation and the local inhibition interact within
still have interfered with the receptive field of the tar-
the integration time of the target. This explanation is
get, in a way similar to that of the effective mask, thus
consistent with the physiological study, showing that the
producing an undistinguishable pattern of interference
main effect of temporal masking is evident only when
with the target processing in the physiological results.
the mask is positioned within a distance that overlaps
The psychophysical findings for the two types of masks,
with the receptive field (Macknik & Livingstone, 1998).
although differential, are influenced by both the percep-
When the separation between the mask and the tar-
tual and the cognitive (i.e., post-perceptual) components
get was increased, the masking effect disappeared, in
of the behavioral response.
agreement with earlier studies (Breitmeyer, 1984).
Our results suggest that the masking effects, either
Usually the distinction between pattern and lateral
suppression or facilitation, reflect integration in the spa-
masking is based on an implicit assumption that the sharp
tial and temporal domains of the feedforward response to
boundaries that allow a visually apparent gap between
the target and the lateral inputs evoked by the mask (ex-
the target and mask are indicative of a distinct activation
citatory and/or inhibitory). The excitation evoked by the
of the center and surround. However, within the context
mask is relatively delayed to the target stimulus, because
of neuronal modeling, an important factor is the overlap
it develops and propagates slowly from the mask’s loca-
between the receptive fields of the units responding to
tion to the target’s location. The inhibition produced in
the target and mask, which may account for lateral inter-
the vicinity of the target, however, evolves more rapidly,
ference regardless of whether the stimuli overlap or not.
and therefore follows the onset and offset of the stimulus
Physiological studies that showed clear effects of surround
more closely. It is also possible that the temporal prop-
modulations on the classical receptive field (Kapadia et al.,
erties of the responses in our study can be accounted
1995; Mizobe et al., 2001; Polat et al., 1998), positioned
for by the dual-channel model, which assumes effects of
the mask at a distance that, when presented alone, evoked
transient inhibition on sustained excitation (Breitmeyer,
no response from the target location. Thus, the masking
1984). However, our model differs from the dual-channel
effect may possibly be confounded by mixed responses
model in assuming that both inhibition and excitation re-
from the target’s location as well as from the mask’s loca-
main active as long as the stimulus is present. Moreover,
tion. Therefore, we propose that pattern and lateral mask-
our model and results disagree with the model of object-
ing may be inseparable in some of the temporal masking
substitution masking (Enns & Di Lollo, 2000) in showing
studies, especially for stimuli presented in periphery.
that rather than being unaffected, as expected by the model, the response to the mask is reduced. To conclude, the interplay between the sustained
Is the VEP just a linear summation of the target and mask responses?
lateral excitation and the transient inhibition may fa-
It has been suggested that changes in the early com-
cept by increasing the survivability of the object and its
ponents of the VEP signals reflect linear summations of
accessibility for perceptual awareness.
cilitate the grouping of local elements into a global per-
the waveforms but not the real perceptual effect (van Aalderen-Smeets et al., 2006). However, our VEP re-
Acknowledgements
sults show that the measured signals are very different
This research was supported by grants from the The
from the prediction of a linear summation of the target
National Institute for Psychobiology in Israel founded
and mask waveforms, whereas there is an interaction
by The Charles E. Smith Family (UP and AS) and the
between the target and the mask (i.e., for ISIs of up
Israel Science Foundation (UP).
to 50 ms). However, for ISIs longer than 150 ms, the mask and the target responses are independent (and
References
thus equal to the prediction of a linear summation).
Adini, Y., & Sagi, D. (2001). Recurrent networks in hu-
Consequently, at such ISIs no masking effect is evident.
man visual cortex: psychophysical evidence. J. Opt.
Thus, the evoked potentials seem to mirror the reported
Soc. Am. A. Opt. Image. Sci. Vis., 18, 2228-2236.
163 http://www.ac-psych.org
Uri Polat, Anna Sterkin, and Oren Yehezkel
11551058 Adini, Y., Sagi, D., & Tsodyks, M. (1997). Excitatoryinhibitory network in the visual cortex: psychophysical evidence. Proc. Natl. Acad. Sci. USA, 94, 10426-10431.
333-342. Enns, J.T., & Di Lollo, V. (2000). What’s new in visual masking? Trends Cogn. Sci., 4, 345-352. Francis, G. (2000). Quantitative theories of meta-contrast masking. Psychological Review, 107, 768-785.
Albrecht, D. G. (1995). Visual cortex neurons in monkey and cat: effect of contrast on the spatial and temporal phase transfer functions. Vis. Neurosci., 12, 1191-1210. Bair, W., Cavanaugh, J. R., & Movshon, J. A. (2003). Time course and time-distance relationships for surround suppression in macaque V1 neurons. J. Neurosci., 23, 7690-7701. Bauer, R., & Heinze, S. (2002). Contour integration in
Herzog, M. H., & Fahle, M. (2002). Effects of grouping in contextual modulation. Nature, 415, 433-436. Hirsch, J. A., & Gilbert, C. D. (1991). Synaptic physiology of horizontal connections in the cat’s visual cortex. Journal of Neuroscience, 11, 1800-1809. Jeffreys, D.A. (1971). Source locations of pattern-related visual evoked potentials (VEP) components. Electroencephalogr. Clin. Neurophysiol., 30, 367.
striate cortex. Classic cell responses or cooperative selection? Exp. Brain Res., 147, 145-152.
Jeffreys, D.A., & Axford, J.G. (1972). Source locations
Bonneh, Y., & Sagi, D. (1998). Effects of spatial con-
of pattern-specific components of human visual
figuration on contrast detection. Vision Res., 38,
evoked potentials. II. Component of extrastriate
3541-3553.
cortical origin. Exp. Brain Res., 16, 22-40.
Borg-Graham, L. J., Monier, C., & Fregnac, Y. (1998).
Jeffreys, D.A., & Musselwhite, M.J. (1986). A visual
Visual input evokes transient and strong shunting
evoked potential study of metacontrast masking.
inhibition in visual cortical neurons. Nature, 393,
Vision Res., 26, 631-642.
369-373.
Kapadia, M.K., Ito, M., Gilbert, C.D., & Westheimer,
Breitmeyer, B. G. (1984). Visual masking: An in-
G. (1995). Improvement in visual sensitivity by
tegrative approach. New York: Oxford University
changes in local context: parallel studies in human
Press.
observers and in V1 of alert monkeys. Neuron, 15,
Breitmeyer, B. G., & Öğmen, H. (2000). Recent
843-856.
models and findings in visual backward masking:
Kapadia, M.K., Westheimer, G., & Gilbert, C.D. (2000).
A comparison, review, and update. Perception &
Spatial distribution of contextual interactions in
Psychophysics, 62, 1572-1595.
primary visual cortex and in visual perception. J.
Bridgeman, B. (1975). Correlates of metacontrast in single cells of the cat visual system. Vision Res., 15, 91-99. Bridgeman, B. (1980). Temporal response characteris-
Neurophysiol., 84, 2048-2062. Kovacs, I. (1996). Gestalten of today: early processing of visual contours and surfaces. Behav. Brain Res., 82, 1-11.
tics of cells in monkey striate cortex measured with
Legge, G.E. (1978). Sustained and transient mecha-
metacontrast masking and brightness discrimina-
nisms in human vision: temporal and spatial proper-
tion. Brain Res., 196, 347–364.
ties. Vision Res., 18, 69-81.
Bridgeman, B. (1988). Visual evoked potentials:
Levitt, H. (1971). Transformed up-down methods in
concomitants of metacontrast in late components.
psychoacoustics. Journal of Acoustical Society of
Percept. Psychophys., 43, 401-403.
America, 49, 467.
Bringuier, V., Chavane, F., Glaeser, L., & Fregnac, Y.
Li, W., & Gilbert, C.D. (2002). Global contour saliency
(1999). Horizontal propagation of visual activity in
and local colinear interactions. J. Neurophysiol., 88,
the synaptic integration field of area 17 neurons. Science, 283, 695-699. Cass, J.R., & Spehar, B. (2005). Dynamics of collinear contrast facilitation are consistent with long-range horizontal striate transmission. Vision Res., 45, 2728-2739.
2846-2856. Macknik, S.L., & Livingstone, M.S. (1998). Neuronal correlates of visibility and invisibility in the primate visual system. Nat. Neurosci., 1, 144-149. Malonek, D., Tootell, R.B., & Grinvald, A. (1994). Optical imaging reveals the functional architecture
Chavane, F., Monier, C., Bringuier, V., Baudot, P., Borg-
of neurons processing shape and motion in owl
Graham, L., Lorenceau, J., & Fregnac, Y. (2000). The
monkey area MT. Proceedings of the Royal Society
visual cortical association field: a Gestalt concept or
of London. Series B: Biological Sciences, 258, 109-
a psychophysiological entity? J. Physiol. Paris, 94,
119.
164 http://www.ac-psych.org
Spatio-temporal dynamics of visual masking
Mandon, S., & Kreiter, A.K. (2005). Rapid contour integration in macaque monkeys. Vision Res., 45, 291-300. Mizobe, K., Polat, U., Pettet, M.W., & Kasamatsu, T. (2001). Facilitation and suppression of single stri-
Polat, U., & Tyler, C.W. (1999). What pattern the eye sees best. Vision Res., 39, 887-895. Rosen, A., Belkin, M., & Polat, U. (2005). Spatial and temporal processing in the visual system. Reviews in the Neuroscience, 16, 53.
ate-cell activity by spatially discrete pattern stimuli
Schiller, P.H., & Chorover, S.L. (1966). Metacontrast:
presented beyond the receptive field. Vis. Neurosci.,
its relation to evoked potentials. Science, 153,
18, 377-391.
1398-1400.
Polat, U. (1999). Functional architecture of long-range
Schmidt, K.E., Goebel, R., Lowel, S., & Singer, W.
perceptual interactions. Spat. Vis., 12, 143-162.
(1997). The perceptual grouping criterion of colinearity is reflected by anisotropies of connections
Polat, U., Mizobe, K., Pettet, M.W., Kasamatsu, T., & Norcia, A.M. (1998). Collinear stimuli regulate visual responses depending on cell’s contrast threshold. Nature, 391, 580-584. Polat, U., & Norcia, A.M. (1996). Neurophysiological evidence for contrast dependent long-range facilitation and suppression in the human visual cortex. Vision Res., 36, 2099-2109. Polat, U., & Norcia, A.M. (1998). Elongated physiologi-
in the primary visual cortex. Eur. J. Neurosci., 9, 1083-1089. Series, P., Lorenceau, J., & Fregnac, Y. (2003). The “silent” surround of V1 receptive fields: theory and experiments. J. Physiol. Paris, 97, 453-474. Sugita, Y. (1999). Grouping of image fragments in primary visual cortex. Nature, 401, 269-272. Tanaka, Y., & Sagi, D. (1998). Long-lasting, long-range detection facilitation. Vision Res., 38, 2591-2599.
cal summation pools in the human visual cortex. Vision Res., 38, 3735-3741.
van
Aalderen-Smeets,
S.,
I,
Oostenveld,
R.,
&
Polat, U., & Sagi, D. (1993). Lateral interactions be-
Schwarzbach, J. (2006). Investigating neurophysi-
tween spatial channels: suppression and facilitation
ological correlates of metacontrast masking with
revealed by lateral masking experiments. Vision
magnetoencephalography. Advances in Cognitive
Res., 33, 993-999.
Psychology, 2, 21-35. ACP
Polat, U., & Sagi, D. (1994). The architecture of perceptual spatial interactions. Vision Res., 34, 7378.
Watson, A.B., Barlow, H.B., & Robson, J.G. (1983). What does the eye see best? Nature, 302, 419-422. Zenger, B., & Sagi, D. (1996). Isolating excitatory and
Polat, U., & Sagi, D. (2006). Temporal asymmetry of
inhibitory nonlinear spatial interactions involved in
collinear lateral interactions. Vision Res., 46, 953-
contrast detection. Vision Research, 36, 2497-2513.
960.
165 http://www.ac-psych.org