www.nature.com/scientificreports
OPEN
Spatiotemporal neural network dynamics for the processing of dynamic facial expressions
received: 09 March 2015 accepted: 30 June 2015 Published: 24 July 2015
Wataru Sato1,*, Takanori Kochiyama2,* & Shota Uono1 The dynamic facial expressions of emotion automatically elicit multifaceted psychological activities; however, the temporal profiles and dynamic interaction patterns of brain activities remain unknown. We investigated these issues using magnetoencephalography. Participants passively observed dynamic facial expressions of fear and happiness, or dynamic mosaics. Source-reconstruction analyses utilizing functional magnetic-resonance imaging data revealed higher activation in broad regions of the bilateral occipital and temporal cortices in response to dynamic facial expressions than in response to dynamic mosaics at 150–200 ms and some later time points. The right inferior frontal gyrus exhibited higher activity for dynamic faces versus mosaics at 300–350 ms. Dynamic causalmodeling analyses revealed that dynamic faces activated the dual visual routes and visual–motor route. Superior influences of feedforward and feedback connections were identified before and after 200 ms, respectively. These results indicate that hierarchical, bidirectional neural network dynamics within a few hundred milliseconds implement the processing of dynamic facial expressions.
Dynamic changes in facial expressions of emotion are a particularly valuable source of information in face-to-face interactions. From an evolutionary perspective1, the human mind has evolved to process the dynamic facial expressions of conspecifics efficiently. Behavioral studies have revealed that dynamic facial expressions automatically induce multiple psychological activities such as perceptual enhancement2, emotional responses3, and facial mimicry4. Consistent with these behavioral data, neuroimaging studies using functional magnetic resonance imaging (fMRI) and positron-emission tomography have shown that several cortical and subcortical regions are more active when viewing dynamic facial expressions compared to control conditions5–10. The cortical regions consistently include the human V5 region, fusiform gyrus (FG), superior temporal sulcus (STS), and inferior frontal gyrus (IFG). However, the temporal profile of the activity in these brain regions in response to dynamic facial expressions remains unclear. To understand the neural mechanisms, that is, the causal relationships among the brain regions, temporal information is indispensable11. Electrophysiological studies involving recording electroencephalography (EEG), magnetoencephalography (MEG), or intracranial EEG are more appropriate for understanding this issue at a higher temporal resolution. However, the few relevant electrophysiological studies have reported inconsistent findings12–18. For example, an EEG study found that dynamic faces, compared to dynamic mosaics, activated the posterior cortices at about 170 ms, and the researchers speculated that the source of these activities would be within the STS12. This contrasts with an MEG study, which reported that the current dipole of posterior activity for dynamic facial stimuli during this time period was located in the V5 region13. These inconsistencies are mainly caused by limitations in the spatial resolution of the electrophysiological measures19. 1
Department of Neurodevelopmental Psychiatry, Habilitation and Rehabilitation, Graduate School of Medicine, Kyoto University, 53 Shogoin-Kawaharacho, Sakyo, Kyoto 606-8507, Japan. 2Brain Activity Imaging Center, Advanced Telecommunications Research Institute International, 2-2-2 Hikaridai, Seika-cho, Soraku-gun, Kyoto 619-0288, Japan. *These authors contributed equally to this work. Correspondence and requests for materials should be addressed to W.S. (email:
[email protected]) Scientific Reports | 5:12432 | DOI: 10.1038/srep12432
1
www.nature.com/scientificreports/ Furthermore, no studies have empirically tested the neural network dynamics (i.e., dynamic causal relationships among the brain regions) involved in the processing of dynamic facial expressions at a millisecond temporal resolution. It has been theoretically postulated that multiple brain regions would constitute the functional network involved in processing dynamic faces20–21, and some previous neuroimaging studies have attempted to reveal these neural-interaction patterns by analyzing hemodynamic responses (e.g., Ref. 22). However, electrical neuronal communication is implemented rapidly within only a few hundred milliseconds23, and thus electrophysiological data analysis would be more appropriate for depicting such rapid networking patterns. Here we recorded MEG signals while participants viewed dynamic facial expressions of fear and happiness as well as dynamic mosaics. We presented computer-morphed dynamic facial expressions, which were shown to activate the widespread brain regions in previous neuroimaging studies24. To investigate the automatic processes in response to dynamic facial expressions, participants passively observed stimuli with dummy tasks. To depict brain activities with high spatial and temporal resolutions, we conducted source-reconstruction analysis utilizing fMRI data25. To investigate the neural network dynamics over distributed brain regions that process dynamic facial expressions, we further conducted dynamic causal modeling (DCM)26.
Results
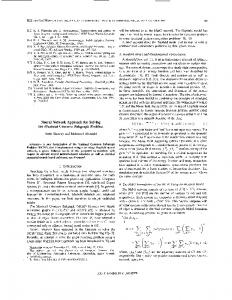
Behavioral performance. Performance on the dummy target-detection task was perfect and sufficiently rapid (correct identification rate = 100.0%; mean ± SD reaction time = 420.0 ± 64.4 ms). Regional brain activity. MEG data (Supplementary Fig. 1) were subjected to fMRI-constrained MEG source reconstruction24, and then analyzed using the random-effects general linear model (GLM) including stimulus type (dynamic facial expression versus dynamic mosaic), emotion (fear versus happiness), and time window (0–50, 50–100, 100–150, 150–200, 200–250, 250–300, 300–350, and 350–400 ms) as repeated-measures factors of interest. The main effect of stimulus type, which contrasted dynamic facial expressions and dynamic mosaics (Table 1; Fig. 1), did not reveal any significant activation during the time windows of 0–50, 50–100, or 100–150 ms. Broad ranges of bilateral posterior regions were significantly activated during 150–200 ms, including the activation foci of the middle temporal gyrus adjacent to the inferior temporal sulcus, corresponding to the human V527, FG, and STS. Although the activation patterns changed slightly, significant activation of the posterior cortices was observed across all of the later time windows. In addition, at 300–350 ms, significant activation was observed in the right IFG. The main effect of emotion and the interaction between the stimulus type and emotion were also tested in each time window; however, no brain region showed significant activation. Figure 1c shows the averaged root mean square (RMS) time course of source activities in the regions of interest (ROIs). Prominent peaks of activity in the V5, FG, and STS were observed about 170 ms after the stimulus onset, clearly discriminating the dynamic facial expressions and mosaics. These could also be differentiated in the same regions after 200 ms with visible small peaks. Although there were small peaks of IFG activity during 100–200 ms and 200–300 ms, there were no differences between stimulus type conditions. The peak at about 320 ms differentiated the dynamic facial expressions and mosaics in the IFG. DCM. DCM analyses were conducted to test our models (Fig. 2a). To define the interacting cortical network, we adopted a combination of the dual visual routes model20 and the visual–motor route model21 to process dynamic social signals. For the dual visual routes model, Oram and Perrett20 suggested that cortical visual processing involves the ventral and dorsal pathways that send outputs to the STS region, which acts as a convergence zone. This model is supported by several physiological28 and anatomical29 studies in monkeys. For the visual–motor route model, de Antonia and Hamilton21 proposed that the direct functional connectivity between the STS and IFG implements motor mimicry. Consistent with this, several anatomical studies in humans30 and nonhuman primates31 have shown that the STS and IFG are directly connected. Based on these findings, we hypothesized that the cortical network, in which the dorsal (i.e., V1–V5) and ventral (i.e., V1–FG) pathways converge on the STS, which interacts with the IFG, is involved in the processing of dynamic facial expressions. We examined whether these connections could be modulated during the processing of dynamic facial expressions and whether connectivity modulation was observed only in the forward connections or in both the forward and backward connections. Several computational theories have pointed out that such differences could have a significant impact on cognitive functions32–33. Random-effects Bayesian model selection (BMS) was applied with different locations of modulatory effects for dynamic facial expression. The BMS exceedance probability was highest for the model including modulatory effects in all forward and backward connections (Fig. 2b). Comparisons of model families confirmed that models with modulatory effects on both forward and backward connections better accounted for the data than did models without modulation or those with only forward-connection modulation. To further elucidate the neural coupling temporal profile, specifically the importance of feedback modulation, we compared models with and without modulatory effects on backward connections over Scientific Reports | 5:12432 | DOI: 10.1038/srep12432
2
www.nature.com/scientificreports/ MNI coordinate Time (ms)
Anatomical region
0–50
None
50–100
None
X
Y
Z
Z-value
–6
8.33
100–150
None
150–200
R inferior temporal gyrus
50
–62
R inferior temporal gyrus
54
–66
–2
8.23
R fusiform gyrus
42
–60
–20
7.75
R inferior occipital gyrus
42
–78
–2
7.36
R middle temporal gyrus
48
–46
18
5.51
R middle temporal gyrus
42
–52
14
4.25
L inferior occipital gyrus
–48
–76
–12
8.03
200–250
250–300
300–350
350–400
L fusiform gyrus
–38
–58
–20
7.82
L middle occipital gyrus
–40
–70
6
7.12
L inferior temporal gyrus
–58
–56
–6
6.09
L middle temporal gyrus
–60
–50
2
4.79
L middle occipital gyrus
–16
–100
10
6.11 5.23
Cluster size (mm3)
33912
31968
10184
L calcarine sulcus
–4
–94
6
R inferior temporal gyrus
56
–62
–8
5.87
R fusiform gyrus
42
–40
–24
4.1
L inferior temporal gyrus
–52
–54
–12
4.24
2936
R middle temporal gyrus
54
–56
0
4.8
6848
R middle temporal gyrus
54
–66
10
4.71
R lingual gyrus
12
–86
–8
4.1
R calcarine sulcus
8
–80
2
4.09
L middle occipital gyrus
–46
–74
12
5.13
L inferior occipital gyrus
–50
–80
–2
3.74
R middle temporal gyrus
54
–64
8
5.27
R middle temporal gyrus
46
–52
8
4.91
R calcarine sulcus
8
–80
2
4.38
9504
4704
10232
7320
4472
R inferior frontal gyrus
44
12
26
4.71
2560
L middle temporal gyrus
–46
–74
12
5.69
13056
L inferior occipital gyrus
–48
–74
–4
4.75
R middle occipital gyrus
54
–64
8
5.38
R middle temporal gyrus
46
–54
8
5.21
L inferior temporal gyrus
–64
–46
–12
3.93
7216
2680
Table 1. Brain regions showing significant activation in response to dynamic facial expressions versus dynamic mosaics.
post-stimulus time windows of 100–400 ms in 50-ms increments. The random-effects BMS showed that, although the model without backward-connection modulation fitted better with the data until 150 ms, the model with backward modulation better accounted for the data after 200 ms (Fig. 3).
Discussion
Spatiotemporal profile of brain activity. Our regional brain activity results showed that obser-
vation of dynamic facial expressions, compared with dynamic mosaics, activated distributed cortical regions, including the V5, FG, STS, and IFG. The activation of these regions is consistent with the findings of previous neuroimaging studies7. However, because neuroimaging techniques measure neuronal activity using only indirect hemodynamic responses, our results extend these findings, indicating that the electrical activity of these regions is enhanced during the observation of dynamic facial expressions. The activation of these brain regions in response to dynamic facial expressions is consistent with the results of previous EEG or MEG recordings and their source localizations that reported the activities of the V513,
Scientific Reports | 5:12432 | DOI: 10.1038/srep12432
3
www.nature.com/scientificreports/
Figure 1. Regional brain activity analysis. (a) Statistical parametric maps (SPMs) showing brain regions activated in response to dynamic facial expressions versus dynamic mosaics at each 50-ms time window during 0–400 ms after the stimulus onset. The areas of activation are rendered on spatially-normalized brains. Left and right columns depict activities in the left and right hemispheres, respectively. The extent threshold of p