ing 10 native (SI ET H2) and 10 non-native (SI ET S3) speakers. Both sets cover ... Although MFCC features are supposed to be speaker independent in a first ...
Speaker Identification – Comparing Linear Regression Based Adaptation and Acoustic High-Level Features Frank Wallhoff, Bj¨orn Schuller, and Gerhard Rigoll Lehrstuhl f¨ ur Mensch-Maschine-Kommunikation, D-80333 M¨ unchen, Germany, Email: {wallhoff,schuller,rigoll}@tum.de
Introduction In this work two different approaches for speaker identification are presented. Both systems are evaluated and compared on subsets of the WSJ database [1] containing 10 native (SI ET H2) and 10 non-native (SI ET S3) speakers. Both sets cover spontaneous spoken material, half from men and half from women. For each speaker between 61 and 82 samples with lengths varying from 2s up to 16s were provided. The sum of all utterances is 1,430.
Linear Regression In the context of continuous Hidden Markov Model (HMM) based speech-recognition, linear regression approaches have become popular to adapt the acoustic models to the specific speaker’s characteristics. The well known Maximum Likelihood Linear Regression (MLLR) [2] and the Maximum Mutual Information (MMI) based Scaled Likelihood Linear Regression (SLLR) [3] are just two of them, which differ primarily in the training objective they are maximizing. MLLR matrices are computed by T Y p(xt |qt , M ) (1) Mmllr = argmax M t=1
,while the criterion for SLLR is Msllr = argmax M
T Y
p(xt |qt , M ) . q∈Q P (q)p(xt |q, M )
P t=1
(2)
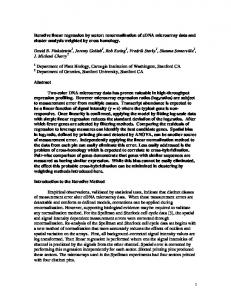
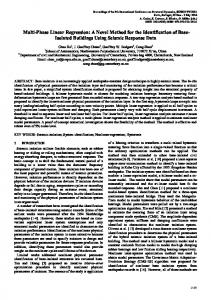
The common basic idea of the adaptation techniques MLLR and SLLR is the unified linear transformation of the parameters of a large cluster of HMM states. In continuous HMM systems, the transformation is restricted to the Gaussians’ mean vectors µ, as they define the distributions’ major characteristics: µ∗ = M µ. Although MFCC features are supposed to be speaker independent in a first approximation, both MLLR and SLLR have successfully been applied in speaker adaptation scenarios. Besides the adaptation it is now considered that the regression matrices describe the individual speakers’ characteristics. In Figure 1 three typical matrices from two speakers are depicted. Therefore a basic SI-LVCSR system is adapted unsupervised to a given amount of reference and test material, and the regression matrices are stored in this approach. The SI base system covers a vocabulary of 5k, a bigramm LM, treebased clustered word internal 3-state triphones with 12 MFCCs, energy, their ∆s and ∆∆s with up to 10 mixtures. The SI models were trained on the 1992 WSJ-set
Quelle: DAGA 05, München, DEGA, Berlin
”si-84”. After an unsupervised adaptation to unknown material, a speaker can be identified by using the nearest neighbor via Euclidean distance. Generally speaking #References 10 1 10 20 20
#Tests 10 1 1 2 1
Accuracy [%] 100.00 73.37 90.01 96.2 92.87
Type MLLR MLLR SLLR SLLR SLLR
Table 1: Scores using different constellations.
the discriminative adaptation objective is superior compared to ML. Depending on the amount of available reference and test samples, the regression based approach can achieve up to the perfect recognition score. In more detail it can be observed, that for a robust identification at lest 3 utterances are needed to estimate the matrices.
High-Level Features Alternatively we apply static acoustic high-level features for speaker identification. These are derived phrasewisely. As an optimal set of such global features is broadly discussed, we considered an initially large set of 276 acoustic hi-level features [4] which cannot all be described in detail here. However, the target is to become utmost independent of the spoken content but model speakers’ characteristics. The basis is formed by the raw contours of the time signal, pitch, formants, energy, spectral development, and Harmonics-to-Noise-Ratio (HNR). 20 ms frames of the speech signal are analyzed every 10 ms using a Hamming window function. As pitch detection algorithm we apply an average magnitude difference function. The values of energy resemble the logarithmic mean energy within a frame. For spectral development we use MFCCs and a FFT-spectrum. Low-pass SMA filtering smoothes the raw contours prior to the statistical analysis. The higher level features are then subsequently derived and normalized. Table 2 shows the distribution of features among their general type. Duration 5
Formants 105
Pitch 12
HNR 3
Energy 11
MFCC 120
Time Signal 3
FFT 17
Table 2: Distribution of features.
In order to reduce the extraction effort and complexity for the classifier we use Feature Selection (FS) methods. The original set will be analyzed by three different FS methods: Firstly, Information Gain Ratio (IGR) is used, which is a fast filter-based FS that allows for single feature relevance estimation. Secondly, Sequential Forward
1a
1b
1c
Figure 1: Surface representation of three regression matrices, left (a) and the middle (b) matrix are from the same speaker.
Floating Search (SFFS), is considered. SFFS uses the target classifier, here Support Vector Machines (SVM), as optimization criterion for a set of features as a whole. It obtains higher accuracy at low feature vector dimensionality, and is known as powerful wrapper-based FS. For comparability reasons we also chose reduction based on Principal Component Analysis (PCA). Thereby artificial features obtained by linear superposition of the original features are selected with high corresponding eigen vectors. While this approach is very popular and shows very good performance at low dimensionality, it inherits two major drawbacks: The complete original feature set needs to be extracted and it works well mostly for Gaussian distributions. Table 3 shows performances obtained with the diverse FS. The 16 top ranked attributes are presented with their according IGR. We also show results for use of traditional MFCC based speaker identification. Rank 1 2 3 4 5 6 7 8 9 10 11 12 13 14 15 16
Feature F7 distance to F0 F5 distance to F0 Pitch average F3 distance to F0 F4 distance to F0 F6 distance to F0 MFCC15 average Pitch area F2 distance to F0 Pitch relative minimum F1 distance to F0 Pitch std. deviation MFCC2 std. deviation F7 bandwidth mean gradient Spectral centroid maximum F6 average
IGR 0.66 0.66 0.64 0.63 0.63 0.61 0.54 0.53 0.53 0.53 0.52 0.47 0.45 0.45 0.44 0.44
Table 3: Ranked Features with information gain ratio.
In order to find an optimal classifier for this task we compared four generally different classifiers in a threefold stratified cross validation. We chose K ∗ , an entropy based nearest distance classifier, Naive Bayes as stochastic classifier, a C4.5 decision tree, which we also boosted, and SVMs as kernel machines. In the table only results with optimal parameter configuration are presented. In the case of SVM using a polynomial kernel an error free classification could be obtained.
Classifier K∗ Naive Bayes C4.5 Boosting C4.5 SVM, p=3
Accuracy [%] 95.48 97.33 88.50 96.72 100.00
Table 4: Comparison of different classifiers.
In the last table the performanceis of 3 different selection techniques are tested considering a diverse number of features. Dim. 276 80 50 20 10 5 2
IGR FS [%] 100.00 100.00 99.58 96.92 79.46 57.70 27.52
SVM SFFS [%] 100.00 99.79 99.18 97.33 93.84 61.40 31.01
PCA FS [%] 100.00 100.00 100.00 98.36 94.87 86.04 33.88
Table 5: Results for different amount of features.
References [1] Paul, D. B.; Baker, J. M.: The Design for the Wall Street Journal-based CSR Corpus, Proceedings DARPA Speech and Natural Language Workshop, Morgan Kaufmann, pp. 357–362, Pacific Grove, CA, 1992. [2] Leggetter, C.J.; Woodland, P.C.: Flexible Speaker Adaptation Using Maximum Likelihood Linear Regression, Proceedings Eurospeech’95, pp. 1155–1158, Madrid, 1995. [3] Wallhoff, F.; Willett, D.; Rigoll, G.: Scaled Likelihood Linear Regression for Hidden Markov Model Adaptation, Proceegings Eurospeech’01, Aalborg, Denmark, September 2001. [4] Schuller, B.; Jimenez Villar, R.; Rigoll, G.; Lang, M.: Meta-Classifiers in Acoustic and Linguistic Feature Fusion-Based Affect Recognition, Proceedings ICASSP’05, Vol. I, pp. 325–328 Philadelphia, PA, USA, 2005.